Review
. 2017 Oct;37(5):510-537.
doi: 10.1055/s-0037-1608808. Epub 2017 Dec 5.

Neuroimaging in Dementia

Affiliations
Review

Neuroimaging in Dementia

Adam M Staffaroni et al. Semin Neurol. 2017 Oct.

Abstract

Although the diagnosis of dementia still is primarily based on clinical criteria, neuroimaging is playing an increasingly important role. This is in large part due to advances in techniques that can assist with discriminating between different syndromes. Magnetic resonance imaging remains at the core of differential diagnosis, with specific patterns of cortical and subcortical changes having diagnostic significance. Recent developments in molecular PET imaging techniques have opened the door for not only antemortem but early, even preclinical, diagnosis of underlying pathology. This is vital, as treatment trials are underway for pharmacological agents with specific molecular targets, and numerous failed trials suggest that earlier treatment is needed. This article provides an overview of classic neuroimaging findings as well as new and cutting-edge research techniques that assist with clinical diagnosis of a range of dementia syndromes, with an emphasis on studies using pathologically proven cases.


Conflict of interest statement

Disclosure The authors report no conflicts of interest in this work.

Figures

Fig. 1
Fig. 1. T1 imaging in amyloid-PET confirmed AD variants
(A) LOAD 75-year-old female (MMSE: 17) with hippocampal atrophy on axial and coronal planes. Precuneus atrophy can be appreciated on sagittal imaging, along with some mild frontal atrophy. (B) EOAD 59-year-old female with cognitive impairments in multiple domains including memory and executive functioning (MMSE: 23; MOCA: 15). Prominent biparietal atrophy can be observed on sagittal and coronal planes, with relatively preserved medial temporal lobes on axial reconstruction compared with LOAD. (C) lvPPA female with lvPPA (MMSE: 28). Atrophy is lateralized to the left, primarily in the left temporoparietal region as seen on axial and coronal images. The precuneal atrophy observed on the sagittal images is typical of AD pathology. (D) PCA patient (MMSE: 18) with significant occipital and parietal atrophy, shown by arrows on all three planes. *Nonneurologic orientation (right is right). *Abbreviations: MMSE, mini-mental state examination; MoCA, Montreal Cognitive Assessment; LOAD, late onset Alzheimer’s disease; EOAD, early onset Alzheimer’s disease; PCA, posterior cortical atrophy.
Fig. 2
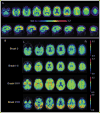
Fig. 2. Molecular positron emission tomography (PET) in Alzheimer’s disease (AD)
(A) Amyloid PET using Pittsburgh compound B. Heat map range (colored bar) of amyloid tracer uptake defined by distribution volume ratio (DVR). Amyloid PET has been approved for clinical use, and AD diagnosis is based on cortical amyloid ligand uptake. Amyloid ligands tend to have nonspecific uptake in the white matter, and thus the clinician should focus on the poor distinction of the cortical–subcortical junction as pathology enters the cortex. (B) Tau PET using AV1451 tracer. This image is provided by courtesy of Dr. Gil Rabinovici and Viktoriya Bourakova.
Fig. 3
Fig. 3. Neuroimaging in vascular dementia
(A) Subcortical and periventricular white matter hyperintensities (WMH) in sporadic small vessel disease (SVD) on T2/FLAIR (fluid-attenuated inversion recovery). (B) Enlarged Virchow–Robin spaces (eVRS) on T2 sequence. (C) Cortical microinfarct shown as a hypointense T1 lesion. (D) Cortical microbleeds on T2* SWI sequence. (E) Superficial siderosis on T2* susceptibility-weighted imaging (SWI). (F) Anterior temporal lobe WMH in CADASIL on T2/FLAIR. (G,H) Axial MRI in a 46-year-old woman with COL4A1 mutation and medically refractory seizures, long-standing cognitive decline and right hemiparesis since early childhood. Axial T2 FLAIR (G) image shows extensive white matter signal abnormality (dotted arrow), with white matter cysts (arrow), and porencephaly (arrowheads). Axial susceptibility-sensitive image at the same level (H) reveals multiple remote hemorrhages of varying size throughout the brain (arrows as examples). Part (c) used with permission from Hilal S, Sikking E, Shaik MA, et al. Cortical cerebral microinfarcts on 3T MRI: a novel marker of cerebrovascular disease. Neurology 2016;87(15):1583–1590. https://doi.org/10.1212/WNL.0000000000003110.
Fig. 4
Fig. 4. Neuroimaging in pathologically confirmed frontotemporal dementia (FTD) patients
T1 MRI images in genetic and pathological forms of FTD, highlighting pathological propensities toward symmetry and regional predilections. Figure used with permission from: Gordon E, Rohrer JD, Fox NC. Advances in neuroimaging in frontotemporal dementia. J Neurochem 2016;138:193–210. https://doi.org/10.1111/jnc.13656.
Fig. 5
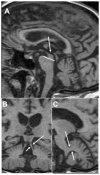
Fig. 5. Neuroimaging in progressive supranuclear palsy syndrome (PSPS)
(A,B) Sagittal and (C) coronal T1-weighted images from a 61-year-old man with PSPS (MMSE 27) and autopsy-proven FTLD-PSP pathology. (A) Reduced midbrain area (arrow) compared with the pons. Thinned superior cerebellar peduncles on coronal section (B; arrows) are observed compared with the middle cerebral peduncles (C; arrows). Adapted with permission from Vitali P, Migliaccio R, Agosta F, Rosen H, Geschwind M. Neuroimaging in dementia. Semin Neurol 2008;28(4):467–483.
Fig. 6
Fig. 6. Coronal T1-weighted MRI in patients with primary progressive aphasias (PPA)
(A) nfvPPA in a 66-year-old woman, MMSE: 28. Left predominant atrophy of the operculum is evident (arrow). (B) svPPA in a 66-year-old man with MMSE: 26. Atrophy is most prominent in the left perisylvian region, including the medial temporal lobes (arrow). Adapted with permission from Vitali P, Migliaccio R, Agosta F, Rosen H, Geschwind M. Neuroimaging in dementia. Semin Neurol 2008;28(4):467–483.
Fig. 7
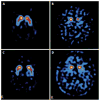
Fig. 7
DaTSCAN (FP-CIT) in a healthy control (A) and patients with Parkinson’s disease (B), Alzheimer’s disease (C), and dementia with Lewy bodies (D). Used with permission from Walker Z, Costa DC, Walker RW H, et al. Differentiation of dementia with Lewy bodies from Alzheimer’s disease using a dopaminergic presynaptic ligand. J Neurol Neurosurg Psychiatry 2002;73(2):134–140.
Fig. 8
Fig. 8. Magnetic resonance imaging(MRI) findings in pathologically proven Jakob–Creutzfeldt disease (JCD)
Note that in sporadic JCD the abnormalities are usually more evident on diffusion-weighted imaging (DWI) (C,E,G) than on fluid-attenuated inversion recovery (FLAIR) images (D,F,H). Orientation is radiologic, with right side of image being left side of the brain. (A,B) A 21-year-old woman with probable variant JCD. MRI shows the “double hockey stick sign”: bilateral thalamic hyperintensity in the mesial pars (mainly dorsomedian nucleus) and posterior pars (pulvinar) of the thalamus. Also note the “pulvinar sign,” with the right posterior thalamus (pulvinar) being more hyperintense than the anterior putamen on the FLAIR image (B). (C,D) A 52-year-old woman with MRI showing strong hyperintensity in bilateral striatum (solid arrows, both caudate and putamen) and slight hyperintensity in mesial and posterior thalamus (dotted arrow). (E,F) A 68-year-old man with MRI showing hyperintensity in bilateral striatum (note anteroposterior gradient in the putamen, which is commonly seen in JCD), thalamus, right insula (dotted arrow), anterior and posterior cingulate gyrus (arrow, L > R), and left temporal-parietal-occipital junction (arrow). (G,H) A 76-year-old woman with MRI showing diffuse hyperintense signal mainly in bilateral parietal and occipital cortex, right posterior insula (dashed arrow), and left inferior frontal cortex (arrow), but no significant subcortical abnormalities. Reprinted with permission from Vitali P, Migliaccio R, Agosta F, Rosen H, Geschwind M. Neuroimaging in dementia. Semin Neurol 2008;28(4):467–483.
Fig. 9
Fig. 9. Nonprion rapidly progressive dementia and ataxia syndromes
Note that in these cases, the abnormalities are seen better on the FLAIR (A,C,E) that the DWI (B,C,F) images. Orientation is radiologic, with right side of image being the left side of the brain. (A,B) A 66-year-old man with intravascular lymphoma. (A) FLAIR multifocal abnormalities involving cerebral and cerebellar gray and white matter in a vascular distribution. These lesions, also involving the right hippocampus, showed patchy enhancement after contrast administration (not shown). (B) DWI shows a right periventricular focal region with diffusion restriction; DWI hyperintensity is common in lymphomas. (C,D) A 65-year-old woman with anti-Yo paraneoplastic cerebellitis. Magnetic resonance imaging (MRI) shows mild diffuse hyperintensity of the cerebellar, compared with the cerebral, cortex with slight atrophy of the lateral folia. Note (C) the strong hyperintense FLAIR signal in superior, medial cerebellum (arrows), and (D) no major hyperintensity in the axial DWI scan. (E,F) A 60-year-old woman with paraneoplastic limbic encephalitis and FLAIR MRI showing hyperintensity of bilateral insula, medial (arrows) and inferior temporal cortex, hippocampus, amygdala (E) on FLAIR and only subtle hyperintensity (F) on DWI. FLAIR, fluid-attenuated inversion recovery; DWI, diffusion-weighted imaging; MRI, magnetic resonance imaging. Reprinted with permission from Vitali P, Migliaccio R, Agosta F, Rosen H, Geschwind M. Neuroimaging in dementia. Semin Neurol 2008;28(4):467–483.
Fig. 10
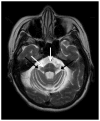
Fig. 10
T2-weighted axial MRI of the pontine-middle cerebellar peduncle (MCP) junction in a patient with MSA-C. Black arrows point to MCP hyperintensity. White arrows point to the hot cross bun sign in the pons. Bilateral cerebellar hemisphere atrophy is also present.

Similar articles

Cited by

References

    1. Crutch SJ, Schott JM, Rabinovici GD, et al. Alzheimer’s Association ISTAART Atypical Alzheimer’s Disease and Associated Syndromes Professional Interest Area. Consensus classification of posterior cortical atrophy. Alzheimers Dement. 2017;13(08):870–884. doi: 10.1016/j.jalz.2017.01.014. - DOI - PMC - PubMed
    1. McKhann GM, Knopman DS, Chertkow H, et al. The diagnosis of dementia due to Alzheimer’s disease: recommendations from the National Institute on Aging-Alzheimer’s Association workgroups on diagnostic guidelines for Alzheimer’s disease. Alzheimers Dement. 2011;7(03):263–269. doi: 10.1016/j.jalz.2011.03.005. - DOI - PMC - PubMed
    1. Sacks CA, Avorn J, Kesselheim AS. The Failure of Solanezumab -How the FDA Saved Taxpayers Billions. N Engl J Med. 2017;376(18):1706–1708. doi: 10.1056/NEJMp1701047. - DOI - PubMed
    1. Seeley WW, Crawford RK, Zhou J, Miller BL, Greicius MD. Neurodegenerative diseases target large-scale human brain networks. Neuron. 2009;62(01):42–52. - PMC - PubMed
    1. Ossenkoppele R, Cohn-Sheehy BI, La Joie R, et al. Atrophy patterns in early clinical stages across distinct phenotypes of Alzheimer’s disease. Hum Brain Mapp. 2015;36(11):4421–4437. doi: 10.1002/hbm.22927. - DOI - PMC - PubMed

MeSH terms