. 2017 Sep 5;8(53):91425-91444.
doi: 10.18632/oncotarget.20648. eCollection 2017 Oct 31.

Egr-1 regulates RTA transcription through a cooperative involvement of transcriptional regulators

Affiliations

Egr-1 regulates RTA transcription through a cooperative involvement of transcriptional regulators

Roni Sarkar et al. Oncotarget. .

Abstract

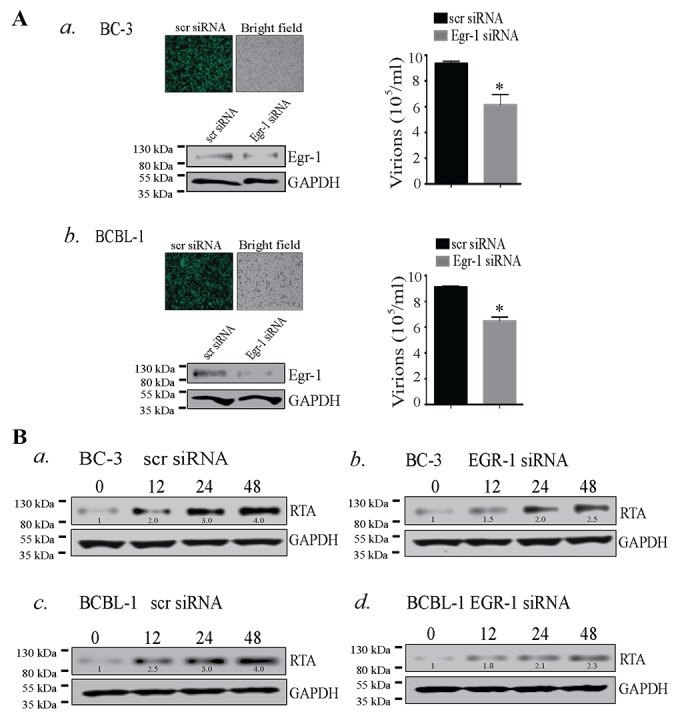
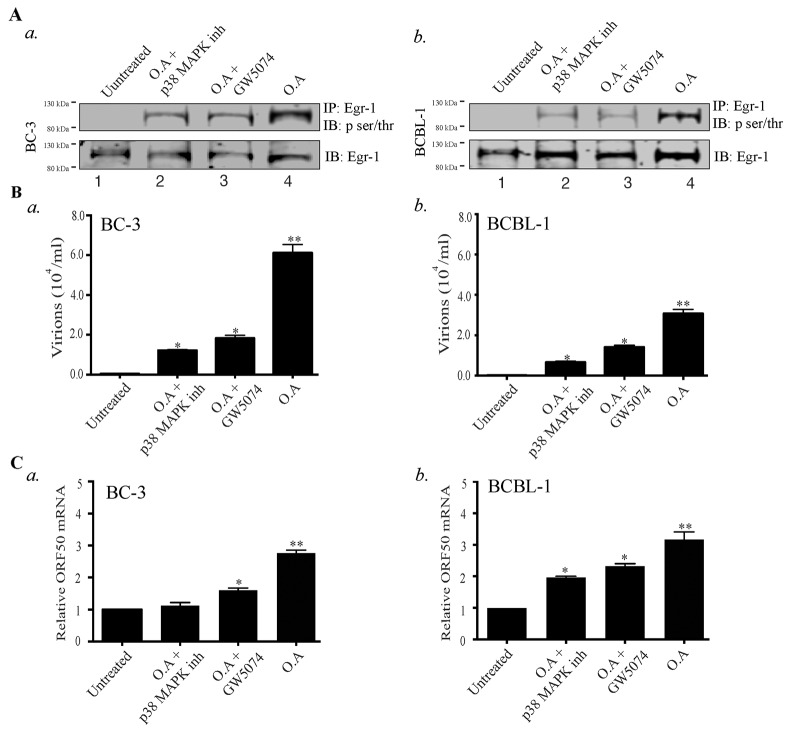
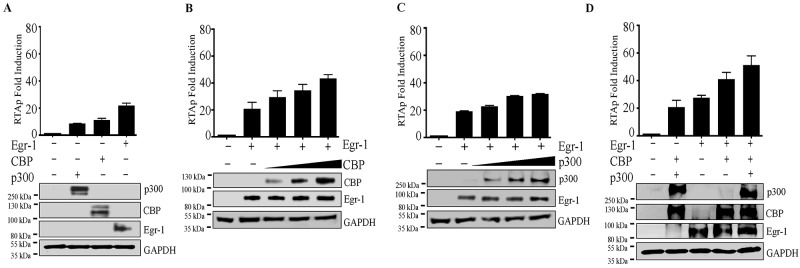
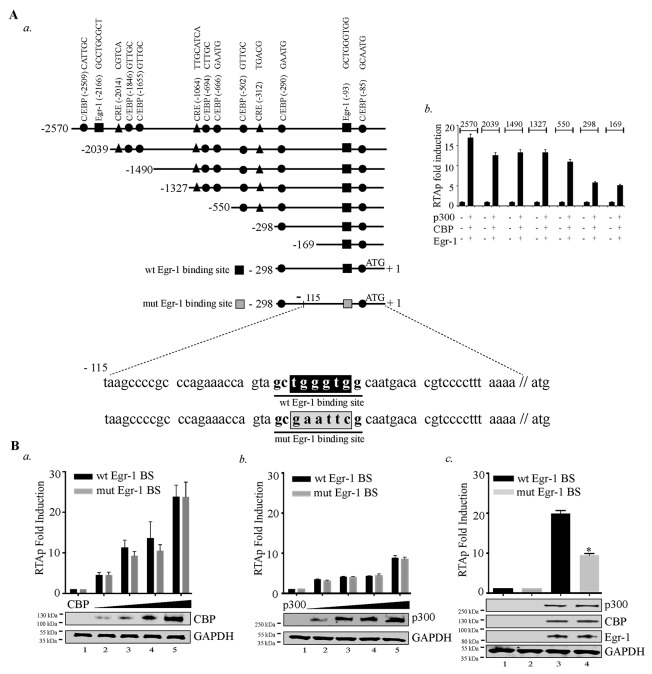
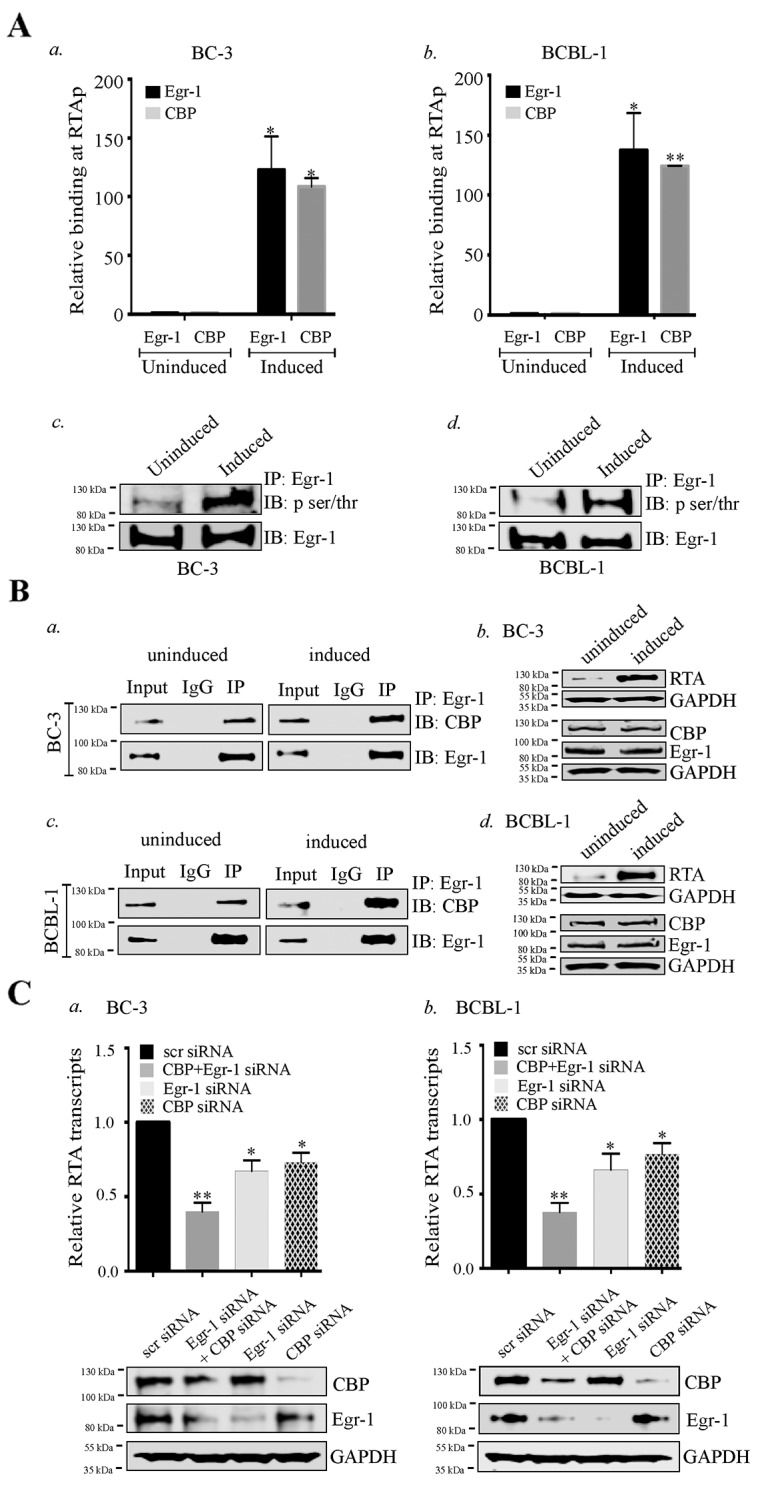
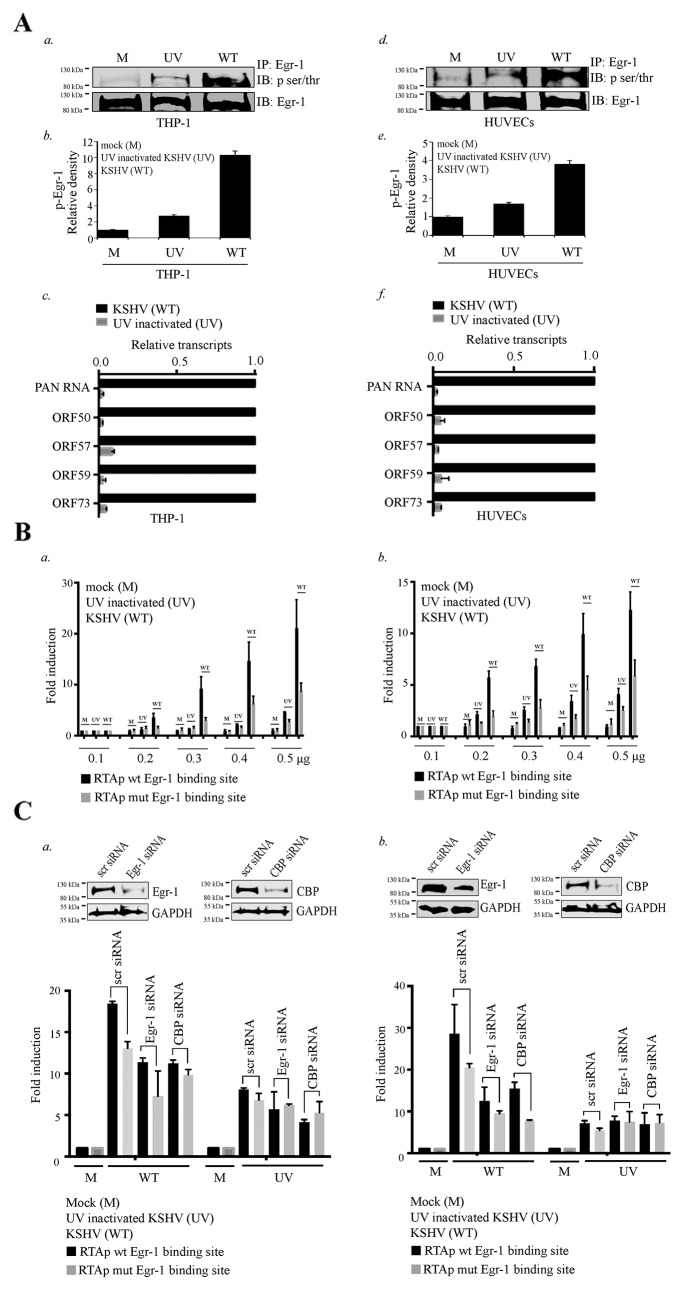
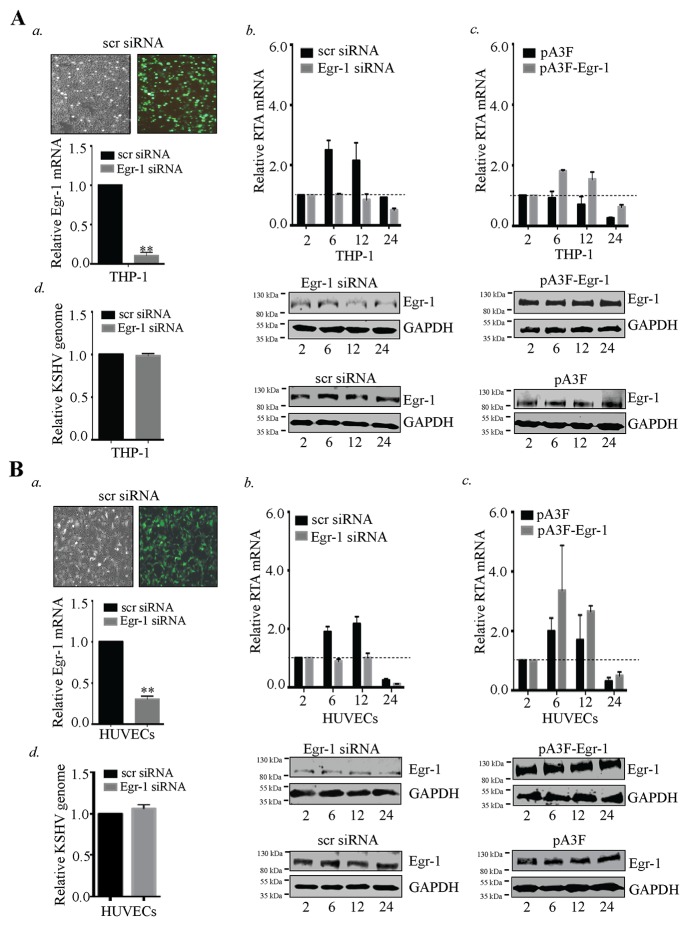
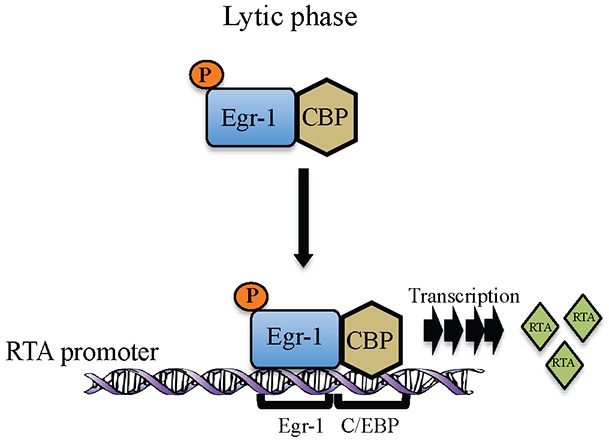
Kaposi's sarcoma associated herpesvirus (KSHV) regulates the host cellular environment to establish life-long persistent infection by manipulating cellular signaling pathways, with approximately 1- 5% of cells undergoing lytic reactivation during the course of infection. Egr-1 (Early Growth Response Factor-1) is one such cellular transcription factor, which gets phosphorylated during the lytic phase of viral life cycle to perpetrate its function. This study demonstrates the mechanism of how Egr-1 mediates transcription of the immediate early gene, RTA (Replication and transcription activator), which is the lytic switch gene of KSHV. Egr-1 depleted KSHV infected cells exhibited reduced expression of RTA. Also, an increase in Egr-1 phosphorylation led to a higher virion production, which was suppressed in the presence of p38 and Raf inhibitors. Reporter assays showed that coexpression of Egr-1 and CBP (CREB-binding protein) enhances RTA promoter activity as compared to the expression of either Egr-1 or CBP alone. Binding of Egr-1 and CBP at RTA promoter was analyzed by chromatin immunoprecipitation assay (ChIP), which showed an enhanced accumulation during viral reactivation. Mutation in Egr-1 binding site of the RTA promoter eliminated Egr-1 response on promoter activation. Furthermore, de novo infection of THP-1 (monocytic) and HUVECs (endothelial) cells showed an upregulation of Egr-1 phosphorylation, whereas depletion of Egr-1 reduced the mRNA levels of RTA during primary infection. Together, these results demonstrate a cooperative role of Egr-1 and CBP in mediating RTA transcription, which significantly improves our understanding of the involvement of cellular factors controlling RTA transcription in KSHV pathogenesis.

Keywords: CBP; Egr-1; KSHV; RTA; lytic reactivation.


Conflict of interest statement

CONFLICTS OF INTEREST The authors have declared that no competing interest exists.

Figures

Figure 1
Figure 1. (A) Egr-1 silencing reduced virion production in BC-3 and BCBL-1 cells
a. BC-3 and b. BCBL-1 cells were transfected with scrambled siRNA (scr siRNA)/Egr-1 siRNA and allowed to grow for 24h followed by induction with TPA for 72h. Culture supernatant containing virions was collected and concentrated through ultracentrifugation. The relative virion quantity was determined by qPCR of the DNA extracted from the virions. The expression of Egr-1 and the respective GAPDH are shown in BC-3 and BCBL-1 transfected with scr/ Egr-1 siRNA. Transfection efficiencies of scrambled siRNA (scr siRNA-FITC conjugated) (green cells) are shown in BC-3 and BCBL-1, respectively. *P < 0.05. (B) RTA expression gets reduced during viral reactivation in BC-3 and BCBL-1 cells depleted of Egr-1 expression. BC-3 cells transfected with (scr/Egr-1 siRNA) were analyzed for RTA expression after induction for respective time points, 0, 12, 24 and 48h. RTA expression levels were compared between BC-3 transfected with a. scrambled siRNA (scr siRNA) and b. Egr-1 siRNA. BCBL-1 cells were analyzed for RTA expression after induction for respective time points, 0, 12, 24 and 48h. The RTA expression levels were compared between BCBL-1 transfected with c. scrambled siRNA (scr siRNA) and d. Egr-1 siRNA. The densitometric analyses of RTA expression at respective time points, 0, 12, 24 and 48h are shown in BC-3 and BCBL-1 cells transfected with scr/Egr-1 siRNA.
Figure 2
Figure 2. Okadaic acid (O.A) upregulates Egr-1 phosphorylation and virion production, which get suppressed by p38 MAP kinase (p38 MAPK) and Raf kinase inhibitors
(A) a. BC-3 and b. BCBL-1 cells were treated with the combination of Okadaic acid (30 ng/ml); Okadaic acid (30 ng/ml) and p38 MAP kinase inhibitor (30 ng/ml); Okadaic acid (30 ng/ml) and GW5074 (50 µM) respectively for 24h. The cells were collected, lysed and processed for the detection of Egr-1 phosphorylation (IB: p-ser/thr) through immunoprecipitation of total Egr-1 and immunoblotting. Lane 1- Untreated, Lane 2- Okadaic acid + p38 MAP kinase inhibitor, Lane 3- Okadaic acid + GW5074, Lane 4- Okadaic acid. (B) Culture supernatant (containing virions) from a. BC-3 and b. BCBL-1 cells, treated with the combination of Okadaic acid (30 ng/ml); Okadaic acid (30 ng/ml) and p38 MAP kinase inhibitor (30 ng/ml); Okadaic acid (30 ng/ml) and GW5074 (50 µM) were collected after 72h and concentrated through ultracentrifugation. The concentrated virions were processed for viral genome extraction and quantification through qPCR. *P < 0.05, ** P < 0.01. (C) a. BC-3 and b. and BCBL-1 cells were treated with the combination of Okadaic acid (30 ng/ml); Okadaic acid (30 ng/ml) and p38 MAP kinase inhibitor (30 ng/ml); Okadaic acid (30 ng/ml) and GW5074 (50 µM) for 24h. The cells were harvested for the analysis of ORF50 transcripts through qPCR. *P < 0.05, ** P < 0.01.
Figure 3
Figure 3
(A) Egr-1/CBP/p300 upregulates RTA promoter activity. A total of 2 × 10⁶ 293T cells were transfected with either RTAp (0.1µg); RTAp (0.1µg), p300 (0.5µg); RTAp (0.1µg), CBP (0.5µg); RTAp (0.1µg), Egr-1 (0.5µg). The cells were harvested after 48h post-transfection for the luciferase assay. (B) CBP upregulates RTA promoter (RTAp) activity in the presence of Egr-1. A total of 2 × 10⁶ 293T cells were co-transfected with the combination of either RTAp (0.1µg); RTAp (0.1µg), Egr-1 (0.5µg); RTAp (0.1µg), Egr-1 (0.5µg), CBP (0.5µg); RTAp (0.1µg), Egr-1 (0.5µg), CBP (1.0µg); RTAp (0.1µg), Egr-1 (0.5µg), CBP (1.5µg). The cells were harvested after 48h post-transfection for luciferase assay. (C) p300 upregulates RTA promoter activity in the presence of Egr-1. A total of 2 × 10⁶ 293T cells were co-transfected with either RTAp (0.1µg); RTAp (0.1µg), Egr-1 (0.5µg); RTAp (0.1µg), Egr-1 (0.5µg), p300 (0.5µg); RTAp (0.1µg), Egr-1 (0.5µg), p300 (1.0µg); RTAp (0.1µg), Egr-1 (0.5µg), p300 (1.5µg). The cells were harvested after 48h post-transfection for luciferase assay. (D) Egr-1 along with CBP and p300 upregulates RTA promoter activity. A total of 2 × 10⁶ 293T cells were transfected with either RTAp (0.1µg); RTAp (0.1µg), CBP (0.5µg), p300 (0.5µg); RTAp (0.1µg), Egr-1 (0.5µg); RTAp (0.1µg), Egr-1 (0.5µg), CBP (0.5µg); RTAp (0.1µg), Egr-1 (0.5µg), CBP (0.5µg), p300 (0.5µg). The cells were harvested after 48h post-transfection for luciferase assay.
Figure 4
Figure 4. Disruption of Egr-1 binding site at RTA promoter reduces CBP/p300 mediated transcriptional activity
(A) a. Schematic shows the deletion mutants of RTA promoter and the location of Egr-1 and CBP (CREB-binding protein) binding sites such as: C/EBPs - CCAAT-enhancer-binding proteins; CRE - cAMP response elements. b. A total of 2 × 10⁶ 293T cells were cotransfected with the combination of Egr-1 (0.5µg), CBP (0.5µg), p300 (0.5µg) and RTAp-2570 (0.1µg)/RTAp-2039 (0.1µg)/RTAp-1490 (0.1µg)/RTAp-1327 (0.1µg)/RTAp-500 (0.1µg)/RTAp-298 (0.1µg)/RTAp-169 (0.1µg). Lucifearse assay was performed 48h post-transfection and the relative luciferase units are presented as RTAp fold induction. (B) Luciferase reporter assay was performed to compare the RTA promoter (RTAp) activity with either wild type Egr-1 binding site (wt Egr-1 BS) or mutated Egr-1 binding site (mut Egr-1 BS). a. RTA promoter (wt Egr-1 BS/mut Egr-1 BS) activity was compared in the presence of increasing concentration of CBP (0.0, 0.2, 0.4, 0.6, 0.8 μg): Lanes 1-5, b. RTA promoter (wt Egr-1 BS / mut Egr-1 BS) activity was compared in the presence of increasing concentration of p300 (0.0, 0.2, 0.4, 0.6, 0.8 μg): Lanes 1-5, c. RTA promoter (with Egr-1/ Egr-1 mutated site) activity was determined in the presence of CBP, p300 and Egr-1. 293T cells were transfected with: lane 1- RTA promoter (with Egr-1 binding site) 0.1μg; lane 2- RTA promoter (mutated Egr-1 binding site) 0.1μg; lane 3- RTA promoter (with Egr-1 binding site) 0.1μg, CBP (0.5μg), p300 (0.5μg) and Egr-1 (0.5μg); lane 4- RTA promoter (mutated Egr-1 binding site) 0.1μg, CBP (0.5μg), p300 (0.5μg) and Egr-1 (0.5μg). Luciferase assay was performed 48h post-transfection and the relative luciferase units are presented as RTAp fold induction.
Figure 5
Figure 5. Egr-1 and CBP binds at RTA promoter (RTAp) and regulates its transcription during viral reactivation
(A) 10 ×106 BC-3 and 10 ×106 BCBL-1 cells were cultured and induced with TPA for 24h. The cells were harvested and processed for Chromatin Immunoprecipitation assay. a. The relative binding of Egr-1 and CBP at RTA promoter was compared between uninduced and induced BC-3 cells. b. The relative binding of Egr-1 and CBP at RTA promoter was compared between uninduced and induced BCBL-1 cells. *P < 0.05, **P < 0.01. c. 10 ×106 BC-3 cells were induced with TPA for 24h. The cells were harvested and processed for the detection of Egr-1 phosphorylation through immunoprecipitation and immunoblotting. d. 10 ×106 BCBL-1 cells were induced with TPA for 24h. The cells were harvested and processed for the detection of Egr-1 phosphorylation through immunoprecipitation and immunoblotting. (B) The interaction of Egr-1 and CBP was compared between uninduced and induced (BC-3 and BCBL-1) cells. The cells were induced for 24h, harvested and processed for Egr-1 immunoprecipitation. Egr-1 and CBP were immunoprecipitated through Egr-1 antibody, as detected through immunoblotting. a. uninduced and induced BC-3. b. The respective RTA, Egr-1 and CBP expression levels are shown in uninduced and induced BC-3.Egr-1 and CBP were immunoprecipitated through Egr-1 antibody, as detected through immunoblotting, as detected through immunoblotting in c. uninduced and induced BCBL-1. d. The respective RTA, Egr-1 and CBP expression levels are shown in uninduced and induced BCBL-1. (C) a. BC-3, b. BCBL-1 cells were transfected with either scr/Egr-1/CBP/Egr-1 and CBP for 36h and induced with TPA for 24h. The cells were harvested and processed for the analysis of RTA transcripts levels through qPCR. The respective Egr-1, CBP and GAPDH expression are shown in each of the experimental sets. *P < 0.05, ** P < 0.01.
Figure 6
Figure 6
Egr-1 gets phosphorylated during primary infection. (A) 2×10⁶ THP-1 cells were infected with either live or UV inactivated KSHV at 10 m.o.i for 12h. a. The Egr-1 phosphorylation levels were compared between the target cells infected with either UV inactivated (UV) or live KSHV (WT). b. Relative density of p-Egr-1 levels from the THP-1 infected with (UV inactivated/live virus). c. Relative KSHV transcripts PAN RNA, ORF50, ORF57, ORF59 and ORF73 were compared after 12h of infection in THP-1. 2×10⁶ HUVECs were infected with either live or UV inactivated KSHV at 10 m.o.i for 12h. d. The Egr-1 phosphorylation levels were compared between the target cells infected with either UV inactivated or live KSHV. e. Relative density of p-Egr-1 levels from the HUVECs infected with (UV inactivated/ live virus). f. Relative KSHV transcripts PAN RNA, ORF50, ORF57, ORF59 and ORF73 were compared after 12h of infection in HUVECs. (B) a. 2×10⁶ THP-1 cells were transfected with the combination of either RTA promoter (with Egr-1 binding site) or RTA promoter (mutated Egr-1 binding site). The concentration of plasmids transfected were 0.1μg, 0.2μg, 0.3μg, 0.4μg and 0.5μg respectively. After transfection of RTA promoter plasmids, the target cells were infected with KSHV/UV treated KSHV at 10 m.o.i for 6h. The target cells were harvested and processed for luciferase assay. b. 2×10⁶ HUVECs were transfected with the combination of either RTA promoter (with Egr-1 binding site) or RTA promoter (mutated Egr-1 binding site). The concentration of plasmids transfected were 0.1μg, 0.2μg, 0.3μg, 0.4μg and 0.5μg respectively. After transfection of RTA promoter plasmids, the target cells were infected with KSHV/UV treated KSHV at 10 m.o.i for 6h. The target cells were harvested and processed for luciferase assay. (C) a. 2×10⁶ THP-1 cells were co-transfected with the combination of either scr/Egr-1/CBP siRNA (100 pM) and RTA promoter (0.1μg) (with Egr-1 binding site)/RTA promoter (mutated Egr-1 binding site). The expression levels of Egr-1/CBP with their respective GAPDH levels are shown in scr/Egr-1/CBP siRNA transfected THP-1. The target cells were infected with KSHV/UV treated KSHV at 10 m.o.i for 6h prior to harvesting. The cells were processed for luciferase assay. b. 2×10⁶ HUVECs were co-transfected with the combination of either scr/Egr-1/CBP siRNA (100 pM) and RTA promoter (0.1μg) (with Egr-1 binding site)/RTA promoter (mutated Egr-1 binding site). The expression levels of Egr-1/CBP with their respective GAPDH levels are shown in scr/Egr-1/CBP siRNA transfected HUVECs. The target cells were infected with KSHV/UV treated KSHV at 10 m.o.i for 6h prior to harvesting and processed for luciferase assay.
Figure 7
Figure 7
Egr-1 controls RTA transcription during primary infection. (A) 2×10⁶ THP-1 cells transfected with Egr-1 siRNA (100 pM). The target cells were infected with KSHV at 10 m.o.i for 2, 6, 12 and 24h. The cells were harvested at indicated time points and processed for the detection of RTA transcripts. a. Transfection efficiency of siRNA and the reduction of Egr-1 levels (due to Egr-1 siRNA transfection) are shown for THP-1. ** P < 0.01. b. RTA transcripts levels were reduced in Egr-1 depleted THP-1 detected at 2, 6, 12 and 24h post-infection. c. 2×10⁶ THP-1 were transfected either with pA3F-Egr-1 (5µg) or control vector, pA3F (5µg) for 48h. The target cells were infected with KSHV at 10 m.o.i. Cells were harvested at indicated time points and processed for RTA transcripts analysis. Egr-1 expression level was compared between pA3F-Egr-1 transfected cells and control vector transfected cells. d. Silencing of Egr-1 does not alter KSHV entry in THP-1. KSHVDNA was extracted 2h post-infection from the THP-1 (scr siRNA and Egr-1 siRNA transfected cells). The extracted DNA was analyzed for the target gene (ORF58) amplification through qPCR. The relative KSHV genome copies were calculated and compared between KSHV infected cells (transfected with scr/Egr-1 siRNA). (B) 2×10⁶ HUVECs transfected with Egr-1 siRNA (100 pM). The target cells were infected with KSHV at 10 m.o.i for 2, 6, 12 and 24h. The cells were harvested at indicated time points and processed for the detection of RTA transcripts. a. Transfection efficiency of siRNA and the reduction of Egr-1 levels (due to Egr-1 siRNA transfection) are shown for HUVECs. **P < 0.01. b. RTA transcript levels were reduced in Egr-1 depleted HUVECs detected at 2, 6, 12 and 24h post-infection. The expression level of Egr-1 was reduced in Egr-1 siRNA (Egr-1 siRNA) transfected cells as compared to control (scr siRNA) cells. c. 2×10⁶ HUVECs were transfected either with pA3F-Egr-1 (5µg) or control vector, pA3F (5µg) for 48h. The target cells were infected with KSHV at 10 m.o.i. Cells were harvested at indicated time points and processed for RTA transcripts analysis. Egr-1 expression level was compared between pA3F-Egr-1 transfected cells and control vector transfected cells. d. Silencing of Egr-1 does not alter KSHV entry in HUVECs. KSHVDNA was extracted 2h post-infection from the infected HUVECs (scr siRNA and Egr-1 siRNA transfected cells). The extracted DNA was analyzed for the target gene (ORF58) amplification through qPCR. The relative KSHV genome copies were calculated and compared between KSHV infected cells transfected with scr/Egr-1 siRNA.
Figure 8
Figure 8. Schematic showing Egr-1 phosphorylation and formation of Egr-1 and CBP complex at RTA promoter during lytic reactivation for the transcription of RTA

Similar articles

Cited by

References

    1. Soulier J, Grollet L, Oksenhendler E, Cacoub P, Cazals-Hatem D, Babinet P, d’Agay MF, Clauvel JP, Raphael M, Degos L. Kaposi’s sarcoma-associated herpesvirus-like DNA sequences in multicentric Castleman’s disease. Blood. 1995;86:1276–80. - PubMed
    1. Cesarman E. Gammaherpesviruses and lymphoproliferative disorders. Annu Rev Pathol. 2014;9:349–72. https://doi.org/10.1146/annurev-pathol-012513-104656. - DOI - PubMed
    1. Cai Q, Verma SC, Lu J, Robertson ES. Molecular biology of Kaposi’s sarcoma-associated herpesvirus and related oncogenesis. Adv Virus Res. 2010;78:87–142. https://doi.org/10.1016/B978-0-12-385032-4.00003-3. - DOI - PMC - PubMed
    1. Chang Y, Cesarman E, Pessin MS, Lee F, Culpepper J, Knowles DM, Moore PS. Identification of herpesvirus-like DNA sequences in AIDS-associated Kaposi’s sarcoma. Science. 1994;266:1865–9. - PubMed
    1. Wang HW, Trotter MW, Lagos D, Bourboulia D, Henderson S, Makinen T, Elliman S, Flanagan AM, Alitalo K, Boshoff C. Kaposi sarcoma herpesvirus-induced cellular reprogramming contributes to the lymphatic endothelial gene expression in Kaposi sarcoma. Nat Genet. 2004;36:687–93. https://doi.org/10.1038/ng1384. - DOI - PubMed