

On the statistical analysis of single cell lineage trees
- PMID: 29208470
- PMCID: PMC5764708
- DOI: 10.1016/j.jtbi.2017.11.023
On the statistical analysis of single cell lineage trees
Erratum in
-
Erratum to "On the statistical analysis of single cell lineage trees" [J. Theor. Biol. 439 (2018) 160-165].J Theor Biol. 2020 Dec 7;506:110424. doi: 10.1016/j.jtbi.2020.110424. Epub 2020 Jul 30. J Theor Biol. 2020. PMID: 32741579 Free PMC article. No abstract available.
Abstract
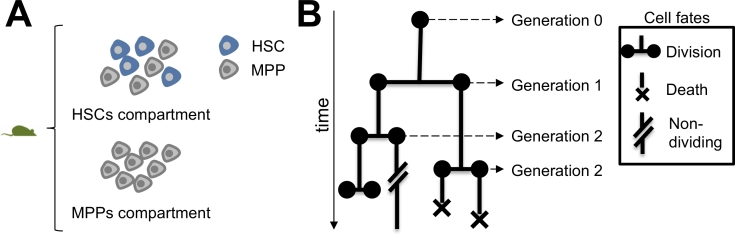
Stem cells play a central role in the regeneration and repair of multicellular organisms. However, it remains far from trivial to reliably identify them. Despite decades of work, current techniques to isolate hematopoietic stem cells (HSCs) based on cell-surface markers only result in 50% purity, i.e. half of the sorted cells are not stem cells when functionally tested. Modern microscopy techniques allow us to follow single cells and their progeny for up to weeks in vitro, while recording the cell fates and lifetime of each individual cell. This cell tracking generates so-called lineage trees. Here, we propose statistical techniques to determine if the initial cell in a lineage tree was a HSC. We apply these techniques to murine hematopoietic lineage trees, revealing that 18% of the trees in our HSC dataset display a unique signature, and this signature is compatible with these trees having started from a true stem cell. Assuming 50% purity of HSC empirical datasets, this corresponds to a 0.35 power of the test, and the type-1-error is estimated to be 0.047. In summary, this study shows that statistical analysis of lineage trees could improve the classification of cells, which is currently done based on bio-markers only. Our statistical techniques are not limited to mammalian stem cell biology. Any type of single cell lineage trees, be it from bacteria, single cell eukaryotes, or single cells in a multicellular organism can be investigated. We expect this to contribute to a better understanding of the molecules influencing cellular dynamics at the single cell level.
Keywords: Bootstrap; Likelihood; Single cell analysis; Stem cells; Time lapse bioimaging.
Copyright © 2017 The Authors. Published by Elsevier Ltd.. All rights reserved.
Figures

References
-
- Coutu D.L., Schroeder T. Probing cellular processes by long-term live imaging–historic problems and current solutions. J. Cell Sci. 2013;126(17):3805–3815. - PubMed
-
- Efron B. Bootstrap methods:{A}nother look at the jackknife. Ann. Stat. 1979;7:1–26.
-
- Hilsenbeck O., Schwarzfischer M., Skylaki S., Schauberger B., Hoppe P.S., Loeffler D., Kokkaliaris K.D., Hastreiter S., Skylaki E., Filipczyk A. Software tools for single-cell tracking and quantification of cellular and molecular properties. Nat. Biotechnol. 2016;34(7):703–706. - PubMed
-
- Hoppe P.S., Schwarzfischer M., Loeffler D., Kokkaliaris K.D., Hilsenbeck O., Moritz N., Endele M., Filipczyk A., Gambardella A., Ahmed N. Early myeloid lineage choice is not initiated by random pu. 1 to gata1 protein ratios. Nature. 2016;535(7611):299–302. - PubMed
-
- Kiel M.J., Yilmaz Ö.H., Iwashita T., Yilmaz O.H., Terhorst C., Morrison S.J. Slam family receptors distinguish hematopoietic stem and progenitor cells and reveal endothelial niches for stem cells. Cell. 2005;121(7):1109–1121. - PubMed
Publication types
MeSH terms
LinkOut - more resources
Full Text Sources
Other Literature Sources
Medical
