. 2017 Dec 12;114(50):E10622-E10631.
doi: 10.1073/pnas.1707743114. Epub 2017 Dec 5.

Direct measurements of meltwater runoff on the Greenland ice sheet surface

Affiliations

Direct measurements of meltwater runoff on the Greenland ice sheet surface

Laurence C Smith et al. Proc Natl Acad Sci U S A. .

Erratum in

Abstract

Meltwater runoff from the Greenland ice sheet surface influences surface mass balance (SMB), ice dynamics, and global sea level rise, but is estimated with climate models and thus difficult to validate. We present a way to measure ice surface runoff directly, from hourly in situ supraglacial river discharge measurements and simultaneous high-resolution satellite/drone remote sensing of upstream fluvial catchment area. A first 72-h trial for a 63.1-km2 moulin-terminating internally drained catchment (IDC) on Greenland's midelevation (1,207-1,381 m above sea level) ablation zone is compared with melt and runoff simulations from HIRHAM5, MAR3.6, RACMO2.3, MERRA-2, and SEB climate/SMB models. Current models cannot reproduce peak discharges or timing of runoff entering moulins but are improved using synthetic unit hydrograph (SUH) theory. Retroactive SUH applications to two older field studies reproduce their findings, signifying that remotely sensed IDC area, shape, and supraglacial river length are useful for predicting delays in peak runoff delivery to moulins. Applying SUH to HIRHAM5, MAR3.6, and RACMO2.3 gridded melt products for 799 surrounding IDCs suggests their terminal moulins receive lower peak discharges, less diurnal variability, and asynchronous runoff timing relative to climate/SMB model output alone. Conversely, large IDCs produce high moulin discharges, even at high elevations where melt rates are low. During this particular field experiment, models overestimated runoff by +21 to +58%, linked to overestimated surface ablation and possible meltwater retention in bare, porous, low-density ice. Direct measurements of ice surface runoff will improve climate/SMB models, and incorporating remotely sensed IDCs will aid coupling of SMB with ice dynamics and subglacial systems.

Keywords: climate models; fluvial catchment; ice sheet meltwater runoff; surface mass balance; surface water hydrology.


Conflict of interest statement

The authors declare no conflict of interest.

Figures

Fig. 1.
Fig. 1.
WorldView-1/2 satellite-derived map of Rio Behar catchment, a moderately sized (63.1 km2) internally drained catchment (IDC) centrally located in a melt-intensive area of the GrIS (Inset). From 20 to 23 July 2015, we collected 72 h of continuous in situ ADCP discharge measurements in the main-stem supraglacial river (Rio Behar) at our base camp (black star; 67.049346N, 49.025809W), ∼300 m upstream of the catchment’s terminal moulin. Measurements of ice surface ablation were collected at base camp and by the PROMICE KAN_M automated weather station. Four GPS-surveyed red tarpaulins visible in satellite and drone imagery were used as ground control points (GCP) to aid image geolocation and georectification. Eight years of topographic Rio Behar catchment boundaries, delineated from WorldView satellite stereo-photogrammetric DEMs (multishaded gray lines), establish overall catchment stability from 2008 to 2015. The 18 July 2015 DEM boundary, adjusted for small areas of stream piracy, was used for calculations presented in this study (thick black line; 63.1 km2). Manually identified stream channel heads (headwater channel incision points) mapped in the 18 July 2015 satellite image constrain minimum (green circles, inner) and maximum (red circles, outer) plausible catchment boundaries, respectively. The minimum boundary eliminates crevasse fields in the southeast catchment headwater area. Polygons bound small confirmed (red polygons) and potential (purple polygons) internally drained subareas (i.e., internal moulins) not draining to the large terminal moulin. Four small, nondraining supraglacial lakes were fully integrated into the stream/river network with no impoundment of flow. This map was created in part using DigitalGlobe, Inc., satellite imagery.
Fig. 2.
Fig. 2.
The 20–23 July 2015 field experiment (dashed lines) was timed for late July near the end of the peak runoff season, when Rio Behar catchment was bare ice, its seasonal surface drainage pattern was fully developed, and before the onset of cooler temperatures and reduced melting in August. Colored lines show daily melt rates (M) from the HIRHAM5, RACMO2.3, MAR3.6, and Point SEB climate/SMB models; melt rate is not supplied by MERRA-2.
Fig. 3.
Fig. 3.
Hourly supraglacial runoff R from the Rio Behar catchment obtained from in situ ADCP discharge measurements (red) and as estimated by five climate/SMB models (color-shaded envelopes) during the 20–23 July 2015 field experiment. Observed runoff is attenuated and delayed relative to modeled runoff due to nonrepresentation of fluvial transport (routing) in current models. An exception is MAR3.6 (green), which uses a simple delay-to-ice-edge assumption, thus greatly smoothing the diurnal runoff signal. Units of R in climate/SMB models (mm ⋅ h−1) are converted to discharge (m3 ⋅ s−1) by multiplication with remotely sensed catchment area (Fig. 1), enabling direct comparison with ADCP measurements. The uncertainty bounds shown for modeled R thus reflect Rio Behar catchment area uncertainty, with centerlines denoting the optimal catchment area estimate of 63.1 km2 and upper and lower uncertainty reflecting the maximum and minimum plausible catchment area estimates of 69.1 and 51.4 km2, respectively. Error bars for in situ data are SDs calculated from multiple ADCP profiles collected within each measurement hour. Local time for Rio Behar catchment is Coordinated Universal Time (UTC) minus 2 h.
Fig. 4.
Fig. 4.
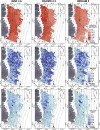
Application of our field-calibrated Synthetic Unit Hydrograph (SUH) routing model to 799 remotely sensed IDCs on the southwest GrIS [gray borders; mapped previously from a 19 August 2013 panchromatic Landsat-8 image (43)] illustrate how fluvial, supraglacial IDCs impart spatially heterogeneous modifications to meltwater runoff delivered to terminal moulins and hence the bed. Each IDC contains a remotely sensed supraglacial river (not shown for visual clarity) terminating in a major, catchment-terminating moulin. These theoretical SUH maps assume a spatially uniform, 1-cm-deep layer of meltwater released over a duration of 1 h and isolate the influence of remotely sensed IDC area, shape, and river length on (A) time-to-peak delays of peak runoff arrival at each catchment’s terminal moulin (tp, in hours) and (B) magnitude of peak discharge received at each catchment’s terminal moulin (Qpk, m3 ⋅ s−1). More realistic maps, forced by climate/SMB models, are shown in Fig. 5 and SI Appendix, Fig. 11.
Fig. 5.
Fig. 5.
Supraglacial IDCs modify the timing and magnitude of runoff delivered to terminal moulins, as demonstrated here at 1400 local western Greenland time on 21 July 2015 using (A) MAR3.6, RACMO2.3, and HIRHAM5 climate/SMB model outputs of corrected meltwater production (M′; see SI Appendix, section 4.3) to estimate (B) instantaneous area-integrated runoff and (C) more realistic, SUH-routed runoff. MERRA-2 is not shown because it does supply M. Point SEB is not shown because its output is not gridded. The boundaries of 799 IDCs (gray borders) were mapped previously from a 19 August 2013 panchromatic Landsat-8 image (43). Each IDC contains a remotely sensed, moulin-terminating supraglacial river (not shown for visual clarity). Climate/SMB model output M′ has units of water depth equivalent (mm ⋅ h−1), which converts to runoff in discharge units (m3 ⋅ s−1) following multiplication with intersected IDC catchment boundaries (B and C). The black star at ∼67N, 49W denotes the Rio Behar IDC. In both B and C large IDCs enable large moulin discharges above 1,500 m a.s.l. elevation, despite lower overall melt rates. SUH routing (C) yields lower peak moulin discharges at this time of day than instantaneous area-integrated runoff (B), because SUH requires more time for runoff to travel through fluvial supraglacial stream/river networks. A companion nighttime version of this figure 10 h later (00:00 on 22 July; see SI Appendix, Fig. 11) shows the opposite effect, with shutdowns in A and B but high moulin discharges in C.
Fig. 6.
Fig. 6.
Comparison of SUH-routed runoff (Fig. 5C) with instantaneous area-integrated runoff (Fig. 5B) for all 799 IDCs: (A) peak moulin discharge; (B) diurnal difference between maximum and minimum moulin discharge; and (C) time delay between peak melt production across the catchment and peak discharge received at the terminal moulin. Applying SUH routing to climate/SMB model output yields lower peak discharges, suppressed diurnal variability, and delayed, asynchronous timing of peak runoff delivered to catchment-terminating moulins.
Fig. 7.
Fig. 7.
Climate/SMB model simulations compared with field measurements of (A) runoff and (B) ice surface lowering (ablation) during the 20–23 July 2015 field experiment. (A) Cumulative hourly supraglacial runoff R from the Rio Behar catchment as measured from in situ ADCP measurements (in red) and as estimated by five climate/SMB models (color-shaded envelopes). Note that values of cumulative modeled R (m3) derive from summation of hourly discharges (m3 ⋅ s−1), which are obtained by multiplying climate/SMB model outputs with the remotely sensed catchment area(s) of Fig. 1. Upper and lower uncertainty bounds in modeled R thus reflect Rio Behar catchment area uncertainty, with centerlines denoting the optimal catchment area estimate of 63.1 km2 and upper and lower uncertainty bounds reflecting maximum and minimum plausible catchment area estimates of 69.1 and 51.4 km2, respectively. Error bars (red) for in situ measurements denote the following: (A) Cumulative SDs calculated from multiple ADCP supraglacial river discharge measurements collected within each measurement hour; and (B) cumulative ice surface–lowering measurements as measured manually at 15 ablation stakes in our Rio Behar base camp (mean values also shown) and by the KAN_M AWS. Upper and lower uncertainty bounds in modeled ice ablation reflect assumptions of either solid ice (0.918 g ⋅ cm−3) or lower observed (0.688 g ⋅ cm−3) (50) bare-ice density to convert model outputs of M from units of liquid water equivalent to solid ice equivalent. The vertical dashed line in B indicates time of cessation of our ADCP discharge experiment in A. MERRA-2 is not shown in B because M is not supplied by MERRA-2. Local time for Rio Behar catchment is Coordinated Universal Time (UTC) minus 2 h.

References

    1. van den Broeke M, et al. Partitioning recent Greenland mass loss. Science. 2009;326:984–986. - PubMed
    1. Shepherd A, et al. A reconciled estimate of ice-sheet mass balance. Science. 2012;338:1183–1189. - PubMed
    1. Andersen ML, et al. Basin-scale partitioning of Greenland ice sheet mass balance components (2007–2011) Earth Planet Sci Lett. 2015;409:89–95.
    1. Enderlin EM, et al. An improved mass budget for the Greenland ice sheet. Geophys Res Lett. 2014;41:866–872.
    1. Chu VW. Greenland ice sheet hydrology: A review. Prog Phys Geogr. 2014;38:19–54.

Publication types