. 2018 Feb;17(2):321-334.
doi: 10.1074/mcp.RA117.000315. Epub 2017 Dec 4.

Compartment-resolved Proteomic Analysis of Mouse Aorta during Atherosclerotic Plaque Formation Reveals Osteoclast-specific Protein Expression

Affiliations

Compartment-resolved Proteomic Analysis of Mouse Aorta during Atherosclerotic Plaque Formation Reveals Osteoclast-specific Protein Expression

Michael Wierer et al. Mol Cell Proteomics. 2018 Feb.

Abstract

Atherosclerosis leads to vascular lesions that involve major rearrangements of the vascular proteome, especially of the extracellular matrix (ECM). Using single aortas from ApoE knock out mice, we quantified formation of plaques by single-run, high-resolution mass spectrometry (MS)-based proteomics. To probe localization on a proteome-wide scale we employed quantitative detergent solubility profiling. This compartment- and time-resolved resource of atherogenesis comprised 5117 proteins, 182 of which changed their expression status in response to vessel maturation and atherosclerotic plaque development. In the insoluble ECM proteome, 65 proteins significantly changed, including relevant collagens, matrix metalloproteinases and macrophage derived proteins. Among novel factors in atherosclerosis, we identified matrilin-2, the collagen IV crosslinking enzyme peroxidasin as well as the poorly characterized MAM-domain containing 2 (Mamdc2) protein as being up-regulated in the ECM during atherogenesis. Intriguingly, three subunits of the osteoclast specific V-ATPase complex were strongly increased in mature plaques with an enrichment in macrophages thus implying an active de-mineralization function.


Figures

Fig. 1.
Fig. 1.
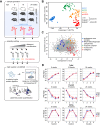
Quantitative detergent solubility profiling of mouse aorta. A, Outline of the experimental setup. Two independent ApoE−/− mouse cohorts and one paired wild-type mouse cohort were analyzed at the age of 8, 16 and 24 weeks (n = 3 - 5 mice per time point). Aortas were prepared and proteins sequentially extracted with buffers of increasing detergent strength. Proteins from the four different fractions were digested with trypsin and analyzed by high-resolution mass spectrometry in a label free shotgun approach. B, Principal component analysis(PCA) reveals a clear separation of the four fractions in the first two components. C, Protein loadings of the PCA shown in (B). D, QDSP profiles for selected proteins of cohort #1. Data points are filtered for the presence of at least two valid values and are averages. Error bars represent S.E.
Fig. 2.
Fig. 2.
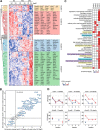
Total proteome changes during atherogenesis. A, Unsupervised hierarchical clustering of significantly (ANOVA, FDR < 0.05, fold change > 1.5 < −1.5) regulated proteins (z-scored MaxLFQ values) analyzing all fractions of the first cohort together. B, Correlation of protein fold changes (ApoE−/−, 24 weeks versus 8 weeks) of both cohorts reveals low variation. C, Gene annotation enrichment analysis of proteins from each cluster versus all quantified proteins. In addition to Gene Ontology (GO) annotations (no shading), annotations included extracted gene lists from Ingenuity pathway analysis (IPA) (yellow shading), immune cell gene signatures (Gautier et al., 2012; Jojic et al., 2013) (purple shading), as well as curated lists of matrisomal proteins (Naba et al., 2012a; Naba et al., 2012b) (blue shading) obtained from the literature. D, Cotl1 QDPS profile of cohort #1. Data points are filtered for the presence of at least two valid values and are averages. Error bars represent S.E.
Fig. 3.
Fig. 3.
Regulation of vascular calcification and decalcification pathways. A, Heatmap of mean protein expression (MaxLFQ, z-scored) of significantly regulated proteins with osteoblastic or osteoclastic functions. ko = ApoE−/−. B, Individual protein expression levels (MaxLFQ values) of three osteoclast specific subunits of osteoclastic V-ATPase complex. C, Immunohistochemistry of Tcirg1 reveals staining in MAC2-positive macrophages. Dashed lines delineate the inner vessel wall.
Fig. 4.
Fig. 4.
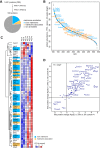
Matrisome remodeling during atherosclerotic plaque formation. A, Definition of ECM associated proteins based on solubility profiles. B, Ranked protein abundance of ECM associated proteins defined in (A) in the insoluble fraction of 24 week old ApoE−/− mice. Pale blue: core matrisome proteins, orange: matrisome-associated proteins. C, Hierarchical clustering of protein expression values (MaxLFQ, z-scored) in the insoluble fraction of significantly (FDR < 0.1, s0 = 1) regulated ECM-associated proteins defined in (A). D, Correlation of fold expression changes (24 week versus 8 week old ApoE−/− mice) between both cohorts of significantly regulated proteins from the insoluble fraction of cohort #1 reveals low variation.
Fig. 5.
Fig. 5.
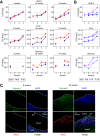
Identification of novel atherosclerosis-associated ECM proteins. A, B, QDSP profiles for ECM-associated proteins with a novel role in atherogenesis in both cohort #1 (A) and cohort #2 (B). Data points are filtered for the presence of at least two valid values and are averages. Error bars represent S.E. C, IHC of Mamdc2 in young healthy (left panel) and mature atherosclerotic aortas (right panel) from ApoE−/− mice. Dashed lines delineate the inner vessel wall (EC: endothelial cell layer).

References

    1. WHO. Cardiovascular diseases (CVDs). 2017; Available from: http://www.who.int/mediacentre/factsheets/fs317/en/.
    1. Kannel W. B., Wolf P. A., and Verter J. (1983) Manifestations of coronary disease predisposing to stroke. The Framingham study. JAMA 250, 2942–2946 - PubMed
    1. Iso H., Jacobs D. R. Jr., Wentworth D., Neaton J. D., and Cohen J. D. (1989) Serum cholesterol levels and six-year mortality from stroke in 350,977 men screened for the multiple risk factor intervention trial. N. Engl. J. Med. 320, 904–910 - PubMed
    1. Sacco R. L., Benjamin E. J., Broderick J. P., Dyken M., Easton J. D., Feinberg W. M., Goldstein L. B., Gorelick P. B., Howard G., Kittner S. J., Manolio T. A., Whisnant J. P., and Wolf P. A. (1997) American Heart Association Prevention Conference. IV. Prevention and Rehabilitation of Stroke. Risk factors. Stroke 28, 1507–1517 - PubMed
    1. Dichgans M., Malik R., Konig I. R., Rosand J., Clarke R., Gretarsdottir S., Thorleifsson G., Mitchell B. D., Assimes T. L., Levi C., O'Donnell C. J., Fornage M., Thorsteinsdottir U., Psaty B. M., Hengstenberg C., Seshadri S., Erdmann J., Bis J. C., Peters A., Boncoraglio G. B., Marz W., Meschia J. F., Kathiresan S., Ikram M. A., McPherson R., Stefansson K., Sudlow C., Reilly M. P., Thompson J. R., Sharma P., Hopewell J. C., Chambers J. C., Watkins H., Rothwell P. M., Roberts R., Markus H. S., Samani N. J., Farrall M., and Schunkert H. (2014) Shared genetic susceptibility to ischemic stroke and coronary artery disease: a genome-wide analysis of common variants. Stroke 45, 24–36 - PMC - PubMed

Publication types