. 2017 Dec 5;7(1):16985.
doi: 10.1038/s41598-017-17243-y.

The orientation and stability of the GPCR-Arrestin complex in a lipid bilayer

Affiliations

The orientation and stability of the GPCR-Arrestin complex in a lipid bilayer

Dali Wang et al. Sci Rep. .

Abstract

G protein-coupled receptors (GPCRs) constitute a large family of membrane proteins that plays a key role in transmembrane signal transduction and draw wide attention since it was discovered. Arrestin is a small family of proteins which can bind to GPCRs, block G protein interactions and redirect signaling to G-protein-independent pathways. The detailed mechanism of how arrestin interacts with GPCR remains elusive. Here, we conducted molecular dynamics simulations with coarse-grained (CG) and all-atom (AA) models to study the complex structure formed by arrestin and rhodopsin, a prototypical GPCR, in a POPC bilayer. Our results indicate that the formation of the complex has a significant impact on arrestin which is tightly anchored onto the bilayer surface, while has a minor effect on the orientation of rhodopsin in the lipid bilayer. The formation of the complex induces an internal change of conformation and flexibility in both rhodopsin and arrestin, mainly at the binding interface. Further investigation on the interaction interface identified the hydrogen bond network, especially the long-lived hydrogen bonds, and the key residues at the contact interface, which are responsible for stabilizing the complex. These results help us to better understand how rhodopsin interacts with arrestin on membranes, and thereby shed lights on arrestin-mediated signal transduction through GPCRs.


Conflict of interest statement

The authors declare that they have no competing interests.

Figures

Figure 1
Figure 1
The initial system for molecular dynamics simulations. The gray surface represents the POPC lipid bilayer. The green cartoon indicates rhodopsin and the cyan cartoon indicates arrestin. The blue and red spheres represent Na+ and CL respectively. Water molecules were filled in the whole simulation box but are not shown here for clarity.
Figure 2
Figure 2
The first principal axis of the rhodopsin-arrestin complex, rhodopsin alone and arrestin alone. Red arrow represents the first principal axis. Brown spheres indicates the position of PO4 in the POPC bilayers (a) The first principal axis of the rhodopsin-arrestin complex in a POPC bilayer. (b) The first principal axis of the standalone rhodopsin, where rhodopsin was embedded into a POPC bilayer. (c) The first principal axis of the standalone arrestin near a POPC bilayer.
Figure 3
Figure 3
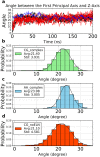
The orientation of the complex orientation in a POPC bilayer. The orientation of the complex is represented by the angle between the first principal axis of the rhodopsin-arrestin complex structure and the Z axis of the simulation box. (a) All the data from ten CG complex trajectories were plotted with black lines. Data from the ten CG complex without ELN were plotted with red lines. Blue line indicates the results from the AA MD simulation. (bd) The angle probability distribution of the CG complex, AA complex and CG complex without ELN in MD, respectively.
Figure 4
Figure 4
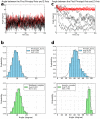
The orientation of rhodopsin and arrestin before and after the complex formation. All data from rhodopsin alone or arrestin alone were plotted with black lines, data from rhodopsin in complex or arrestin in complex were plotted with red lines. (a) The rhodopsin orientation change was subtle upon the formation of the complex. (b) The probability distribution of the angle between the first principal axis of rhodopsin and the Z-axis, before (top) and after (bottom) the complex formation. (c) The arrestin orientation was limited to a much smaller range upon the complex formation. (d) same as (b), but for arrestin.
Figure 5
Figure 5
Principal component analysis (PCA) and RMSF change of rhodopsin and arrestin. (a) The results of PCA. (b) Two extreme conformations of rhodopsin and arrestin as determined by PCA. The transparent structure represents the conformation in complex, and the opaque structure represents the standalone conformation. (c) The RMSF change of the residues of rhodopsin and arrestin upon the complex formation. (d) The colored complex structure according to the RMSF change of the residues with the blue-white-red code.
Figure 6
Figure 6
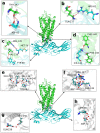
Details of the two types hydrogen bonds. Red dashed lines represent hydrogen bonds. Water was shown with the CPK model. (a) T242(rhodopsin) side chain and D83(arrestin) side chain; T242(rhodopsin) side chain and D83(arrestin) main chain. (b) Q237(rhodopsin) side chain and R82(arrestin) side chain. (c) V138(rhodopsin) main chain and Y68(arrestin) side chain; R135(rhodopsin) side chain and M76(arrestin) main chain. (d) F146(rhodopsin) main chain and K142(arrestin) side chain; F148(rhodopsin) main chain and K142(arrestin) side chain. (e) the hydrogen bonds between E249(rhodopsin) and L78(arrestin); the hydrogen bonds between V138(rhodopsin) and T79(arrestin); the hydrogen bonds between N145(rhodopsin) and Y68(arrestin). (f) the hydrogen bonds between F146(rhodopsin) and D139(arrestin); the hydrogen bonds between R147(rhodopsin) and Q138(arrestin). (g) the hydrogen bonds between Q236(rhodopsin) and L250(arrestin). (h) the hydrogen bonds between K66(rhodopsin) and D72(arrestin).
Figure 7
Figure 7
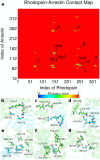
The residue contact map at the rhodopsin-arrestin interface. (a) Site hb1 represents type A hydrogen bonds in Fig. 6c; hb2 represents type A hydrogen bonds in Fig. 6a; hb3 represents type A hydrogen bonds in Fig. 6d; and hb4 represents type B hydrogen bonds in Fig. 6f. (bd) Electrostatic interaction sites at the complex interface. (eg) Hydrophobic contacts at the complex interface.

Similar articles

  • Formation and decay of the arrestin·rhodopsin complex in native disc membranes.
    Beyrière F, Sommer ME, Szczepek M, Bartl FJ, Hofmann KP, Heck M, Ritter E. Beyrière F, et al. J Biol Chem. 2015 May 15;290(20):12919-28. doi: 10.1074/jbc.M114.620898. Epub 2015 Apr 6. J Biol Chem. 2015. PMID: 25847250 Free PMC article.
  • A Novel Polar Core and Weakly Fixed C-Tail in Squid Arrestin Provide New Insight into Interaction with Rhodopsin.
    Bandyopadhyay A, Van Eps N, Eger BT, Rauscher S, Yedidi RS, Moroni T, West GM, Robinson KA, Griffin PR, Mitchell J, Ernst OP. Bandyopadhyay A, et al. J Mol Biol. 2018 Oct 19;430(21):4102-4118. doi: 10.1016/j.jmb.2018.08.009. Epub 2018 Aug 16. J Mol Biol. 2018. PMID: 30120952
  • Crystal structure of rhodopsin bound to arrestin by femtosecond X-ray laser.
    Kang Y, Zhou XE, Gao X, He Y, Liu W, Ishchenko A, Barty A, White TA, Yefanov O, Han GW, Xu Q, de Waal PW, Ke J, Tan MH, Zhang C, Moeller A, West GM, Pascal BD, Van Eps N, Caro LN, Vishnivetskiy SA, Lee RJ, Suino-Powell KM, Gu X, Pal K, Ma J, Zhi X, Boutet S, Williams GJ, Messerschmidt M, Gati C, Zatsepin NA, Wang D, James D, Basu S, Roy-Chowdhury S, Conrad CE, Coe J, Liu H, Lisova S, Kupitz C, Grotjohann I, Fromme R, Jiang Y, Tan M, Yang H, Li J, Wang M, Zheng Z, Li D, Howe N, Zhao Y, Standfuss J, Diederichs K, Dong Y, Potter CS, Carragher B, Caffrey M, Jiang H, Chapman HN, Spence JC, Fromme P, Weierstall U, Ernst OP, Katritch V, Gurevich VV, Griffin PR, Hubbell WL, Stevens RC, Cherezov V, Melcher K, Xu HE. Kang Y, et al. Nature. 2015 Jul 30;523(7562):561-7. doi: 10.1038/nature14656. Epub 2015 Jul 22. Nature. 2015. PMID: 26200343 Free PMC article.
  • Structural features of activated GPCR signaling complexes.
    Wang J, Hua T, Liu ZJ. Wang J, et al. Curr Opin Struct Biol. 2020 Aug;63:82-89. doi: 10.1016/j.sbi.2020.04.008. Epub 2020 May 30. Curr Opin Struct Biol. 2020. PMID: 32485565 Review.
  • Understanding the GPCR biased signaling through G protein and arrestin complex structures.
    Zhou XE, Melcher K, Xu HE. Zhou XE, et al. Curr Opin Struct Biol. 2017 Aug;45:150-159. doi: 10.1016/j.sbi.2017.05.004. Epub 2017 May 27. Curr Opin Struct Biol. 2017. PMID: 28558341 Review.

Cited by

References

    1. Venkatakrishnan A, et al. Molecular signatures of G-protein-coupled receptors. Nature. 2013;494:185–194. doi: 10.1038/nature11896. - DOI - PubMed
    1. Hofmann KP, et al. A G protein-coupled receptor at work: the rhodopsin model. Trends in Biochemical Sciences. 2009;34:540–552. doi: 10.1016/j.tibs.2009.07.005. - DOI - PubMed
    1. Palczewski K, et al. Crystal structure of rhodopsin: A G protein-coupled receptor. Science. 2000;289:739–45. doi: 10.1126/science.289.5480.739. - DOI - PubMed
    1. Shukla AK, et al. Structure of active β-arrestin-1 bound to a G-protein-coupled receptor phosphopeptide. Nature. 2013;497:137–141. doi: 10.1038/nature12120. - DOI - PMC - PubMed
    1. Ferguson SS, Barak LS, Zhang J, Caron MG. G-protein-coupled receptor regulation: role of G-protein-coupled receptor kinases and arrestins. Can J Physiol Pharmacol. 1996;74:1095–1110. doi: 10.1139/y96-124. - DOI - PubMed

Publication types

LinkOut - more resources