. 2017 Dec 5;8(1):1947.
doi: 10.1038/s41467-017-01907-4.

Future loss of Arctic sea-ice cover could drive a substantial decrease in California's rainfall

Affiliations

Future loss of Arctic sea-ice cover could drive a substantial decrease in California's rainfall

Ivana Cvijanovic et al. Nat Commun. .

Abstract

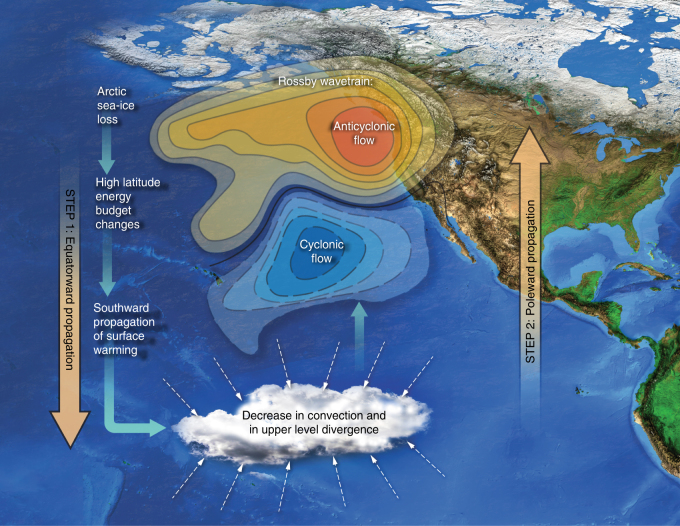
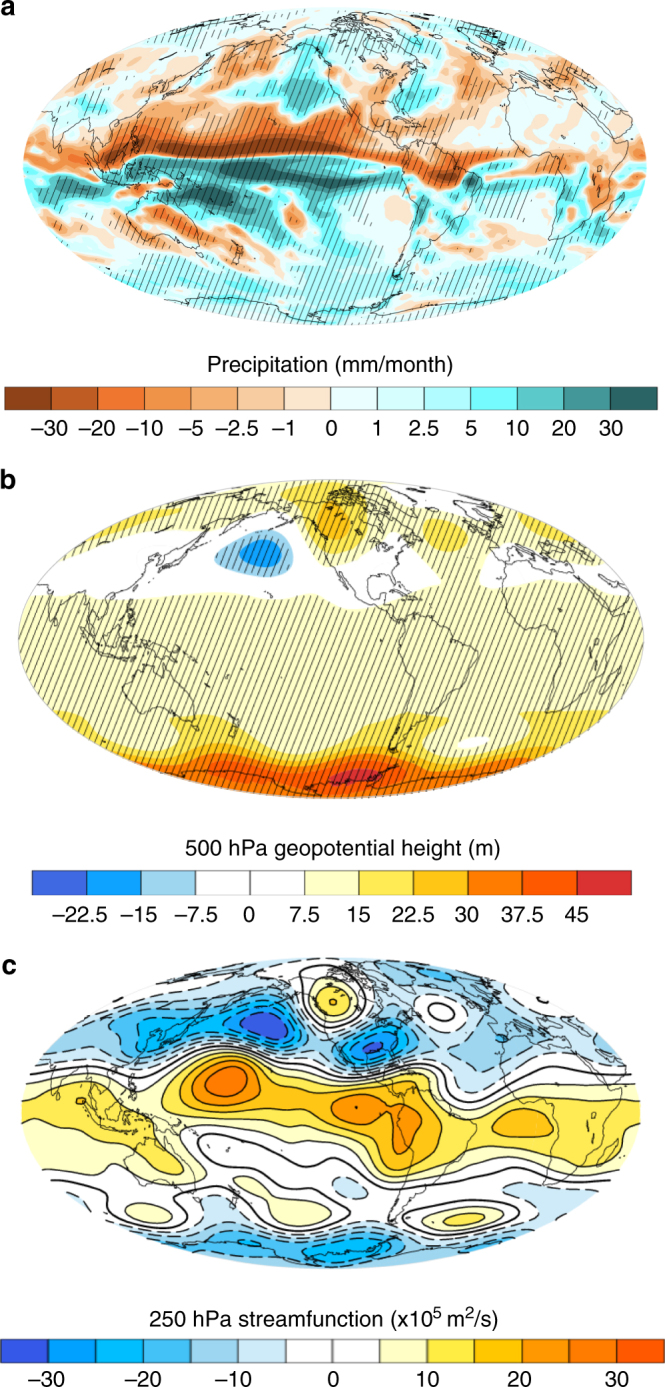
From 2012 to 2016, California experienced one of the worst droughts since the start of observational records. As in previous dry periods, precipitation-inducing winter storms were steered away from California by a persistent atmospheric ridging system in the North Pacific. Here we identify a new link between Arctic sea-ice loss and the North Pacific geopotential ridge development. In a two-step teleconnection, sea-ice changes lead to reorganization of tropical convection that in turn triggers an anticyclonic response over the North Pacific, resulting in significant drying over California. These findings suggest that the ability of climate models to accurately estimate future precipitation changes over California is also linked to the fidelity with which future sea-ice changes are simulated. We conclude that sea-ice loss of the magnitude expected in the next decades could substantially impact California's precipitation, thus highlighting another mechanism by which human-caused climate change could exacerbate future California droughts.


Conflict of interest statement

The authors declare no competing financial interests.

Figures

Fig. 1
Fig. 1
Impact of sea-ice physics parameter perturbations on Arctic and Antarctic sea-ice cover. a Arctic sea-ice concentrations, September. b Antarctic sea-ice concentrations, March. Shown are monthly mean sea-ice concentrations. Areas contained within contour lines have sea-ice fractions larger than 15%. Thick black lines denote control ensemble means, thick purple lines show “low Arctic ice” in a and “low Antarctic ice” ensemble means in b. Thin purple lines indicate individual “low Arctic ice” (“low Antarctic ice”) simulations. The colored shading indicates the average observed September (a) and March (b) sea-ice concentrations over the period 1992–2001 (from the Center for Satellite Exploitation and Research; http://nsidc.org/data/sipn/data-sets.html#seaice-conc-ext). A brief comparison of Arctic vs. Antarctic sea-ice changes is provided in Supplementary Note 1
Fig. 2
Fig. 2
Atmospheric impacts of Arctic sea-ice loss. Shown are the ensemble mean differences (“low Arctic ice” minus control) for December–February (DJF) season. Stippling indicates anomalies that are statistically significant at the 90% confidence level. a Surface temperature anomalies. b Precipitation anomalies (absolute). c Precipitation anomalies (relative). d Outgoing longwave radiation (OLR) anomalies (shading) and the high cloud cover anomalies (contours). e 500 hPa geopotential distribution changes. f Stream function changes. Negative cloud cover anomalies in d are indicated with dashed lines
Fig. 3
Fig. 3
Changes to 250 mb vertical velocity (hPa/s). a Control simulation climatology. b The response to Arctic sea-ice loss (“low Arctic ice” minus control ensemble mean). Positive sign denotes subsidence. Stippling in b indicates anomalies that are statistically significant at the 90% confidence level
Fig. 4
Fig. 4
Schematics of the two-step teleconnection. In step 1 (equatorward propagation), Arctic sea-ice loss induced high-latitude changes propagate into tropics, triggering tropical circulation and convection response. Decreased convection and decreased upper-level divergence in the tropical Pacific in turn drive a northward-propagating Rossby wavetrain with anticyclonic flow forming in the North Pacific. This ridge is responsible for steering the wet tropical air masses away from California
Fig. 5
Fig. 5
Atmospheric impacts of Antarctic sea-ice loss. a Precipitation anomalies. b 500 hPa geopotential distribution changes. c Stream function changes. Shown are the ensemble mean differences (“low Arctic ice” minus control) for December–February (DJF) season. Stippling indicates anomalies that are statistically significant at the 90% confidence level

References

    1. Knutti R, Sedláček J. Robustness and uncertainties in the new CMIP5 climate model projections. Nat. Clim. Change. 2012;3:369–373. doi: 10.1038/nclimate1716. - DOI
    1. Neelin JD, Langenbrunner B, Meyerson JE, Hall A, Berg N. California winter precipitation change under global warming in the coupled model intercomparison project phase 5 ensemble. J. Clim. 2013;26:6238–6256. doi: 10.1175/JCLI-D-12-00514.1. - DOI
    1. Simpson IR, Seager R, Ting M, Shaw TA. Causes of change in Northern hemisphere winter meridional winds and regional hydroclimate. Nat. Clim. Change. 2015;6:65–70.
    1. Chen SC, Cayan DR. Low-frequency aspects of the large-scale circulation and West coast United States temperature/precipitation fluctuations in a simplified general circulation model. J. Clim. 1994;7:1668–1683. doi: 10.1175/1520-0442(1994)007<1668:LFAOTL>2.0.CO;2. - DOI
    1. Diffenbaugh NS, Swain DL, Touma D. Anthropogenic warming has increased drought risk in California. Proc. Natl Acad. Sci. USA. 2015;112:3931–3936. doi: 10.1073/pnas.1422385112. - DOI - PMC - PubMed

Publication types