

A Three-Layer Network Model of Direction Selective Circuits in the Optic Tectum
- PMID: 29209178
- PMCID: PMC5702351
- DOI: 10.3389/fncir.2017.00088
A Three-Layer Network Model of Direction Selective Circuits in the Optic Tectum
Abstract
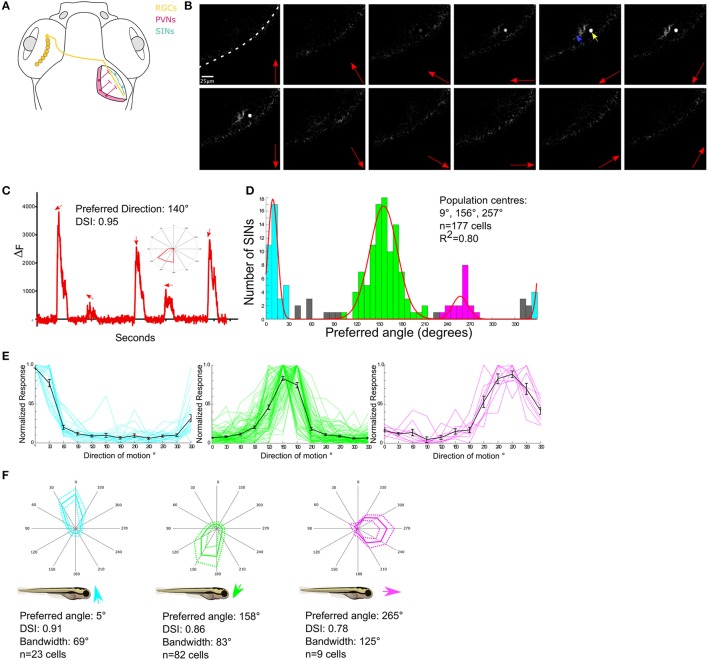
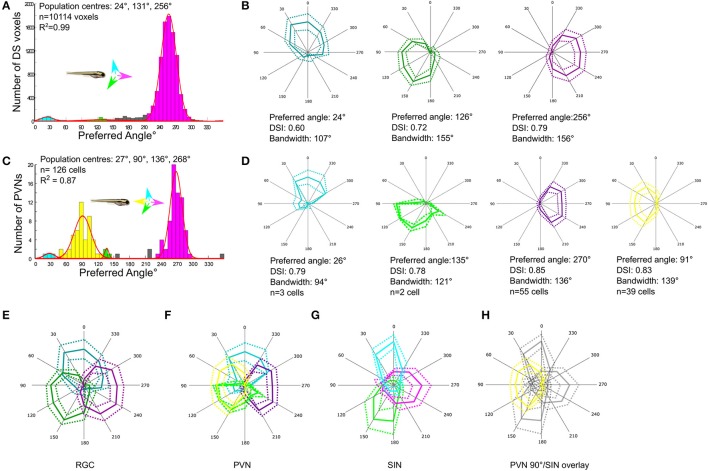
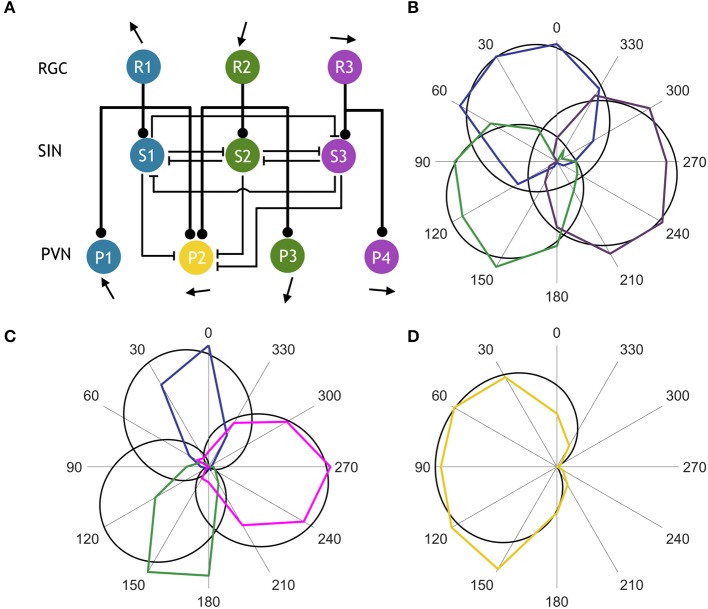
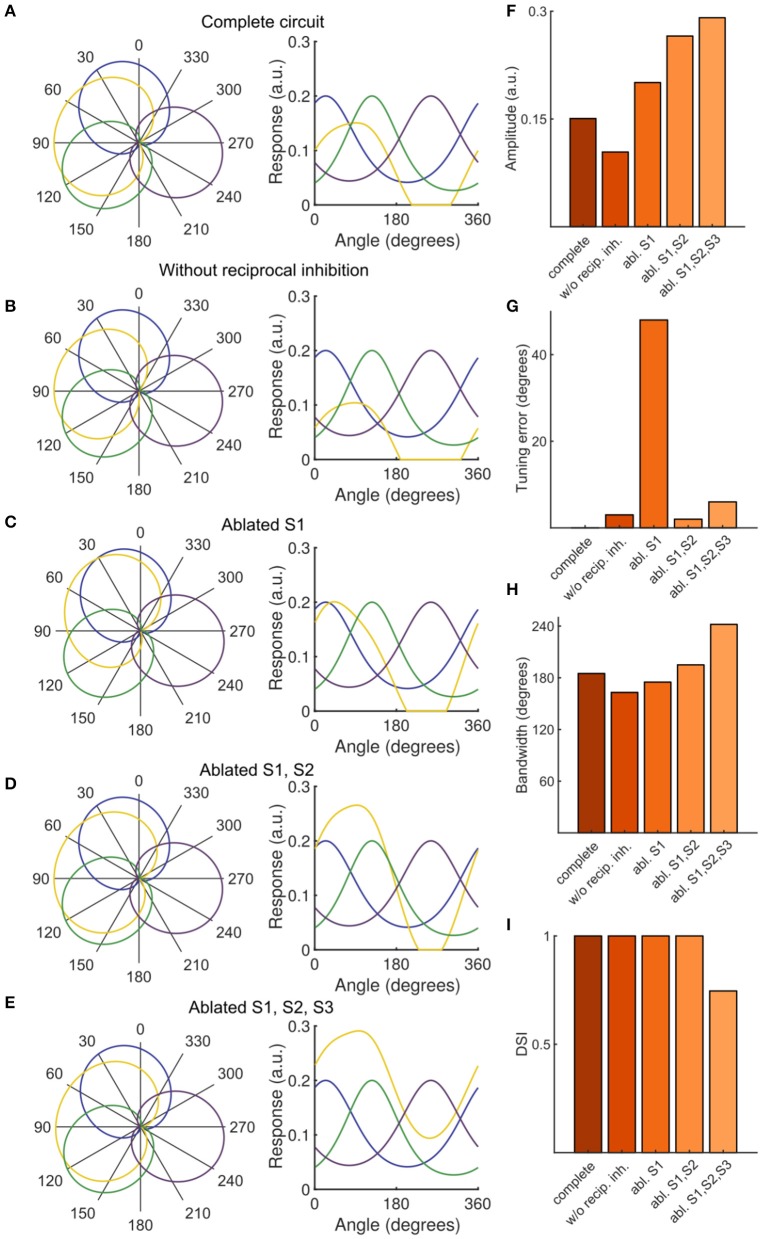
The circuit mechanisms that give rise to direction selectivity in the retina have been studied extensively but how direction selectivity is established in retinorecipient areas of the brain is less well understood. Using functional imaging in larval zebrafish we examine how the direction of motion is encoded by populations of neurons at three layers of the optic tectum; retinal ganglion cell axons (RGCs), a layer of superficial inhibitory interneurons (SINs), and periventricular neurons (PVNs), which constitute the majority of neurons in the tectum. We show that the representation of motion direction is transformed at each layer. At the level of RGCs and SINs the direction of motion is encoded by three direction-selective (DS) subtypes tuned to upward, downward, and caudal-to-rostral motion. However, the tuning of SINs is significantly narrower and this leads to a conspicuous gap in the representation of motion in the rostral-to-caudal direction at the level of SINs. Consistent with previous findings we demonstrate that, at the level of PVNs the direction of motion is encoded by four DS cell types which include an additional DS PVN cell type tuned to rostral-to-caudal motion. Strikingly, the tuning profile of this emergent cell type overlaps with the gap in the representation of rostral-to-caudal motion at the level of SINs. Using our functional imaging data we constructed a simple computational model that demonstrates how the emergent population of PVNs is generated by the interactions of cells at each layer of the tectal network. The model predicts that PVNs tuned to rostral-to-caudal motion can be generated via convergence of DS RGCs tuned to upward and downward motion and feedforward tuned inhibition via SINs which suppresses responses to non-preferred directions. Thus, by reshaping directional tuning that is inherited from the retina inhibitory inputs from SINs can generate a novel subtype of DS PVN and in so doing enhance the encoding of directional stimuli.
Keywords: direction selectivity; functional imaging; network model; retinal ganglion cell; tectum; zebrafish.
Figures
Similar articles
-
Optic tectal superficial interneurons detect motion in larval zebrafish.Protein Cell. 2019 Apr;10(4):238-248. doi: 10.1007/s13238-018-0587-7. Epub 2018 Nov 12. Protein Cell. 2019. PMID: 30421356 Free PMC article.
-
Direction selectivity in the visual system of the zebrafish larva.Front Neural Circuits. 2013 Jun 18;7:111. doi: 10.3389/fncir.2013.00111. eCollection 2013. Front Neural Circuits. 2013. PMID: 23785314 Free PMC article. Review.
-
Layer-specific targeting of direction-selective neurons in the zebrafish optic tectum.Neuron. 2012 Dec 20;76(6):1147-60. doi: 10.1016/j.neuron.2012.12.003. Neuron. 2012. PMID: 23259950
-
Putative targets of direction-selective retinal ganglion cells in the tectum opticum of cyprinid fish.Brain Res. 2019 Apr 1;1708:20-26. doi: 10.1016/j.brainres.2018.12.006. Epub 2018 Dec 5. Brain Res. 2019. PMID: 30527677
-
Roles of visually evoked and spontaneous activity in the development of retinal direction selectivity maps.Trends Neurosci. 2022 Jul;45(7):529-538. doi: 10.1016/j.tins.2022.04.002. Epub 2022 Apr 29. Trends Neurosci. 2022. PMID: 35491255 Review.
Cited by
-
Selective processing of all rotational and translational optic flow directions in the zebrafish pretectum and tectum.BMC Biol. 2019 Mar 29;17(1):29. doi: 10.1186/s12915-019-0648-2. BMC Biol. 2019. PMID: 30925897 Free PMC article.
-
From perception to behavior: The neural circuits underlying prey hunting in larval zebrafish.Front Neural Circuits. 2023 Feb 1;17:1087993. doi: 10.3389/fncir.2023.1087993. eCollection 2023. Front Neural Circuits. 2023. PMID: 36817645 Free PMC article. Review.
-
Panx1b Modulates the Luminance Response and Direction of Locomotion in the Zebrafish.Int J Mol Sci. 2021 Oct 29;22(21):11750. doi: 10.3390/ijms222111750. Int J Mol Sci. 2021. PMID: 34769181 Free PMC article.
-
Automated synapse-level reconstruction of neural circuits in the larval zebrafish brain.Nat Methods. 2022 Nov;19(11):1357-1366. doi: 10.1038/s41592-022-01621-0. Epub 2022 Oct 24. Nat Methods. 2022. PMID: 36280717 Free PMC article.
-
Retinotectal circuitry of larval zebrafish is adapted to detection and pursuit of prey.Elife. 2020 Oct 12;9:e58596. doi: 10.7554/eLife.58596. Elife. 2020. PMID: 33044168 Free PMC article.
References
-
- Ben Fredj N., Hammond S., Otsuna H., Chien C. B., Burrone J., Meyer M. P., et al. . (2010). Synaptic activity and activity-dependent competition regulates axon arbor maturation, growth arrest, and territory in the retinotectal projection. J. Neurosci. 30, 10939–10951. 10.1523/JNEUROSCI.1556-10.2010 - DOI - PMC - PubMed
Publication types
MeSH terms
Grants and funding
LinkOut - more resources
Full Text Sources
Other Literature Sources
Molecular Biology Databases
Miscellaneous