. 2017 Nov 21:8:2296.
doi: 10.3389/fmicb.2017.02296. eCollection 2017.

Influence of Stress and Antibiotic Resistance on Cell-Length Distribution in Mycobacterium tuberculosis Clinical Isolates

Affiliations

Influence of Stress and Antibiotic Resistance on Cell-Length Distribution in Mycobacterium tuberculosis Clinical Isolates

Srinivasan Vijay et al. Front Microbiol. .

Abstract

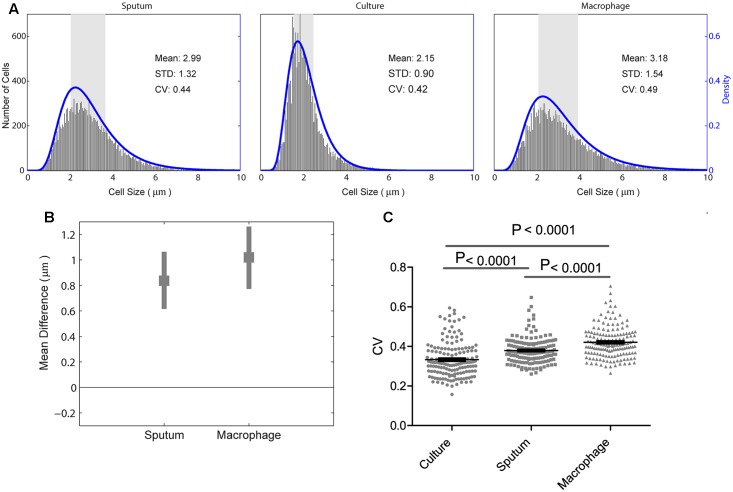
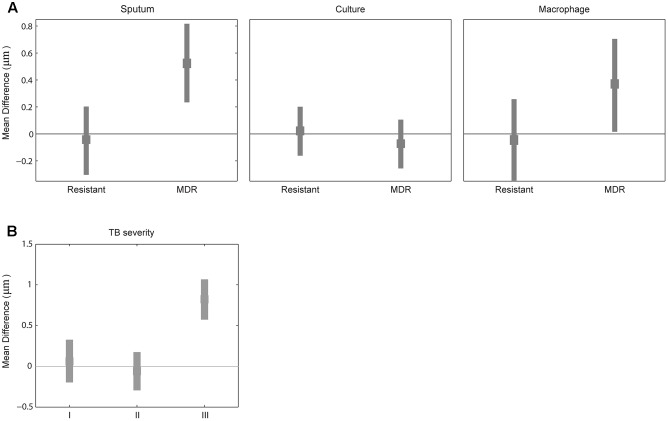
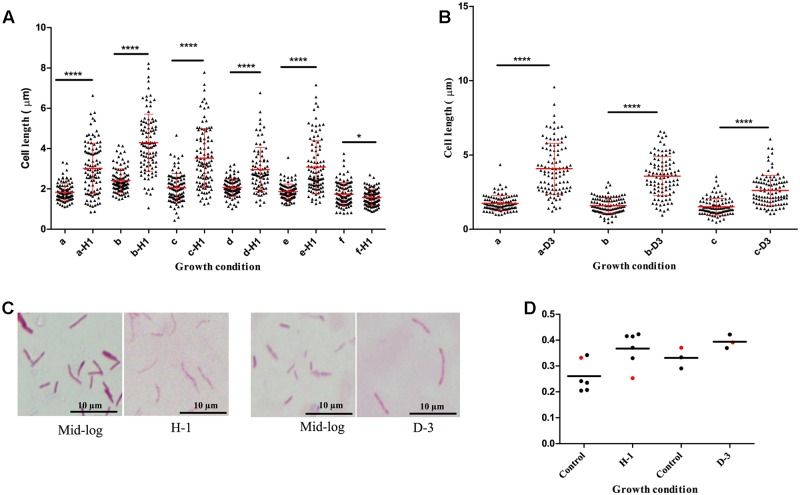
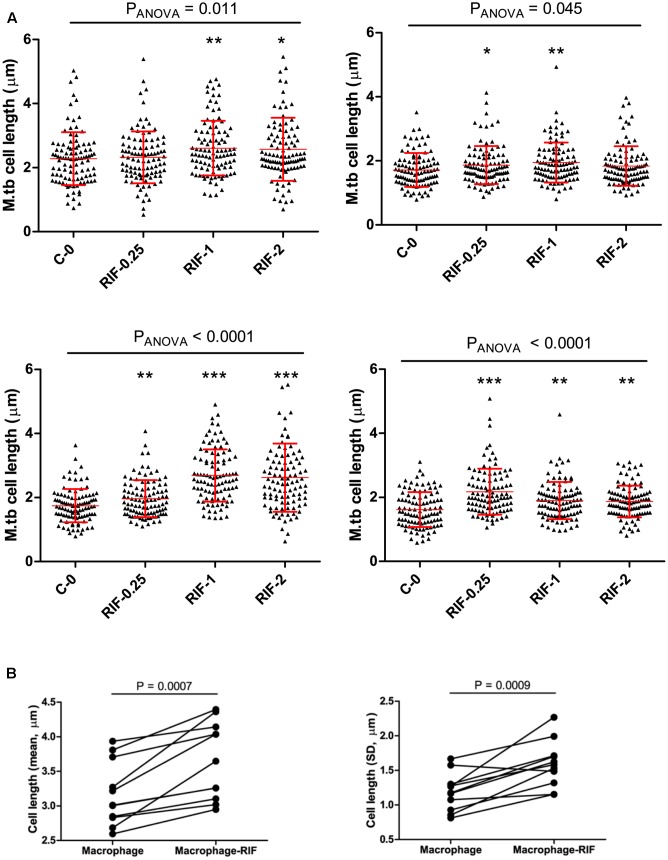
Mycobacterial cellular variations in growth and division increase heterogeneity in cell length, possibly contributing to cell-to-cell variation in host and antibiotic stress tolerance. This may be one of the factors influencing Mycobacterium tuberculosis persistence to antibiotics. Tuberculosis (TB) is a major public health problem in developing countries, antibiotic persistence, and emergence of antibiotic resistance further complicates this problem. We wanted to investigate the factors influencing cell-length distribution in clinical M. tuberculosis strains. In parallel we examined M. tuberculosis cell-length distribution in a large set of clinical strains (n = 158) from ex vivo sputum samples, in vitro macrophage models, and in vitro cultures. Our aim was to understand the influence of clinically relevant factors such as host stresses, M. tuberculosis lineages, antibiotic resistance, antibiotic concentrations, and disease severity on the cell size distribution in clinical M. tuberculosis strains. Increased cell size and cell-to-cell variation in cell length were associated with bacteria in sputum and infected macrophages rather than liquid culture. Multidrug-resistant (MDR) strains displayed increased cell length heterogeneity compared to sensitive strains in infected macrophages and also during growth under rifampicin (RIF) treatment. Importantly, increased cell length was also associated with pulmonary TB disease severity. Supporting these findings, individual host stresses, such as oxidative stress and iron deficiency, increased cell-length heterogeneity of M. tuberculosis strains. In addition we also observed synergism between host stress and RIF treatment in increasing cell length in MDR-TB strains. This study has identified some clinical factors contributing to cell-length heterogeneity in clinical M. tuberculosis strains. The role of these cellular adaptations to host and antibiotic tolerance needs further investigation.

Keywords: Mycobacterium tuberculosis; cell-length variation; iron deficiency; macrophage infection; multidrug resistance; oxidative stress; rifampicin; sputum.


Figures

FIGURE 1
FIGURE 1
Study design.
FIGURE 2
FIGURE 2
Mycobacterium tuberculosis cell-length distribution and CV between sputum, macrophage infection, and culture. (A) Absolute number of M. tuberculosis cell-length distribution (corresponding to right y-axis) combined from all the strains in sputum, culture, and infected macrophages (macrophage) are shown. The blue lines (corresponding to the right y-axis) are maximum-likelihood estimation for M. tuberculosis cell-length distribution. The gray rectangle represents the interquartile range of cell length. (B) Difference in mean M. tuberculosis cell length was compared between liquid culture and host conditions such as sputum and infected macrophages. Average mean difference (gray square dots) and 95% confidence interval (CI) (gray bars) of cell length in sputum, infected macrophages compared to liquid culture (base line corresponding to zero) by bootstrap method. If the average mean difference and 95% CI does not include zero for a group, then there is a significant difference in the mean cell length between that group and the base line. (C) Individual M. tuberculosis strains CV in culture, sputum, and infected macrophages, P-values by ANOVA, and Mann–Whitney test. SD, standard deviation; CV, coefficient of variation.
FIGURE 3
FIGURE 3
Difference in mean cell length between sensitive and resistant strains or by TB severity. (A) Difference in mean M. tuberculosis cell length between sensitive (line corresponding to zero) and other two (resistant and MDR) M. tuberculosis strains from sputum, culture, and macrophage. (B) Difference in mean M. tuberculosis cell length between patients sputum without blood and cavitary lesions (base line corresponding to zero) and different TB severity (I) with bloody sputum and without cavitary lesions, (II) without bloody sputum but with cavitary lesions, and (III) with both bloody sputum and cavitary lesions by bootstrap method.
FIGURE 4
FIGURE 4
Mycobacterium tuberculosis cell-length distribution in individual strains under oxidative stress and iron deficiency. (A) M. tuberculosis cell-length distribution under oxidative stress (a-H1 to e-H1) five clinical M. tuberculosis strains and (f-H1) laboratory strain H37Rv treated with 21 mM H2O2 along with respective untreated mid-log controls (a–f). (B) M. tuberculosis cell-length distribution under iron deficiency (a-D3 and b-D3) two clinical M. tuberculosis strains, and (c-D3) laboratory strain H37Rv treated with 500 μM DFO along with respective untreated mid-log controls (a–c). In each strain n = 100 cell length in each condition. P-values by Mann–Whitney U-test, P < 0.05, ∗∗P < 0.01, ∗∗∗P < 0.001, and ∗∗∗∗P < 0.0001. (C) ZN staining of a clinical M. tuberculosis strain from oxidative stress (H-1) and iron deficiency (D-3) along with mid-log controls. (D) CV of M. tuberculosis strains from oxidative stress (H-1) and iron deficiency (D-3), black circle indicates clinical M. tuberculosis strains and red circle represents H37Rv. DFO, deferoxamine mesylate salt.
FIGURE 5
FIGURE 5
Cell length of MDR-TB strains under rifampicin and macrophage infection with Rif treatment. (A) MDR-TB strains (n = 4) cell-length distribution under different concentrations of RIF (μg/ml), MIC = 1.0 μg/ml, C-0 indicates no Rif. Comparisons across multiple groups of RIF concentrations were performed by one-way analysis of variance (ANOVA), comparisons of two groups by Mann–Whitney test. P-values by Mann–Whitney U-test between C-0 and RIF treatment, P < 0.05, ∗∗P < 0.01, and ∗∗∗P < 0.001. (B) Mean and standard deviation (SD) of cell lengths of MDR-TB strains (n = 11) under macrophage infection and macrophage infection with RIF treatment at 1 μg/ml. Around 100 cells were measured in each MDR-TB strains. P-values by Mann–Whitney test.

References

    1. Aldridge B. B., Fernandez-Suarez M., Heller D., Ambravaneswaran V., Irimia D., Toner M., et al. (2012). Asymmetry and aging of mycobacterial cells lead to variable growth and antibiotic susceptibility. Science 335 100–104. 10.1126/science.1216166 - DOI - PMC - PubMed
    1. Avarbock A., Avarbock D., Teh J. S., Buckstein M., Wang Z. M., Rubin H. (2005). Functional regulation of the opposing (p)ppGpp synthetase/hydrolase activities of RelMtb from Mycobacterium tuberculosis. Biochemistry 44 9913–9923. 10.1021/bi0505316 - DOI - PubMed
    1. Balaban N. Q., Merrin J., Chait R., Kowalik L., Leibler S. (2004). Bacterial persistence as a phenotypic switch. Science 305 1622–1625. 10.1126/science.1099390 - DOI - PubMed
    1. Bergmiller T., Andersson A. M. C., Tomasek K., Balleza E., Kiviet D. J., Hauschild R., et al. (2017). Biased partitioning of the multidrug efflux pump AcrAB-TolC underlies long-lived phenotypic heterogeneity. Science 356 311–315. 10.1126/science.aaf4762 - DOI - PubMed
    1. Bhaskar A., Chawla M., Mehta M., Parikh P., Chandra P., Bhave D., et al. (2014). Reengineering redox sensitive GFP to measure mycothiol redox potential of Mycobacterium tuberculosis during infection. PLOS Pathog. 10:e1003902. 10.1371/journal.ppat.1003902 - DOI - PMC - PubMed

LinkOut - more resources