. 2017 Nov 10:8:1503.
doi: 10.3389/fimmu.2017.01503. eCollection 2017.

Dual Molecular Mechanisms Govern Escape at Immunodominant HLA A2-Restricted HIV Epitope

Affiliations

Dual Molecular Mechanisms Govern Escape at Immunodominant HLA A2-Restricted HIV Epitope

David K Cole et al. Front Immunol. .

Abstract

Serial accumulation of mutations to fixation in the SLYNTVATL (SL9) immunodominant, HIV p17 Gag-derived, HLA A2-restricted cytotoxic T lymphocyte epitope produce the SLFNTIAVL triple mutant "ultimate" escape variant. These mutations in solvent-exposed residues are believed to interfere with TCR recognition, although confirmation has awaited structural verification. Here, we solved a TCR co-complex structure with SL9 and the triple escape mutant to determine the mechanism of immune escape in this eminent system. We show that, in contrast to prevailing hypotheses, the main TCR contact residue is 4N and the dominant mechanism of escape is not via lack of TCR engagement. Instead, mutation of solvent-exposed residues in the peptide destabilise the peptide-HLA and reduce peptide density at the cell surface. These results highlight the extraordinary lengths that HIV employs to evade detection by high-affinity TCRs with a broad peptide-binding footprint and necessitate re-evaluation of this exemplar model of HIV TCR escape.

Keywords: HIV; MHC; T-cell; T-cell receptor; immune escape.


Figures

Figure 1
Figure 1
Structural analysis of the 868-A2–SL9-binding mode. (A) The overall binding mode of the 868 TCR (red and magenta cartoon) interacting with HLA A2 (grey surface) and the SLYNTVATL peptide (red sticks and surface). (B) Surface representation of the A2–SLYNTVATL complex looking down at the peptide. Positions of the 868 TCR CDR loops (1α—red, 2α—green, 3α—blue, 1β—yellow, 2β—cyan, 3β—orange) and the crossing angle of the TCR with the MHC groove is shown. (C) The positions of the 868 TCR CDR3 loops differ considerably between the ligated (red cartoon) and unligated (grey cartoon) structures.
Figure 2
Figure 2
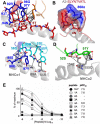
The 868 TCR focuses on residues 4N and 5T in the peptide. Hydrogen bonds show as red dotted lines, van der Waal’s contacts shown as black dotted lines in panels (A–D). (A) The 868 TCR (CDR3α in blue, CDR1α red and CDR3β orange sticks) binding to the solvent-exposed peptide residues 4N and 5T in the peptide (red sticks). (B) The 868 TCR (CDR3α in blue, CDR1α red sticks and surface) forms a tight pocket around peptide residue 4N (red sticks) during binding. (C,D) The restriction triad residues 72Q, 69A, and 155Q (grey sticks) play a central role in 868 TCR–MHC-mediated interactions (TCR CDR3α residues shown in blue, CDR2β in cyan, and CDR1α in green sticks). (E) 868 TCR transduced CD8+ T-cells from two HLA A2+ donors were co-incubated with T2 cells and alanine-substituted peptides of SLYNTVATL (alanine already at position 7) overnight and supernatants used for MIP-1β ELISA. Non-linear regression curves and pEC50 for each peptide are displayed.
Figure 3
Figure 3
The 868 TCR uses a virtually identical conformation when interacting with the common escape mutants SLYNTIATL and SLFNTIAVL. (A) Identical overall binding mode of 868 TCR interacting with A2–SLYNTVATL (red), A2–SLYNTIATL (orange), and A2–SLFNTIAVL (green). HLA A2 in grey cartoon. (B) Surface representation of the A2–SLYNTVATL complex looking down at the peptide. Positions of the 868 TCR CDR loops in the A2–SLYNTVATL (red), A2–SLYNTIATL (orange), and A2–SLFNTIAVL (green) complexes. Crossing angle of the TCR is indicated. (C) Contacts between the 868 TCR and residues 3Y, 6V, and 8T in the SLYNTVATL peptide that constitute the positions that a commonly mutated by HIV. (D) Contacts between the 868 TCR and residues 3Y, 6I, and 8T in the SLYNTIATL peptide. Although slightly different, the total number of contacts between the 868 TCR and A2–SLYNTIATL is similar to the 868-A2–SLYNTVATL complex. (E) Contacts between the 868 TCR and residues 3F, 6I, and 8V in the A2–SLFNTIAVL triple escape mutant peptide. Again, the total number of contacts between the 868 TCR and A2–SLFNTIAVL is similar to the complex with the wild-type index peptide. Hydrogen bonds shown as red dotted lines and van der Waal’s contacts shown as black dotted lines in panels (C–E).
Figure 4
Figure 4
868 TCR binding alters the peptide conformation of the A2–SLYNTVATL escape mutants. Structural comparison of the A2–SLYNTVATL escape variants unligated and in complex with the 868 TCR. (A,B) A2–SLYNTVATL in complex with the 868 TCR (red sticks) vs. unligated A2–SLYNTVATL (cyan sticks). Small changes in the positions of the side chains that occur during TCR binding are circled. (C,D) A2–SLYNTIATL (orange sticks) in complex with the 868 TCR vs. unligated A2–SLYNTIATL (yellow sticks). Small changes in the positions of the side chains that occur during TCR binding are circled. (E,F) A2–SLFNTIAVL (green sticks) in complex with the 868 TCR vs. unligated A2–SLFNTIAVL (purple sticks). Small changes in the positions of the side chains that occur during TCR binding are circled.
Figure 5
Figure 5
Binding affinity and thermodynamic analysis of the 868 TCR binding to A2–SLYNTVATL, A2–SLYNTIATL, and A2–SLFNTIAVL. (A–C) Binding and kinetic analysis of the 868 TCR interaction with (A) A2–SLYNTVATL, (B) A2–SLYNTIATL, and (C) A2–SLFNTIAVL. Experiments were performed independently using a BIAcore T100 equipped with a CM5 sensor chip and repeated in triplicate on different days using different protein preparations. Representative data are shown. (D–F) Thermodynamic analysis of 868 TCR with the aforementioned ligands and surface plasmon resonance (SPR) as above. Thermodynamic parameters were calculated according to the Gibbs–Helmholtz equation (ΔG° = ΔH − TΔS°). The binding free energies, ΔG° (ΔG° = RTlnKD), were plotted against temperature (K) using non-linear regression to fit the three-parameter Van’t Hoff equation [RT ln KD = ΔH − TΔS° + ΔCp°(T − T0) − TΔCp° ln (T/T0) with T0 = 298 K]. (G–I) Thermodynamic analysis of the 868 TCR–pMHC interaction was also performed using isothermal titration calorimetry 200 instrument to directly measure ΔH. These analyses show consistent values to those generated by SPR. Overall, the 868 TCR uses a generally similar binding mechanism and thermodynamic signature to interact with all three ligands. (J) Effective 2D binding frequency, using at least 5 cell pairs, and calculated as an average of 100 cell–cell contacts. (K) Effective 2D affinity (AcKa) calculated using adhesion frequency assays and reported in the text as geometric mean. Statistics were performed on log-transformed affinities and analysed with two-tailed, unpaired parametric t-tests and assumption of equal SDs.
Figure 5
Figure 5
Binding affinity and thermodynamic analysis of the 868 TCR binding to A2–SLYNTVATL, A2–SLYNTIATL, and A2–SLFNTIAVL. (A–C) Binding and kinetic analysis of the 868 TCR interaction with (A) A2–SLYNTVATL, (B) A2–SLYNTIATL, and (C) A2–SLFNTIAVL. Experiments were performed independently using a BIAcore T100 equipped with a CM5 sensor chip and repeated in triplicate on different days using different protein preparations. Representative data are shown. (D–F) Thermodynamic analysis of 868 TCR with the aforementioned ligands and surface plasmon resonance (SPR) as above. Thermodynamic parameters were calculated according to the Gibbs–Helmholtz equation (ΔG° = ΔH − TΔS°). The binding free energies, ΔG° (ΔG° = RTlnKD), were plotted against temperature (K) using non-linear regression to fit the three-parameter Van’t Hoff equation [RT ln KD = ΔH − TΔS° + ΔCp°(T − T0) − TΔCp° ln (T/T0) with T0 = 298 K]. (G–I) Thermodynamic analysis of the 868 TCR–pMHC interaction was also performed using isothermal titration calorimetry 200 instrument to directly measure ΔH. These analyses show consistent values to those generated by SPR. Overall, the 868 TCR uses a generally similar binding mechanism and thermodynamic signature to interact with all three ligands. (J) Effective 2D binding frequency, using at least 5 cell pairs, and calculated as an average of 100 cell–cell contacts. (K) Effective 2D affinity (AcKa) calculated using adhesion frequency assays and reported in the text as geometric mean. Statistics were performed on log-transformed affinities and analysed with two-tailed, unpaired parametric t-tests and assumption of equal SDs.
Figure 6
Figure 6
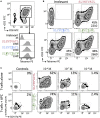
868 TCR-expressing T-cells bind escape mutant tetramers efficiently without the need for CD8. (A) Primary CD8+ T-cells were co-transduced with the 868 TCR and rat (r)CD2 prior to staining with 0.5 µg (with respect to MHC) of irrelevant (A2–ALWGPDPAAA), A2–SLYNTVATL, A2–SLYNTIATL, and A2–SLFNTIAVL PE-conjugated peptide–MHC tetramers. Cells are gated on rCD2+CD8+ cells. Histograms show staining with indicated PE-conjugated tetramer with the mean fluorescence intensity (MFI) of this population displayed. (B) As for panel (A), but 868 TCR and rat (r)CD2 were transduced into TCRβ chain negative Jurkat cells. MFI of tetramer staining is shown for cells in the rCD2+ tet+ gate. (C) 868 TCR transduced were incubated with T2 cells and either SLYNTVATL or SLFNTIAVL peptide at the concentrations shown for 5 h followed by the detection of CD107a and TNFα by flow cytometry.
Figure 7
Figure 7
Stability of A2–SLYNTVATL, A2–SLYNTIATL, and A2–SLFNTIAVL. (A) CD thermal denaturation curves recorded at 218 nm are shown for selected samples as indicated. Dots represent measured values fitted assuming a two-state trimer-to-monomer transition (solid lines) as described in Section “Materials and Methods.” (B) Bar graphs of the thermal stability with respect to melting temperature (upper) and van’t Hoff’s enthalpy of unfolding (lower panel). Error bars in panels (A,B) represent SD resulting from the multivariable curve fitting of data from one experiment with each peptide. (C) T2 cells incubated for 3 or 22 h with 10−5 M of each peptide [Influenza (Flu) Matrix, GILGFVFTL, HIV Gag wild-type SLYNTVATL, and Gag triple mutant SLFNTIAVL] or DMSO control were stained for HLA-A2 and fixed. The dashed line is set at the mean fluorescence intensity (MFI) of the negative control peptide (EBV HPVGEADYFEY that binds HLA B*3501).
Figure 8
Figure 8
Instability at the cell surface mediates viral escape by the triple mutant epitope, A2SLFNTIAVL. (A) Relative binding of 868 TCR to A2–peptide complexes by SPR over time. The SPR chip was maintained at 37°C. Functional half-life was determined by injecting the 868 TCR at a fixed concentration of 100 µM over 720 min and recording the drop in total RUs over 8 different time points. A faster drop in RUs (converted into a T1/2) was interpreted to indicate greater peptide instability, detected by loss of binding by the antigen-specific 868 TCR. (B) Left panel shows relative HLA-A2 expression following incubation (0, 3, and 22 h) of T2 cells with indicated peptide. Results are normalised to the maximum mean fluorescence intensity seen for each peptide. The right panel shows T2 cells incubated with peptide for 22 h prior to being washed and cultured in an excess of AIM-V media for the indicated times prior to staining and fixing. Data displayed as HLA-A2 expression relative to maximum seen at 22 h. (C) T2 cells were pulsed for 1 h with the peptides shown, washed extensively, and then cultured in an excess of media for 3 h (black bar) or 24 h (open bar) before being co-incubated for 5 h with T-cells from two donors transduced with the 868 TCR. CD107a and TNFα were used to establish percentage reactivity by flow cytometry. Values were normalised relative to SLYNTVATL peptide. SEM is shown for two different donor T-cells. Untransduced CD8+ T-cells did not respond to peptide (data not shown). Raw data for panel (C) is shown in Figure S1 in Supplementary Material. (D) As panel (C) but using primary HLA-A2 and HLA-A2+ CD4+ T-cells as targets and culturing in excess media for either 0 or 24 h prior to assay. Raw data for panel (D) is shown in Figure S2 in Supplementary Material.

Similar articles

Cited by

References

    1. Sewell AK, Price DA, Oxenius A, Kelleher AD, Phillips RE. Cytotoxic T lymphocyte responses to human immunodeficiency virus: control and escape. Stem Cells (2000) 18:230–44.10.1634/stemcells.18-4-230 - DOI - PubMed
    1. Goulder PJ, Watkins DI. HIV and SIV CTL escape: implications for vaccine design. Nat Rev Immunol (2004) 4:630–40.10.1038/nri1417 - DOI - PubMed
    1. Carlson JM, Le AQ, Shahid A, Brumme ZL. HIV-1 adaptation to HLA: a window into virus-host immune interactions. Trends Microbiol (2015) 23:212–24.10.1016/j.tim.2014.12.008 - DOI - PubMed
    1. Kaslow RA, Carrington M, Apple R, Park L, Munoz A, Saah AJ, et al. Influence of combinations of human major histocompatibility complex genes on the course of HIV-1 infection. Nat Med (1996) 2:405–11.10.1038/nm0496-405 - DOI - PubMed
    1. Browning M, Krausa P. Genetic diversity of HLA-A2: evolutionary and functional significance. Immunol Today (1996) 17:165–70.10.1016/0167-5699(96)80614-1 - DOI - PubMed