. 2017 Nov 20:8:1577.
doi: 10.3389/fimmu.2017.01577. eCollection 2017.

Mesenchymal Stem Cells Induce Expression of CD73 in Human Monocytes In Vitro and in a Swine Model of Myocardial Infarction In Vivo

Affiliations

Mesenchymal Stem Cells Induce Expression of CD73 in Human Monocytes In Vitro and in a Swine Model of Myocardial Infarction In Vivo

Marta Monguió-Tortajada et al. Front Immunol. .

Abstract

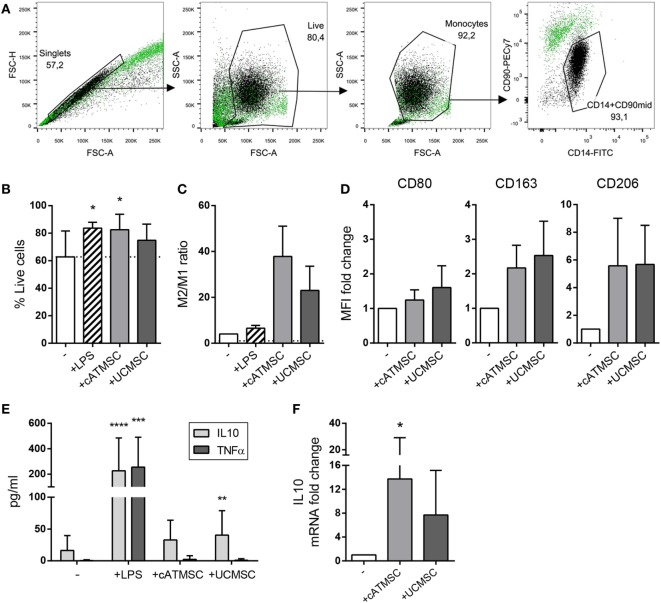
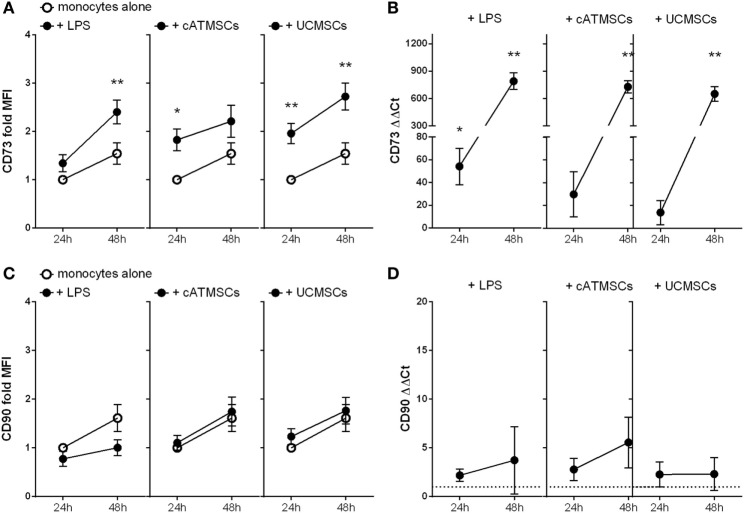
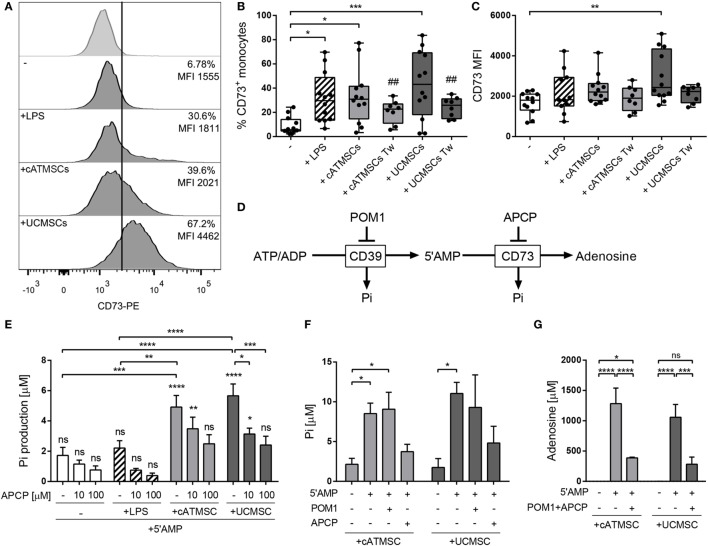
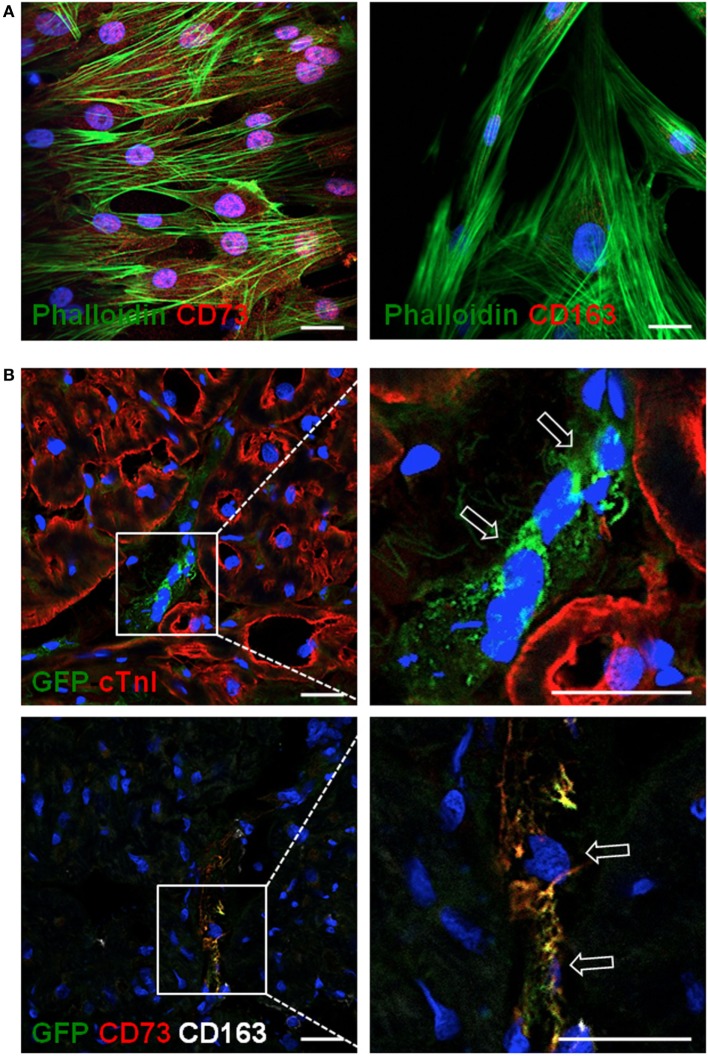
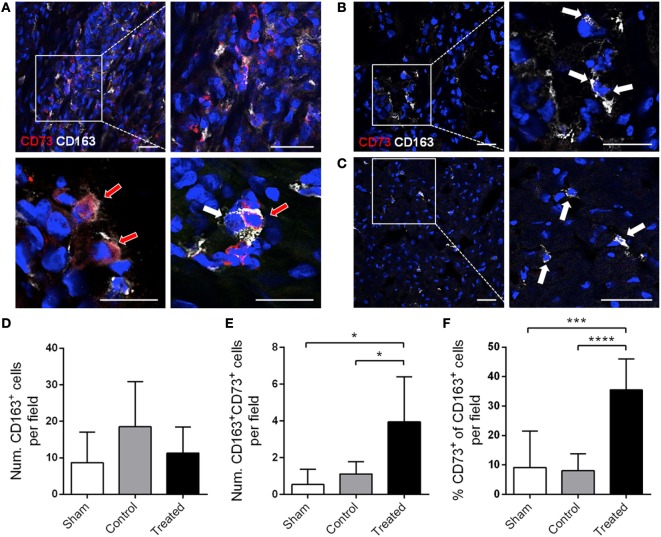
The ectoenzymes CD39 and CD73 regulate the purinergic signaling through the hydrolysis of adenosine triphosphate (ATP)/ADP to AMP and to adenosine (Ado), respectively. This shifts the pro-inflammatory milieu induced by extracellular ATP to the anti-inflammatory regulation by Ado. Mesenchymal stem cells (MSCs) have potent immunomodulatory capabilities, including monocyte modulation toward an anti-inflammatory phenotype aiding tissue repair. In vitro, we observed that human cardiac adipose tissue-derived MSCs (cATMSCs) and umbilical cord MSCs similarly polarize monocytes toward a regulatory M2 phenotype, which maintained the expression of CD39 and induced expression of CD73 in a cell contact dependent fashion, correlating with increased functional activity. In addition, the local treatment with porcine cATMSCs using an engineered bioactive graft promoted the in vivo CD73 expression on host monocytes in a swine model of myocardial infarction. Our results suggest the upregulation of ectonucleotidases on MSC-conditioned monocytes as an effective mechanism to amplify the long-lasting immunomodulatory and healing effects of MSCs delivery.

Keywords: CD73; adenosine; ectonucleotidase; immunomodulation; mesenchymal stem cell; myocardial infarction; purigernic signaling; regeneration.


Figures

Figure 1
Figure 1
cATMSCs and UCMSCs skew monocytes toward an “M2” phenotype. (A) Monocytes (CD14+/CD90mid) were separated by FACS after co-culture with cATMSCs or UCMSCs (CD14dim/CD90high). A representative gating analysis of monocytes co-cultured with UCMSCs (black dots) compared to UCMSCs alone (green dots) is shown. (B) Viability of co-cultured monocytes. Data are mean + SD of 11 independent experiments. (C) FACS-sorted monocytes were checked for the expression of M1 and M2 markers by qPCR after 48 h of co-culture. Data are expressed as mean + SD of the ratio between the M2 (ΣmRNA fold change of CD163, CD206, TGM2, and CCL18) and M1 marker (mRNA fold change of CD80) depicted in Figure S1 in Supplementary Material. Data accounts for three independent experiments. (D) Fold increase in CD80, CD163, and CD206 MFI of monocytes cultured for 72 h with cATDPCs or UCMSCs, relative to monocytes alone (−). Data accounts for three independent experiments. (E) IL10 and TNFα cytokine levels in 72 h-culture supernatants. Data are mean + SD of 12 independent experiments. Statistical differences are indicated where *p < 0.05 by one-way ANOVA with Tukey’s post hoc test compared to monocytes cultured alone (−). (F) Fold increase in IL10 mRNA of monocytes cultured for 48 h with cATDPCs or UCMSCs, relative to monocytes alone (−). Data accounts for four independent experiments. cATMSCs, cardiac adipose tissue-derived MSCs; UCMSCs, umbilical cord MSCs; TNFα, tumor necrosis factor α.
Figure 2
Figure 2
CD39 expression is maintained in monocytes co-cultured with MSCs. (A) Representative histograms depicting the CD39 expression of monocytes cultured for 72 h alone (−) or with LPS, cATMSCs, or UCMSCs. The isotype control is depicted in the top row; the % of positive cells and the MFI for the total monocyte population (CD14+/CD90mid) are indicated in each plot. (B) Percentage of CD39+ and (C) CD39 MFI of monocytes cultured for 72 h alone (−) or with LPS, cATMSCs or UCMSCs. Data account for 12 independent experiments. cATMSCs, cardiac adipose tissue-derived MSCs; UCMSCs, umbilical cord MSCs.
Figure 3
Figure 3
CD73 is induced while CD90 remains unchanged in monocytes co-cultured with cATMSCs and UCMSCs. (A,C) Fold increase in CD73 and CD90 MFI of monocytes cultured for 24 or 48 h with LPS, ATDPCs, or UCMSCs (black dots), relative to 24 h-cultured monocytes alone (white dots). Statistical differences are indicated where *p < 0.05 and **p < 0.01 by two-way ANOVA compared to monocytes cultured alone. (B,D) Fold increase in CD73 and CD90 mRNA (ΔΔCt) of monocytes, relative to monocytes cultured alone. Statistical differences are indicated where *p < 0.05; **p < 0.01; and ***p < 0.001 by one-sample T test. Data are expressed as mean ± SD and accounts for four independent experiments of different monocyte and MSC donors. MSC, mesenchymal stem cell; cATMSCs, cardiac adipose tissue-derived MSCs; UCMSCs, umbilical cord MSCs.
Figure 4
Figure 4
Monocytes co-cultured with cATMSCs or UCMSCs upregulate the adenosinergic enzymatic activity. Monocytes cultured for 72 h alone (−) or with LPS, cATMSCs or UCMSCs were checked for CD73 surface expression and activity. (A) Representative histograms of CD73 expression. The isotype control is depicted in the top row; the % of positive cells and the MFI for the total monocyte population (CD14+/CD90mid) are indicated in each plot. (B) Percentage of CD73+ and (C) CD73 MFI of monocytes as mean ± SD of 12 independent experiments. Tw: co-culture in transwell system. Statistical differences are indicated where *p < 0.05, **p < 0.01, and ***p < 0.001 by one-way ANOVA with Tukey’s post hoc analysis. (D) Schematic representation of the enzymatic hydrolysis of ATP/ADP to 5′AMP by CD39 and to Ado by CD73, which can be inhibited by POM1 and APCP, respectively. Inorganic phosphate (Pi) is produced as a byproduct in each step. (E) Levels of inorganic phosphate (Pi) produced by FACS-sorted monocytes analyzed after the addition of the CD73 substrate (5′AMP; 1 mM) with or without the CD73 inhibitor (APCP). Data are presented in bars as the mean + SD concentration of Pi subtracted from the Pi present in monocytes without 5′AMP. Data account for 9–13 independent experiments. (F,G) Levels of inorganic phosphate (Pi) (F) and of Ado (G) produced by FACS-sorted monocytes analyzed after the addition of the CD73 substrate (5′AMP; 1 mM) with or without the CD39 inhibitor (POM1) or the CD73 inhibitor (APCP). Data are presented in bars as the mean + SD concentration of Pi. Data accounts for four independent experiments. Statistical differences in each bar are compared to cells without 5′AMP or to the indicated groups where *p < 0.05, **p < 0.01, ***p < 0.001, and ****p < 0.0001 by two-way ANOVA with Tukey’s post hoc analysis. cATMSCs, cardiac adipose tissue-derived MSCs; UCMSCs, umbilical cord MSCs; ATP, adenosine triphosphate; Ado, adenosine.
Figure 5
Figure 5
CD73 and CD90 are not induced by MSC co-culture in MDDCs. (A,B) CD73 and CD90 MFI of MDDCs cultured for 48 h alone or with LPS, ATDPCs, or UCMSCs. (C,D) MFI values of the maturation markers CD25 and CD40 of MDDCs cultured for 48 h with or without cATMSCs or UCMSCs, and further stimulated with LPS (dashed bars) or not. Data are expressed as mean + SD and accounts for six independent experiments. MSC, mesenchymal stem cell; cATMSCs, cardiac adipose tissue-derived MSCs; UCMSCs, umbilical cord MSCs; MDDCs, monocyte-derived dendritic cells.
Figure 6
Figure 6
Allogeneic cATMSCs migrated to the infarcted myocardium after graft implantation in swine. Representative confocal microscope images showing (A) porcine cATMSCs in in vitro culture or (B) sections within the infarcted myocardium. (A) Porcine cATMSCs are positive for CD73 (left, red) and negative for CD163 (right, red). (B) Presence of GFP+ porcine cATMSCs (empty arrows) in post-infarcted myocardium, also positive for CD73 but negative for CD163 (lower panels). Cell morphology, cardiac muscle, and cell nuclei are also counterstained using Atto 488-phalloidin, anti-cTnI Ab, and DAPI, respectively. Scale bars = 50 µm. cATMSCs, cardiac adipose tissue-derived MSCs; DAPI, 4′,6-diamidino-2-phenylindole dihydrochloride.
Figure 7
Figure 7
CD73 is also induced in vivo in host monocytes in swine post-infarcted myocardium treated with porcine cATMSCs. (A–C) Infiltrating CD163+ monocytes (white arrows), some of them expressing CD73 (red arrows) in a cATMSC-treated animal (A), and CD163+ monocytes (white arrows) in a control (B) and sham (C) animals, both negative for CD73. CD73 is shown in red and CD163 in white, and nuclei are counterstained with DAPI in blue. Scale bars = 50 µm. (D,E) Histograms showing the number of CD163+ monocytes (D), CD73+ CD163+ monocytes (E) per optical field in all studied groups. (F) Percentage of CD73+ monocytes out of the CD163+ monocytes. Differences in immunohistochemical quantifications were compared using one-way ANOVA for multiple comparisons, with Tukey’s test for the post hoc analysis. cATMSCs, cardiac adipose tissue-derived MSCs; DAPI, 4′,6-diamidino-2-phenylindole dihydrochloride.

References

    1. Mizumoto N, Kumamoto T, Robson SC, Sévigny J, Matsue H, Enjyoji K, et al. CD39 is the dominant Langerhans cell-associated ecto-NTPDase: modulatory roles in inflammation and immune responsiveness. Nat Med (2002) 8(4):358–65.10.1038/nm0402-358 - DOI - PubMed
    1. Antonioli L, Pacher P, Vizi ES, Haskó G. CD39 and CD73 in immunity and inflammation. Trends Mol Med (2013) 19(6):355–67.10.1016/j.molmed.2013.03.005 - DOI - PMC - PubMed
    1. Murphy PS, Wang J, Bhagwat SP, Munger JC, Janssen WJ, Wright TW, et al. CD73 regulates anti-inflammatory signaling between apoptotic cells and endotoxin-conditioned tissue macrophages. Cell Death Differ (2017) 24(3):559–70.10.1038/cdd.2016.159 - DOI - PMC - PubMed
    1. Haskó G, Cronstein B. Regulation of inflammation by adenosine. Front Immunol (2013) 4:85.10.3389/fimmu.2013.00085 - DOI - PMC - PubMed
    1. Ohta A, Sitkovsky M. Extracellular adenosine-mediated modulation of regulatory T cells. Front Immunol (2014) 5:304.10.3389/fimmu.2014.00304 - DOI - PMC - PubMed