Review
. 2018 Apr;66(4):693-707.
doi: 10.1002/glia.23273. Epub 2017 Dec 6.

Myelination and mTOR

Affiliations
Review

Myelination and mTOR

Gianluca Figlia et al. Glia. 2018 Apr.

Abstract

Myelinating cells surround axons to accelerate the propagation of action potentials, to support axonal health, and to refine neural circuits. Myelination is metabolically demanding and, consistent with this notion, mTORC1-a signaling hub coordinating cell metabolism-has been implicated as a key signal for myelination. Here, we will discuss metabolic aspects of myelination, illustrate the main metabolic processes regulated by mTORC1, and review advances on the role of mTORC1 in myelination of the central nervous system and the peripheral nervous system. Recent progress has revealed a complex role of mTORC1 in myelinating cells that includes, besides positive regulation of myelin growth, additional critical functions in the stages preceding active myelination. Based on the available evidence, we will also highlight potential nonoverlapping roles between mTORC1 and its known main upstream pathways PI3K-Akt, Mek-Erk1/2, and AMPK in myelinating cells. Finally, we will discuss signals that are already known or hypothesized to be responsible for the regulation of mTORC1 activity in myelinating cells.

Keywords: Schwann cell; mTOR; metabolism; myelin; oligodendrocyte.


Figures

Figure 1
Figure 1
Myelination entails a striking expansion of the cell membrane. Schematic representation of a myelinating SC and a myelinating OL, drawn to scale. To illustrate the extent of membrane expansion during myelination, the corresponding myelin sheaths have been “unwrapped” in the bottom part. The following average dimensions have been considered: Myelinating SCs in the rat sciatic nerve wrap their membrane 72–94 times around axons and outstretch 650‐μm long internodes on average (Webster, 1971); myelinating OLs in the rat optic nerve wrap up to 30 times, extend on average 200‐μm long internodes (Butt & Ransom, 1993; Wiggins, Fuller, Brizzee, Bissel, & Samorajski, 1984), and myelinate on average 16 axons (Butt & Ransom, 1993). Of note, although no data are available for rat OLs, variations in the length of the internodes myelinated by a single OL have been reported in mice (Chong et al., 2012). For SCs and OLs, the total surface area of myelinating cells has been estimated, on average, to 20 × 105 μm2 (Pfeiffer, Warrington, & Bansal, 1993; Webster, 1971)
Figure 2
Figure 2
mTORC1 and its upstream pathways. A schematic representation of the main components of the mTORC1 pathway and major upstream pathways controlling mTORC1 activity is shown. The red line highlights the major inhibitory feedback loop from mTORC1 to PI3K‐Akt
Figure 3
Figure 3
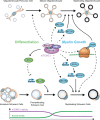
Molecular events downstream of mTORC1 during cell differentiation and myelin growth. Before onset of myelination, mTORC1 controls differentiation of myelinating cells. In the PNS, it suppresses transiently Krox20 expression via S6K and thus the transition from promyelinating to myelinating SCs. A decline in mTORC1 activity releases this block and allows myelination to proceed. In the CNS, mTORC1 activity promotes differentiation of OLs from OPCs through unknown mechanisms. After onset of myelination, mTORC1 positively regulates myelin production in both the PNS and CNS. In the PNS, mTORC1 signaling increases expression of SREBP1c via the transcription factor RXRγ, while probably promoting SREBP2 activation through post‐translational mechanisms. In the CNS, mTORC1 positively regulates at the transcriptional level expression of SREBP2, but not SREBP1c. Additionally, mTORC1 signaling stimulates translation of MBP. How mTORC1 activity changes during development of SCs with respect to Krox20 levels is graphically indicated in the bottom part of the figure. No analogous information is yet available for OL‐lineage cell development. Dashed lines indicate indirect and/or in detail unknown mechanisms
Figure 4
Figure 4
Potential perturbation of mTORC1‐independent targets upon disruption of the TSC complex. Due to feedback inhibition of the upstream pathways, hyperactivation of mTORC1 after disruption of the TSC complex (on the right) has the potential to perturb also mTORC1‐independent targets of Akt and Erk1/2 (“other targets”) leading to different outcomes (symbolized by differently colored arrows). A similar general mechanism appears to underlie paradoxical effects of TSC1 or TSC2 deletion in other cell types. The green halo indicates level of activity. Note that phosphorylation of mTORC1‐independent targets by Akt or Erk1/2 may be either activating or inhibitory
Figure 5
Figure 5
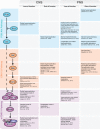
Overview of the outcomes of loss‐ or gain‐of‐function studies of various components of mTORC1 and upstream pathways. The major outcomes of the loss‐ and gain‐of‐function studies on the roles of mTORC1 and the upstream PI3K‐Akt and Mek‐Erk1/2 pathways in PNS and CNS myelination are summarized (Beirowski et al., 2017; Bercury et al., 2014; Carson et al., 2015; Cotter et al., 2010; Domenech‐Estevez et al., 2016; Figlia et al., 2017; Flores et al., 2008; Fyffe‐Maricich, Karlo, Landreth, & Miller, 2011; Fyffe‐Maricich, Schott, Karl, Krasno, & Miller, 2013; Goebbels et al., 2010, 2012; Ishii, Furusho, & Bansal, 2013; Ishii, Furusho, Dupree, & Bansal, 2016; Jeffries et al., 2016; Jiang et al., 2016; Lebrun‐Julien et al., 2014; Napoli et al., 2012; Newbern et al., 2011; Norrmén et al., 2014; Sheean et al., 2014; Sherman et al., 2012; Wahl et al., 2014; Zou et al., 2011, 2014)

References

    1. Ando, S. , Tanaka, Y. , Toyoda, Y. , & Kon, K. (2003). Turnover of myelin lipids in aging brain. Neurochemical Research, 28, 5–13. - PubMed
    1. Anjum, R. , & Blenis, J. (2008). The RSK family of kinases: Emerging roles in cellular signalling. Nature Reviews Molecular Cell Biology, 9, 747–758. - PubMed
    1. Aronova, S. , Wedaman, K. , Aronov, P. A. , Fontes, K. , Ramos, K. , Hammock, B. D. , & Powers, T. (2008). Regulation of ceramide biosynthesis by TOR complex 2. Cell Metabolism, 7, 148–158. - PMC - PubMed
    1. Barres, B. A. , & Raff, M. C. (1994). Control of oligodendrocyte number in the developing rat optic nerve. Neuron, 12, 935–942. - PubMed
    1. Baumann, N. , & Pham‐Dinh, D. (2001). Biology of oligodendrocyte and myelin in the mammalian central nervous system. Physiological Reviews, 81, 871–927. - PubMed

Publication types

Substances