. 2018 Feb 15;596(4):563-589.
doi: 10.1113/JP275351. Epub 2018 Jan 9.

Distribution of cardiac sodium channels in clusters potentiates ephaptic interactions in the intercalated disc

Affiliations

Distribution of cardiac sodium channels in clusters potentiates ephaptic interactions in the intercalated disc

Echrak Hichri et al. J Physiol. .

Abstract

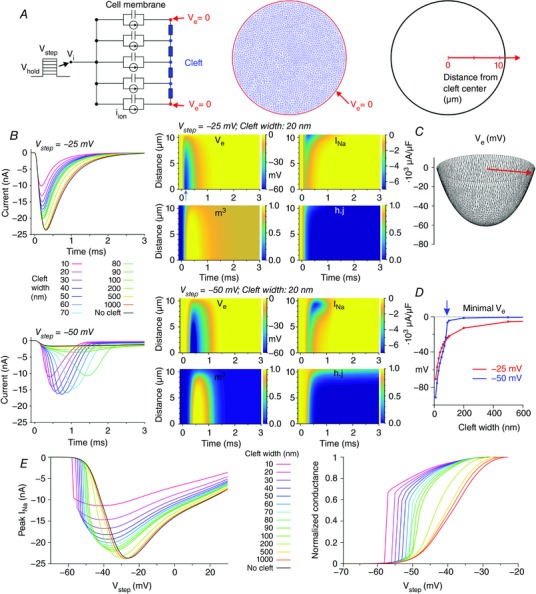
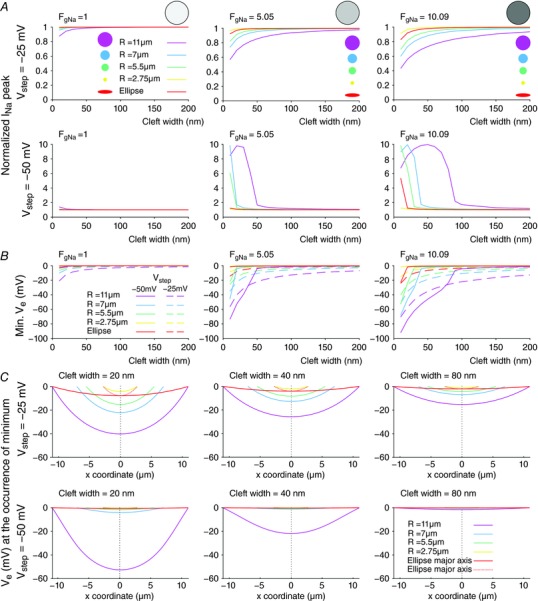
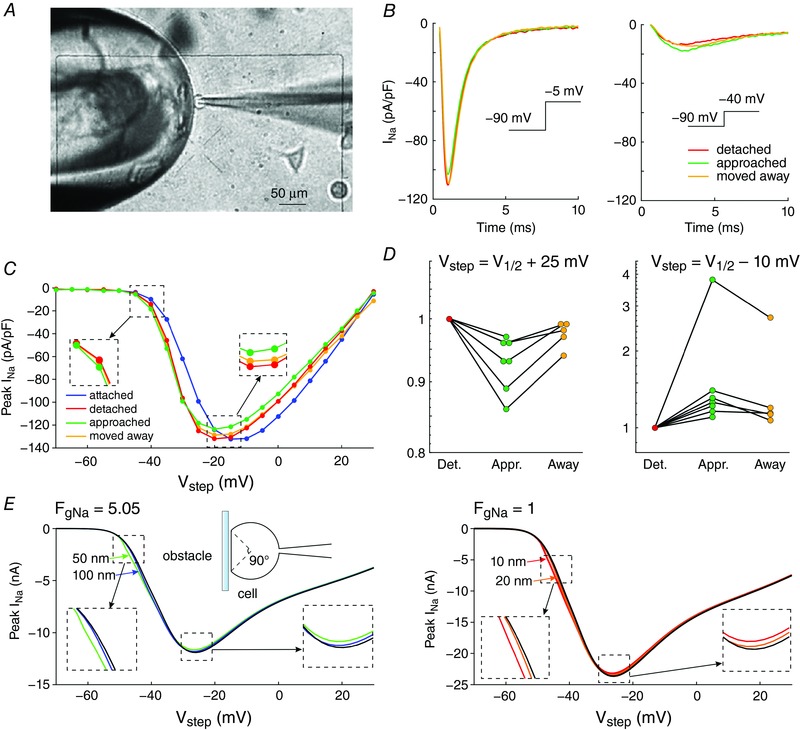
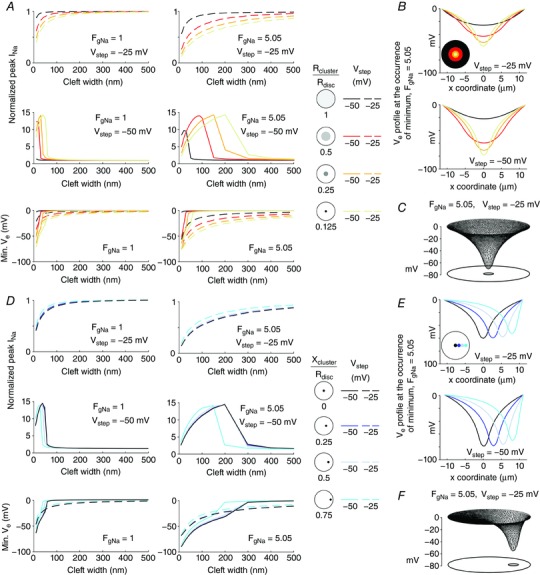
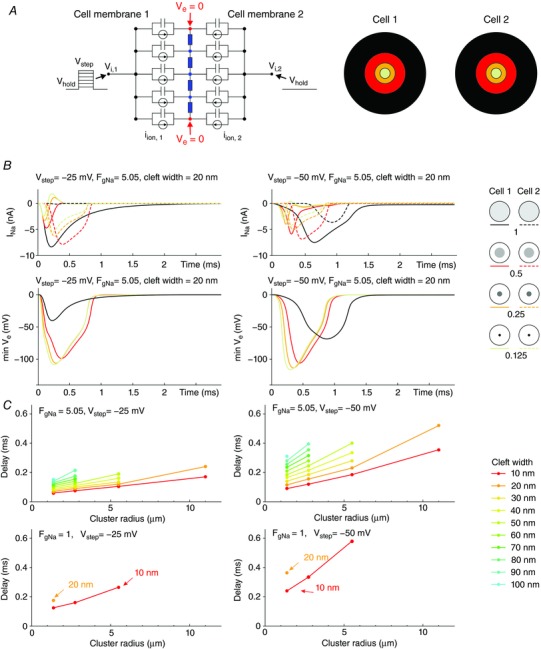
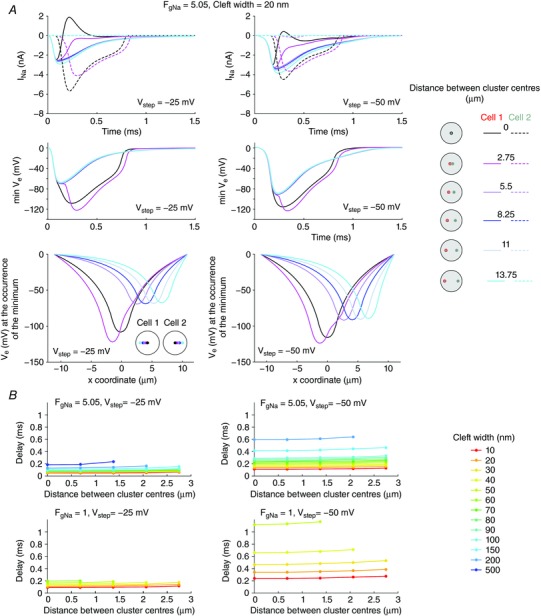
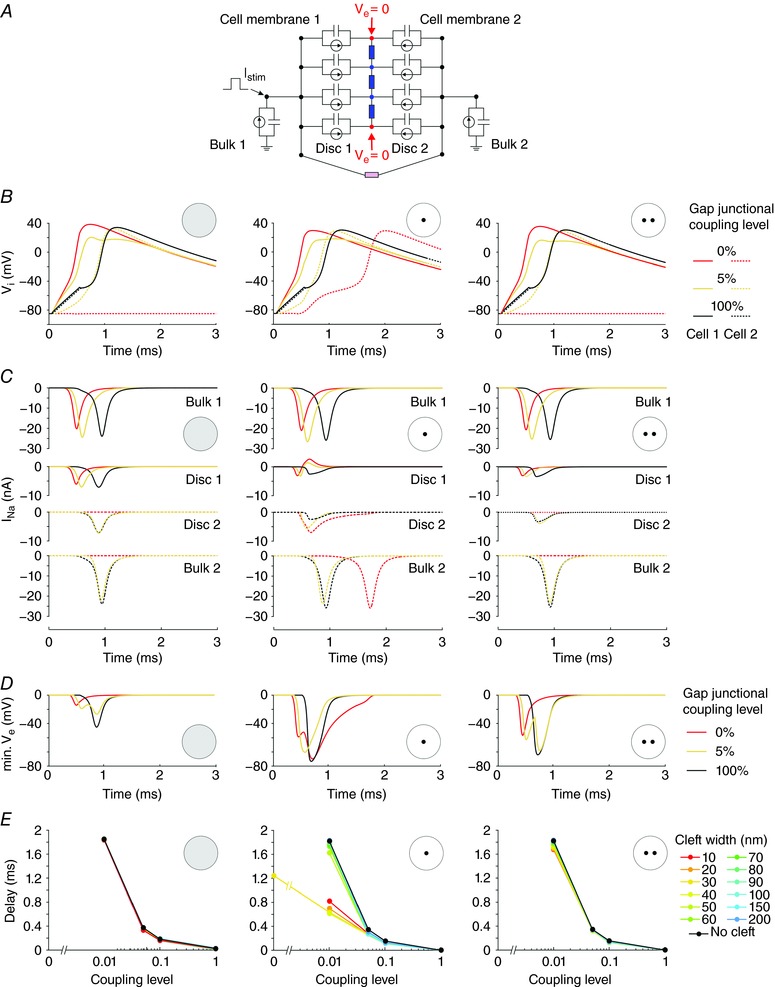
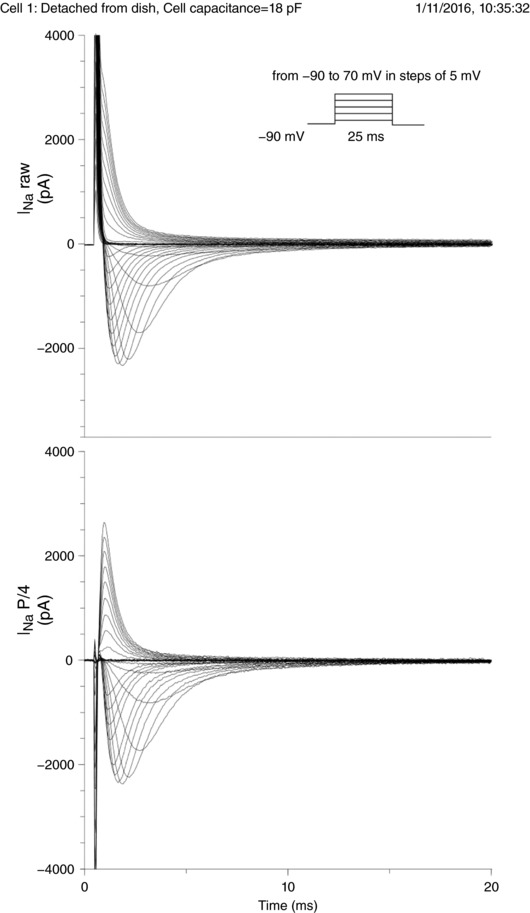
Key points: It has been proposed that ephaptic conduction, relying on interactions between the sodium (Na+ ) current and the extracellular potential in intercalated discs, might contribute to cardiac conduction when gap junctional coupling is reduced, but this mechanism is still controversial. In intercalated discs, Na+ channels form clusters near gap junction plaques, but the functional significance of these clusters has never been evaluated. In HEK cells expressing cardiac Na+ channels, we show that restricting the extracellular space modulates the Na+ current, as predicted by corresponding simulations accounting for ephaptic effects. In a high-resolution model of the intercalated disc, clusters of Na+ channels that face each other across the intercellular cleft facilitate ephaptic impulse transmission when gap junctional coupling is reduced. Thus, our simulations reveal a functional role for the clustering of Na+ channels in intercalated discs, and suggest that rearrangement of these clusters in disease may influence cardiac conduction.

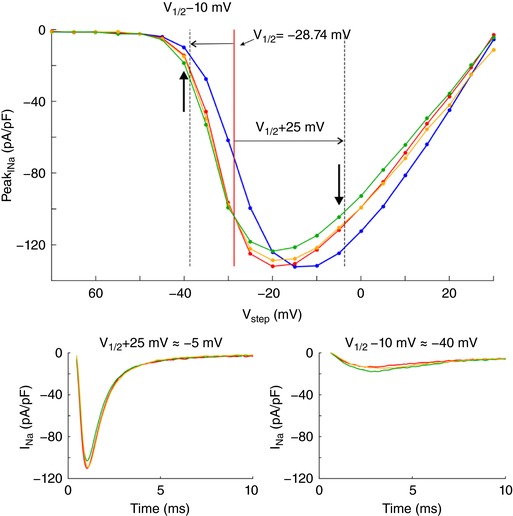
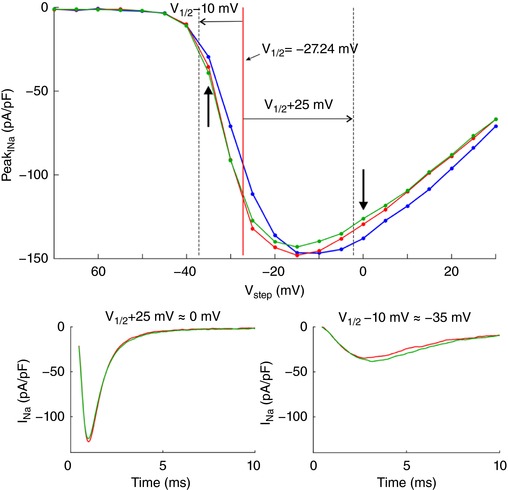
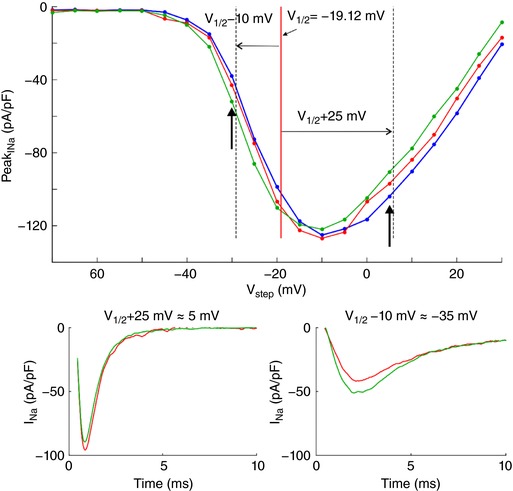
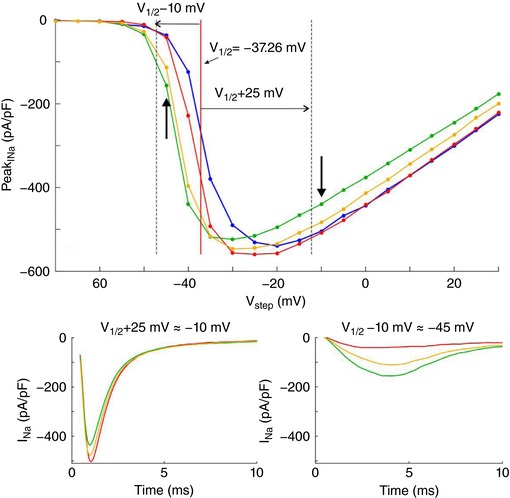
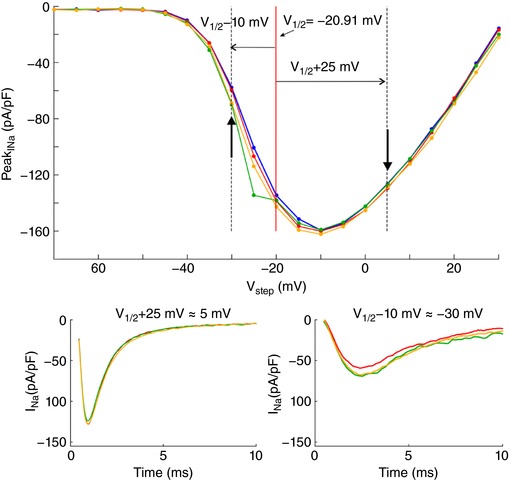
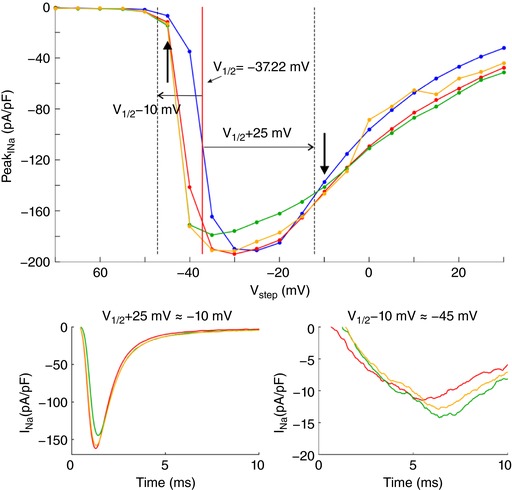
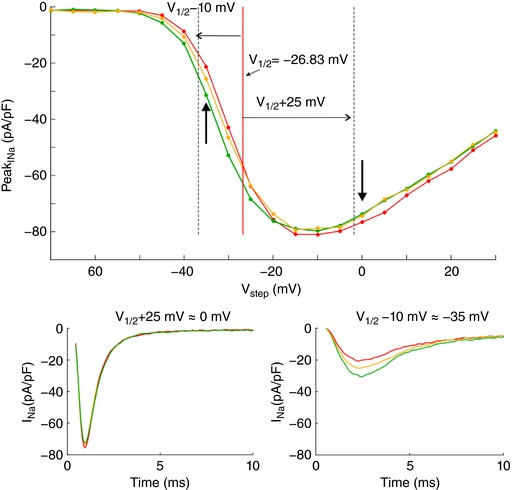
Abstract: It has been proposed that ephaptic interactions in intercalated discs, mediated by extracellular potentials, contribute to cardiac impulse propagation when gap junctional coupling is reduced. However, experiments demonstrating ephaptic effects on the cardiac Na+ current (INa ) are scarce. Furthermore, Na+ channels form clusters around gap junction plaques, but the electrophysiological significance of these clusters has never been investigated. In patch clamp experiments with HEK cells stably expressing human Nav 1.5 channels, we examined how restricting the extracellular space modulates INa elicited by an activation protocol. In parallel, we developed a high-resolution computer model of the intercalated disc to investigate how the distribution of Na+ channels influences ephaptic interactions. Approaching the HEK cells to a non-conducting obstacle always increased peak INa at step potentials near the threshold of INa activation and decreased peak INa at step potentials far above threshold (7 cells, P = 0.0156, Wilcoxon signed rank test). These effects were consistent with corresponding control simulations with a uniform Na+ channel distribution. In the intercalated disc computer model, redistributing the Na+ channels into a central cluster of the disc potentiated ephaptic effects. Moreover, ephaptic impulse transmission from one cell to another was facilitated by clusters of Na+ channels facing each other across the intercellular cleft when gap junctional coupling was reduced. In conclusion, our proof-of-principle experiments demonstrate that confining the extracellular space modulates cardiac INa , and our simulations reveal the functional role of the aggregation of Na+ channels in the perinexus. These findings highlight novel concepts in the physiology of cardiac excitation.

Keywords: action potential; cardiac electrophysiology; computer modelling; ephaptic coupling; intercalated disc; patch clamp; sodium channels; sodium current.


Figures

Figure 1
Figure 1. Dynamic interactions between I Na and V e in a disc‐shaped membrane (R disc = 11 μm) separated from a non‐conducting obstacle by an extracellular cleft (uniform distribution of g Na, Fg Na = 10.09)
A, schematic representation of the model (left: cross‐section; middle: finite element mesh) with membrane capacitance, ion currents and extracellular resistive properties (blue). V e at the rim of the disc was held at 0 (red). Due to radial symmetry (uniform Na+ channel distribution), the model behaviour does not depend on the azimuthal coordinate but only on the radial coordinate (right). B, left: total I Na during an activation step from −85 mV to −25 mV (top) and to −50 mV (bottom), for various cleft widths. B, middle: corresponding colour maps of V e, I Na, m 3 and hj as a function of time and distance from the centre, for a 20‐nm‐wide cleft. C, spatial profile of V e at the occurrence of the minimum (arrow in the middle panel of A) for V step = −25 mV and a cleft width of 20 nm. D, minimal V e registered in the cleft as a function of cleft width, for V step = −25 mV and −50 mV. Note the abrupt behaviour for V step = −50 mV (blue arrow). E, relationship between peak total I Na and V step for various cleft widths (left) and derived steady‐state activation curves (right).
Figure 2
Figure 2. Effects of cleft size, cleft geometry and Na+ channel density on peak I Na and V e for a membrane separated from a non‐conducting obstacle by an extracellular cleft (uniform distribution of g Na)
A, peak I Na (normalized by peak I Na in the absence of a cleft) as a function of cleft width for different disc‐shaped clefts (radii: see colour legend) and an elliptic cleft (semi‐major axis: 11 μm, semi‐minor axis: 2.75 μm), at V step = −25 mV (top) and −50 mV (bottom), for Fg Na = 1 (left), Fg Na = 5.05 (middle) and Fg Na = 10.09 (right). B, corresponding minimal V e (dashed lines: V step = −25 mV; continuous lines: V step = −50 mV). C, corresponding spatial profiles of V e along the cleft diameter (or major/minor axis) at the occurrence of the minimum, for Fg Na = 5.05, at V step = −25 mV (top) and −50 mV (bottom), and for cleft widths of 20 nm (left), 40 nm (middle) and 80 nm (right).
Figure 3
Figure 3. Experimental evidence of ephaptic effects in patch clamped HEK cells
A, phase‐contrast microphotograph of a patch clamped HEK cell (pipette visible on the right) detached from its growth substrate and approached to a non‐conducting glass obstacle (left). B, I Na recorded from the same cell during an activation step to −5 mV (far above threshold, left) and to −40 mV (near the activation threshold, right) under the following conditions; detached cell (red), cell approached to the obstacle (green) and cell subsequently moved away (yellow). C, I–V curves of the same cell under these three conditions as well as for the cell still attached to the growth substrate (blue). Insets illustrate the I–V curves near and far above the threshold. D, peak I Na recorded in cells (n = 7) approached to the obstacle and in cells subsequently moved away normalized by corresponding peak I Na in the detached cells before approaching them to the obstacle, for an activation step far above threshold (to V 1/2 = +25 mV, left) and near the activation threshold (to V 1/2 = −10 mV, right). Note the logarithmic scales. Lines connect measurements in the same cell. E, simulated I–V curves (V step increments of 1 mV) using an Fg Na of 5.05 and cleft widths of 50 and 100 nm (left) and an Fg Na of 1 and cleft widths of 10 and 20 nm (right), assuming that the contact with the obstacle is subtended by an angle of 90° from the cell centre (schematic). R disc = 11 μm. Insets illustrate the I–V curves near and far above the threshold.
Figure 4
Figure 4. Effects of Na+ channel clustering on ephaptic interactions in a disc‐shaped membrane (R disc = 11 μm) separated from a non‐conducting obstacle by an extracellular cleft
A, top and middle: peak I Na (normalized by peak I Na in the absence of a cleft) as a function of cleft width for V step = −25 mV (top) and −50 mV (middle). Data are shown for different Na+ channel cluster sizes (cluster radius 1× (control uniform distribution), 0.5×, 0.25× and 0.125× that of R disc, as shown on the right) with Fg Na = 1 (left) and Fg Na = 5.05 (right). A, bottom: corresponding minimal V e as a function of cleft width for V step = −25 mV (dashed lines) and V step = −50 mV (continuous lines) for Fg Na = 1 (left) and Fg Na = 5.05 (right). B, spatial V e profiles along the disc diameter (x‐coordinate) at the occurrence of the minimum (Fg Na = 5.05; cleft width: 40 nm), for different concentric Na+ channel cluster sizes (as in A), for V step = −25 mV (top) and −50 mV (bottom). C, mesh of V e at the occurrence of the minimum for a cleft width of 40 nm, a V step to 25 mV, and an Fg Na of 5.05, for a central cluster having a radius of 0.125·R disc. D, same as A, but for a Na+ channel cluster with a radius 0.125× that of the disc membrane positioned at increasing distances from the centre (ratio of the x‐coordinate of the cluster centre (x cluster) to R disc, legend on the right). E, same as B, but for different positions of a small cluster with a radius of 0.125·R disc (as in D). F, same as C, but for a cluster (radius: 0.125·R disc) shifted towards the periphery (x cluster: 0.75·R disc).
Figure 5
Figure 5. Effects of Na+ channel cluster size on I Na and V e in two membranes separated by a narrow cleft (R disc = 11 μm)
A, left: schematic of the two‐membrane model with membrane capacitance, ion currents and extracellular resistive properties. A, right: schematic of the two membranes, each containing a central cluster of a given radius (1x (control uniform distribution), 0.5×, 0.25× and 0.125× that of R disc). B, top: total I Na in membrane 1 (continuous lines) and membrane 2 (dashed lines) as a function of time, for different cluster radii (righthand legend) and a 20‐nm‐wide cleft, for a V step to −25 mV (left) and −50 mV (right). B, bottom: corresponding time courses of minimal V e for a V step to −25 mV (left) and −50 mV (right). Fg Na = 5.05. C, delay between the onset of total I Na in the two membranes as a function of cluster radius for different cleft widths (righthand legend), for a V step to −25 mV (left) and −50 mV (right) and Fg Na = 5.05 (top) and Fg Na = 1 (bottom).
Figure 6
Figure 6. Effects of relative Na+ channel cluster position on I Na and V e in two membranes separated by a narrow cleft (R disc = 11 μm)
A, top: total I Na in membrane 1 (continuous lines) and 2 (dashed lines) as a function of time for different relative positions of the clusters in the two membranes (see righthand legend; cluster radii: 1.375 μm; Fg Na = 5.05; cleft width: 20 nm), for a V step to −25 mV (left) and−50 mV (right). A, middle: corresponding time courses of minimal V e. A, bottom: corresponding spatial V e profiles along the disc diameter at the time of occurrence of the minimal V e. B, delay between the onset of total I Na in the two membranes as a function of the distance between the cluster centres, for different cleft widths (legend), for a V step to −25 mV (left) and −50 mV (right) and Fg Na = 5.05 (top) and Fg Na = 1 (bottom).
Figure 7
Figure 7. Interactions between ephaptic and gap junctional coupling between two cells
A, schematic representation of the 2‐cell model incorporating an intercalated disc (radius: 11 μm) and 2 disc membranes with membrane capacitance, ion currents and extracellular resistive properties (blue) and gap junctional resistance (pink). The discs were connected to elements representing the bulk membranes of the cells (100 μm long cylinders). The intracellular nodes were subjected to a current clamp protocol. The first cell was stimulated by a rectangular current pulse (duration: 0.5 ms; intensity: 11.5 nA). Fg Na = 5.05. Cleft width: 30 nm. B, intracellular potential as a function of time in cell 1 (continuous line) and cell 2 (dashed line) at different gap junctional coupling levels (100%, 5% and 0% of normal; righthand legend). Left: uniform Na+ channel distribution in both intercalated disc membranes. Middle: two aligned central Na+ channel clusters (R cluster = 1.375 μm). Right: two misaligned Na+ channel clusters (R cluster = 1.375 μm; distance between centres: 5.5 μm). C, corresponding I Na through the bulk membrane of cell 1 (first row), the disc membrane of cell 1 (second row), the disc membrane of cell 2 (third row) and the bulk membrane of cell 2 (fourth row). D, corresponding minimal V e. E, activation delay between the two cells as a function of gap junctional coupling level, for different cleft widths (legend) and for the three Na+ channel distributions.
Figure A1
Figure A1. Currents recorded during an activation protocol from one HEK293 cell expressing Nav1.5 channels detached from the growth substrate
Top: raw currents. Bottom: currents after P/4 processing. Holding potential: −90 mV; step potentials: from −90 to +70 mV in increments of 5 mV.
Figure A2
Figure A2
I–V curves and Na+ currents from cell 1.
Figure A3
Figure A3
I–V curves and Na+ currents from cell 2.
Figure A4
Figure A4
I–V curves and Na+ currents from cell 3.
Figure A5
Figure A5
I–V curves and Na+ currents from cell 4.
Figure A6
Figure A6
I–V curves and Na+ currents from cell 5.
Figure A7
Figure A7
I–V curves and Na+ currents from cell 6.
Figure A8
Figure A8
I–V curves and Na+ currents from cell 7.

References

    1. Asghari P, Scriven DR, Hoskins J, Fameli N, van Breemen C & Moore ED (2012). The structure and functioning of the couplon in the mammalian cardiomyocyte. Protoplasma 249(Suppl. 1), S31–38. - PubMed
    1. Beauchamp P, Choby C, Desplantez T, de Peyer K, Green K, Yamada KA, Weingart R, Saffitz JE & Kléber AG (2004). Electrical propagation in synthetic ventricular myocyte strands from germline connexin 43 knockout mice. Circ Res 95, 170–178. - PubMed
    1. Beyder A, Rae JL, Bernard C, Strege PR, Sachs F & Farrugia G (2010). Mechanosensitivity of Nav1.5, a voltage‐sensitive sodium channel. J Physiol 588, 4969–4985. - PMC - PubMed
    1. Beyder A, Strege PR, Reyes S, Bernard CE, Terzic A, Makielski J, Ackerman MJ & Farrugia G (2012). Ranolazine decreases mechanosensitivity of the voltage‐gated sodium ion channel Nav1.5: a novel mechanism of drug action. Circulation 125, 2698–2706. - PMC - PubMed
    1. Cohen SA (1996). Immunocytochemical localization of rH1 sodium channel in adult rat heart atria and ventricle. Presence in terminal intercalated disks. Circulation 94, 3083–3086. - PubMed

Publication types