Review
. 2017 Dec 6;17(12):2826.
doi: 10.3390/s17122826.

Luminescence-Based Optical Sensors Fabricated by Means of the Layer-by-Layer Nano-Assembly Technique

Affiliations
Review

Luminescence-Based Optical Sensors Fabricated by Means of the Layer-by-Layer Nano-Assembly Technique

Nerea De Acha et al. Sensors (Basel). .

Abstract

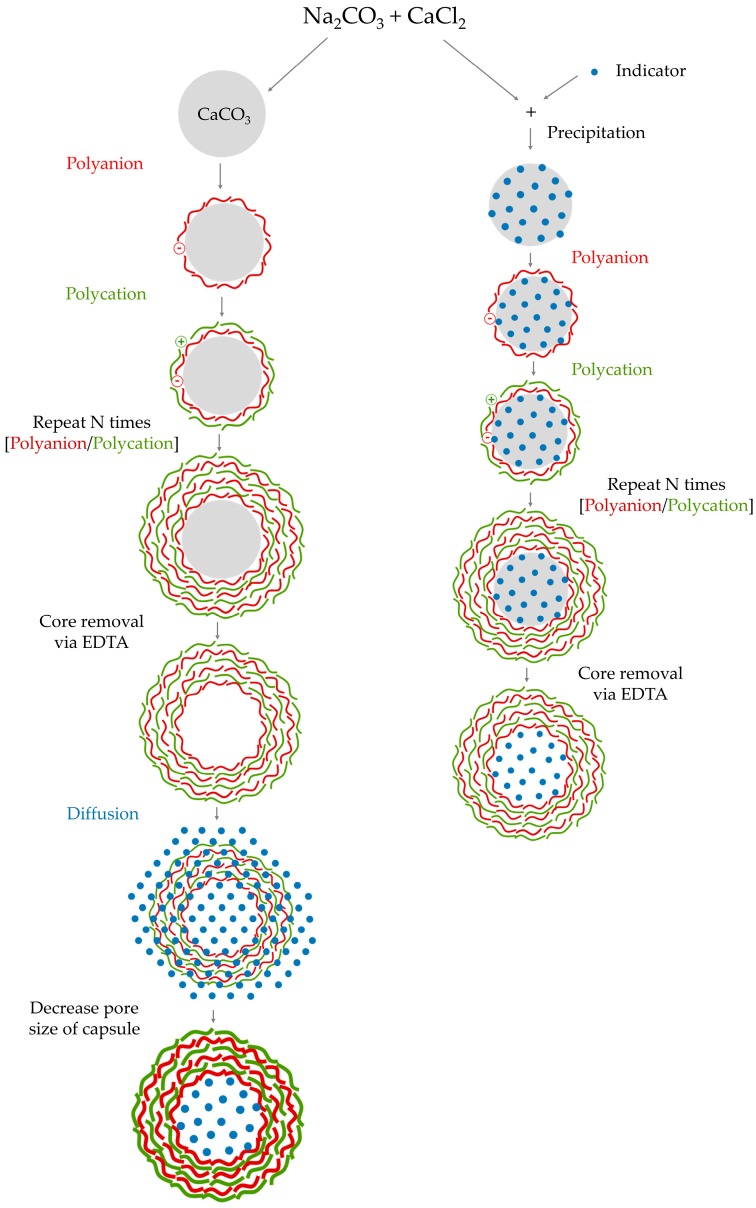
Luminescence-based sensing applications range from agriculture to biology, including medicine and environmental care, which indicates the importance of this technique as a detection tool. Luminescent optical sensors are required to be highly stable, sensitive, and selective, three crucial features that can be achieved by fabricating them by means of the layer-by-layer nano-assembly technique. This method permits us to tailor the sensors' properties at the nanometer scale, avoiding luminophore aggregation and, hence, self-quenching, promoting the diffusion of the target analytes, and building a barrier against the undesired molecules. These characteristics give rise to the fabrication of custom-made sensors for each particular application.

Keywords: chemical sensing; layer-by-layer nano-assembly technique; nanostructured materials; photoluminescence.


Conflict of interest statement

The authors declare no conflict of interest.

Figures

Figure 1
Figure 1
Schematic of the encapsulation techniques.
Figure 2
Figure 2
Effect of the different metal ions on the RE–QD composites: (a) Cu2+ and Ag+ ions change the color of the RE-QD composites into green and orange, respectively; (b) The ratio I(650)/I(542) of the RE-QD composites only decreases in presence of Cu2+ and Ag+. Reprinted from [83] with permission from Springer.
Figure 3
Figure 3
SEM image of the nano-capsules after the dilution of the core (upper left), schematic representation of the encapsulated sensors (lower left) and luminescence spectra of the sensors when exposed to high and low dissolved oxygen concentrations (right). Reprinted with permission from [58]. Copyright: 2014, American Chemical Society.
Figure 4
Figure 4
(a) Relative fluorescence intensity upon the addition of different glucose concentrations. F and F0 represent the fluorescence intensities in the presence (F) and absence (F0) of glucose; (b) calibration curve of the sensor. Reprinted from [87] with permission from Springer.
Figure 5
Figure 5
Сonfocal microscopy images of DHR123-labeled capsules containing lactate oxidase in the presence of 0.23 nM peroxidase and 4 mM lactate. Reprinted from [87] with permission from Springer.
Figure 6
Figure 6
Schematic fabrication luminescent films: the non-neutral indicator is directly assembled into the film (left pathway), the neutral indicator is mixed, covalently linked, or entrapped into a charged material and then it is assembled into the coating (central pathway), or the fabricated film is immersed into a solution of the dye (right pathway).
Figure 7
Figure 7
Stern−Volmer plots of multilayer films of PAH/PAA−HPTS as a function of different quencher concentrations. Reprinted with permission from [101]. Copyright © 2000, American Chemical Society.
Figure 8
Figure 8
(a) Fluorescence response of (PDDA/PFPNa)n structures upon addition of 0.1 μM Fe3+; (b) quenching of the fluorescent peak when the sensor (PDDA/PFPNa)1 is exposed to different Fe3+ concentrations. Reprinted with permission from [103]. Copyright: 2008, American Chemical Society.
Figure 9
Figure 9
(a) Luminescence spectra of the bi-color film under exposure to different Hg2+ concentrations: 0 μM, 0.01 μM, 0.05 μM, 0.1 μM, 0.2 μM, 0.5 μM, 0.6 μM, 0.75 μM, and 1 μM. The inset shows the Stern–Volmer plot of the sensor; (b) Colors of the sensing films under exposure to different Hg2+ concentrations: 0 μM, 0.01 μM, 0.1 μM, 0.5 μM, 1 μM, 1.5 μM, and higher than 100 μM. Reprinted from [107] with permission from Elsevier.
Figure 10
Figure 10
Steady-state fluorescence measurements over time (excitation 380 nm and emission 500 nm) of the dry optical fiber with six layers, followed by three cycles of Hg(II) aqueous solutions with the following concentrations: 0, 0.01, 0.05, 0.1, 0.799, 1.99, and 2.69 μM. (1) The fiber was immersed in water; (2) removed from water; and (3) immersed in Hg(II) 0.01 μM. Reprinted from [108] with permission from Elsevier.
Figure 11
Figure 11
Stern−Volmer plot for the quenching of CdSe PL by Cu2+. The solid red squares (□), black diamonds (⧫), and blue triangles (▲) denote the CdSe QDs enhanced by both Ag nanoprisms and photobrightening, the photobrightened QDs, and the unmodified QDs, respectively. Note: the blue and black lines are added as a guide using fits to a third-order polynomial. The red line is a linear fit to the data. Reprinted from [109] with permission from Elsevier.
Figure 12
Figure 12
(a) Luminescent intensity of the film before and after incubation in solution of different phenylalanine concentrations; and (b) the corresponding calibration curve. After incubation and exposition to UV light, singlet oxygen is produced, which reacts with ascorbate, producing H2O2, which quenches the luminescence; (c) Microscopic image of the interface between a part exposed to phenylalanine (right) and a part unexposed (left); (d) UV image of the phenylalanine-exposed part (left), where only the UV light (excitation) is visible, and the unexposed part (right), where the luminescence (534 nm, green) is observable. Reprinted from [112] with permission from the Korean Chemical Society.
Figure 13
Figure 13
Calibration curves of (PDDA/Pt-TFPPSDS)10 (Sensor A), (PEI/Pt-TFPPSDS)10 (Sensor B), and (PAH/Pt-TFPPSDS)10 (Sensor C). Stern–Volmer plots of Sensors A and B are adjusted on the left axis, whereas that of Sensor C is adjusted on the right axis. Reprinted from [49] with permission from Elsevier.
Figure 14
Figure 14
Stern–Volmer plots of the different sensors fabricated employing (a) PDDA, (b) PEI, and (c) PAH as cationic polyelectrolytes, and PAA as a spacer layer. In the cases of (a) PDDA and (b) PEI, the maximum of the sensitivity is achieved when luminescent layers are spaced by five layers of polyelectrolytes, whereas in the case of (c) PAH, only three layers of polyelectrolytes are necessary to achieve the maximum of the sensitivity. Reprinted from [48] with permission from Elsevier.
Figure 14
Figure 14
Stern–Volmer plots of the different sensors fabricated employing (a) PDDA, (b) PEI, and (c) PAH as cationic polyelectrolytes, and PAA as a spacer layer. In the cases of (a) PDDA and (b) PEI, the maximum of the sensitivity is achieved when luminescent layers are spaced by five layers of polyelectrolytes, whereas in the case of (c) PAH, only three layers of polyelectrolytes are necessary to achieve the maximum of the sensitivity. Reprinted from [48] with permission from Elsevier.
Figure 15
Figure 15
(A) Quenching of the luminescence peak centered at 630 nm of the multilayer structure (PAH/CdTe)12(PAH/PSS)3(PAH/GOD)3 when it is exposed to a 4 mM glucose solution at different temperatures. The time-dependent luminescence intensity of that peak during the first 9 min of the reaction for each temperature is shown in the inset. (B) Luminescence quenching of the same film for different glucose concentrations: (a) 2, (b) 4, (c) 6, (d) 8, (e) 12, (f) 16, (g) 20, and (h) 40 mM over 150 min; (C) quenching rate (Qm) of the sensor over 5 min as a function of the glucose concentration. F0 and Fm correspond to the luminescence intensity in the absence (F0) and presence (Fm) of glucose. All measurements were carried out in a 20 mM phosphate buffer at pH 7.4. Copyright: 2009, American Chemical Society.
Figure 15
Figure 15
(A) Quenching of the luminescence peak centered at 630 nm of the multilayer structure (PAH/CdTe)12(PAH/PSS)3(PAH/GOD)3 when it is exposed to a 4 mM glucose solution at different temperatures. The time-dependent luminescence intensity of that peak during the first 9 min of the reaction for each temperature is shown in the inset. (B) Luminescence quenching of the same film for different glucose concentrations: (a) 2, (b) 4, (c) 6, (d) 8, (e) 12, (f) 16, (g) 20, and (h) 40 mM over 150 min; (C) quenching rate (Qm) of the sensor over 5 min as a function of the glucose concentration. F0 and Fm correspond to the luminescence intensity in the absence (F0) and presence (Fm) of glucose. All measurements were carried out in a 20 mM phosphate buffer at pH 7.4. Copyright: 2009, American Chemical Society.
Figure 16
Figure 16
Luminescence quenching at 630 nm (λex = 380 nm) when different structures of (PAH/CdTe QDs)x(PAH/PSS)3(PAH/GOD)y were exposed to 4 mM glucose. All measurements were carried out at 37 °C in a 20 mM phosphate buffer at pH 7.4. Copyright: 2009, American Chemical Society.

References

    1. Sun C., Chen Y., Zhang G., Wang F., Liu G., Ding J. Multipoint Remote Methane Measurement System Based on Spectrum Absorption and Reflective TDM. IEEE Photonics Technol. Lett. 2016;28:2487–2490. doi: 10.1109/LPT.2016.2601625. - DOI
    1. Pasinszki T., Krebsz M., Tung T.T., Losic D. Carbon nanomaterial based biosensors for non-invasive detection of cancer and disease biomarkers for clinical diagnosis. Sensors. 2017;17:1919. doi: 10.3390/s17081919. - DOI - PMC - PubMed
    1. Tan C.H., Tan S.T., Lee H.B., Ginting R.T., Oleiwi H.F., Yap C.C., Jumali M.H.H., Yahaya M. Automated room temperature optical absorbance CO sensor based on In-doped ZnO nanorod. Sens. Actuators B Chem. 2017;248:140–152. doi: 10.1016/j.snb.2017.02.161. - DOI
    1. Del Villar I., Arregui F.J., Zamarreño C.R., Corres J.M., Bariain C., Goicoechea J., Elosua C., Hernaez M., Rivero P.J., Socorro A.B., et al. Optical sensors based on lossy-mode resonances. Sens. Actuators B Chem. 2017;240:174–185. doi: 10.1016/j.snb.2016.08.126. - DOI
    1. Qazi H.H., Bin Mohammad A.B., Akram M. Recent Progress in Optical Chemical Sensors. Sensors. 2012;12:16522–16556. doi: 10.3390/s121216522. - DOI - PMC - PubMed

LinkOut - more resources