. 2018 Jan 11;553(7687):228-232.
doi: 10.1038/nature25179. Epub 2017 Dec 6.

Selective silencing of euchromatic L1s revealed by genome-wide screens for L1 regulators

Affiliations

Selective silencing of euchromatic L1s revealed by genome-wide screens for L1 regulators

Nian Liu et al. Nature. .

Abstract

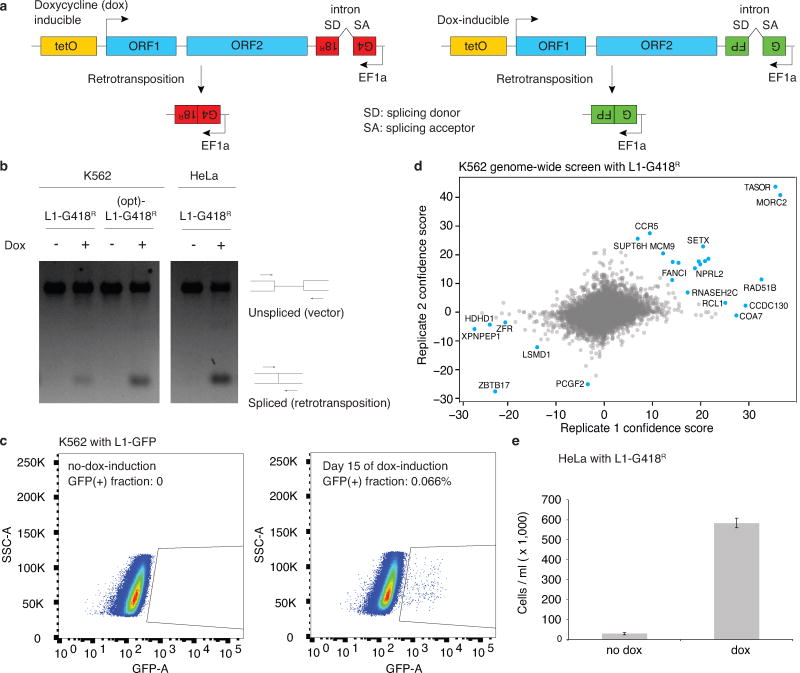
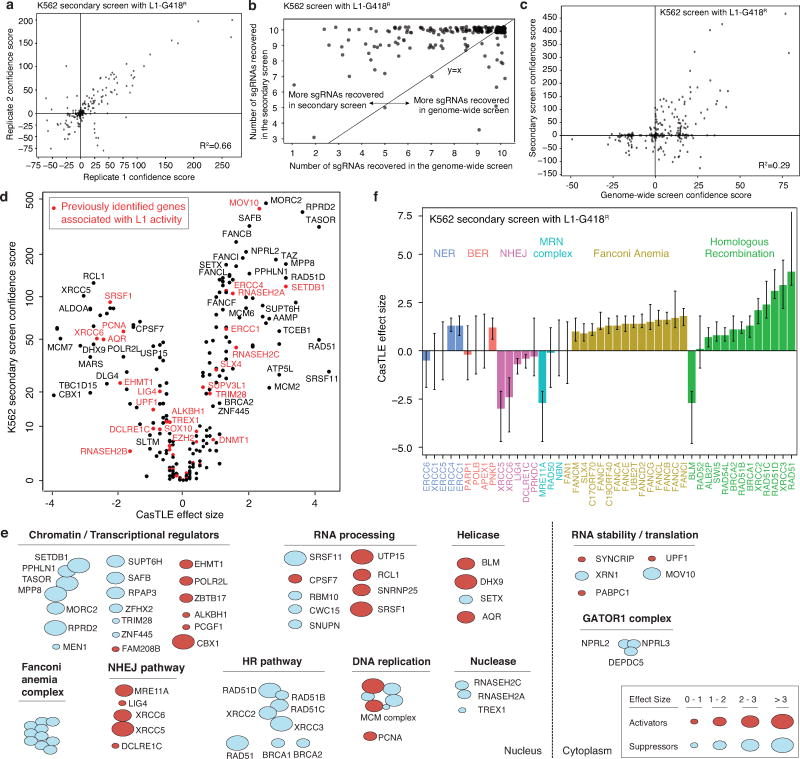
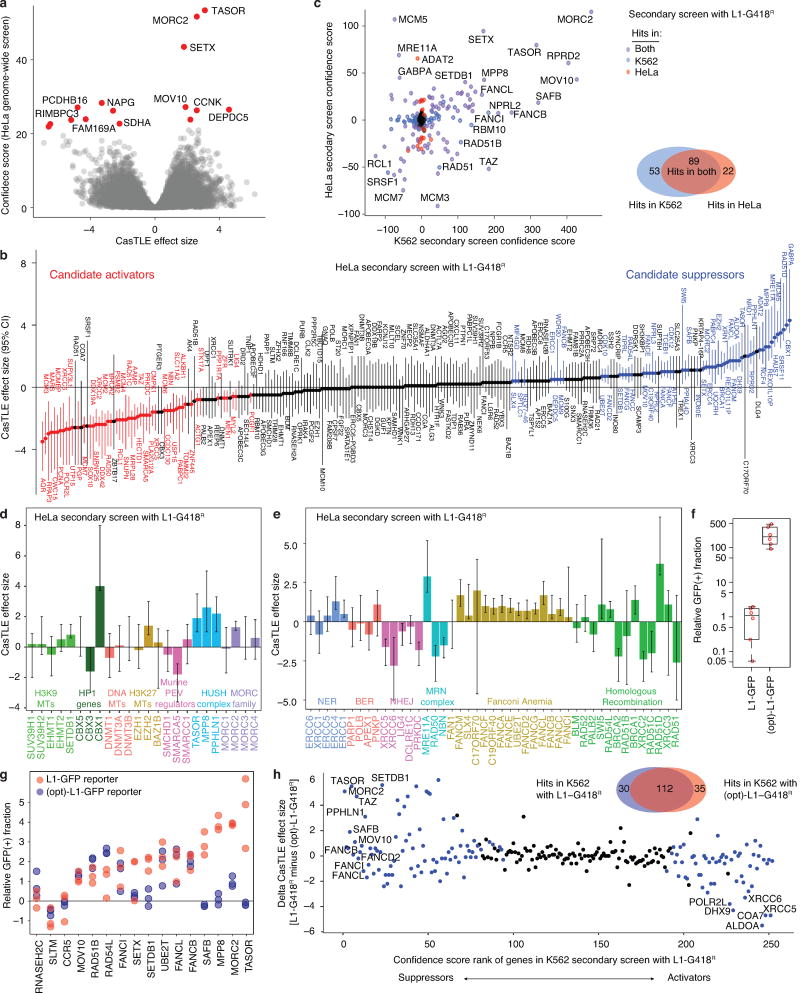
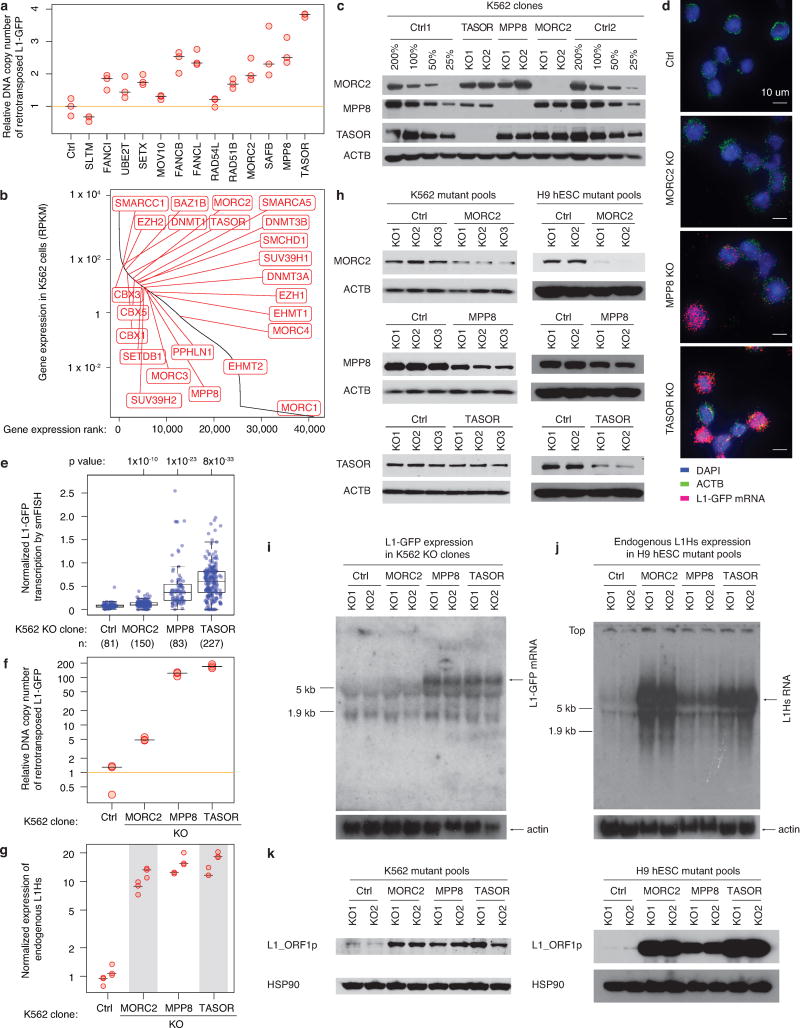
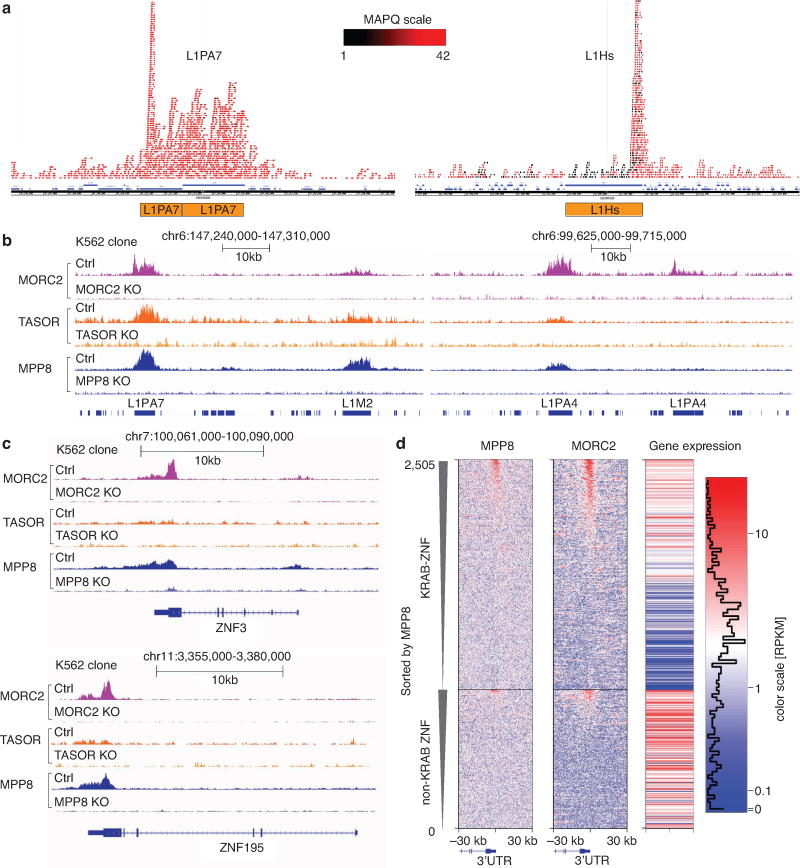
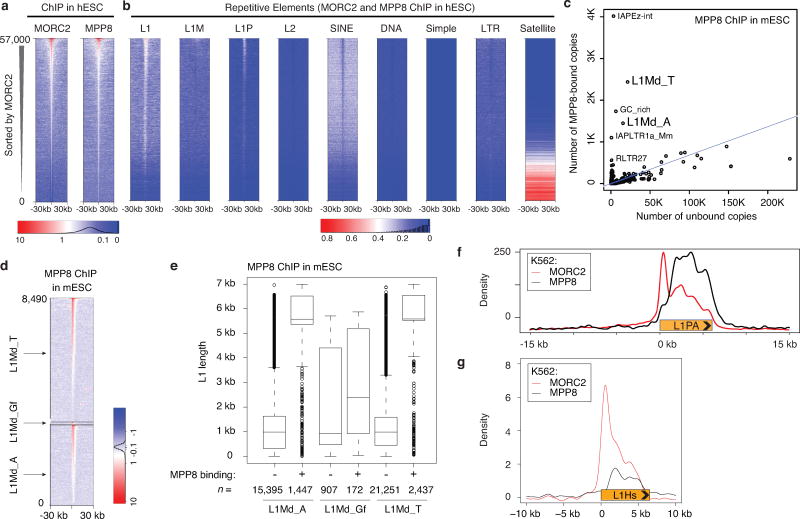
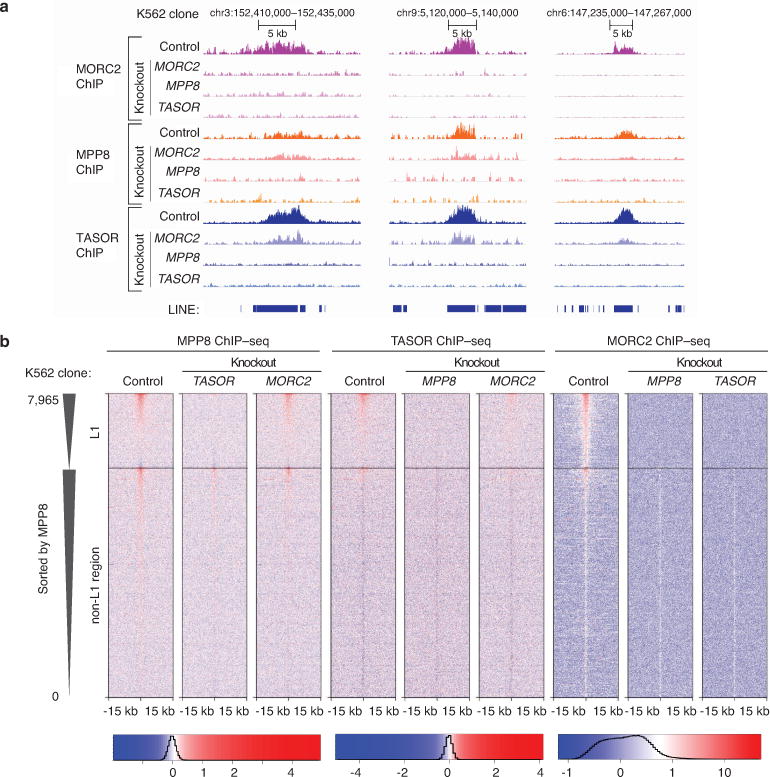
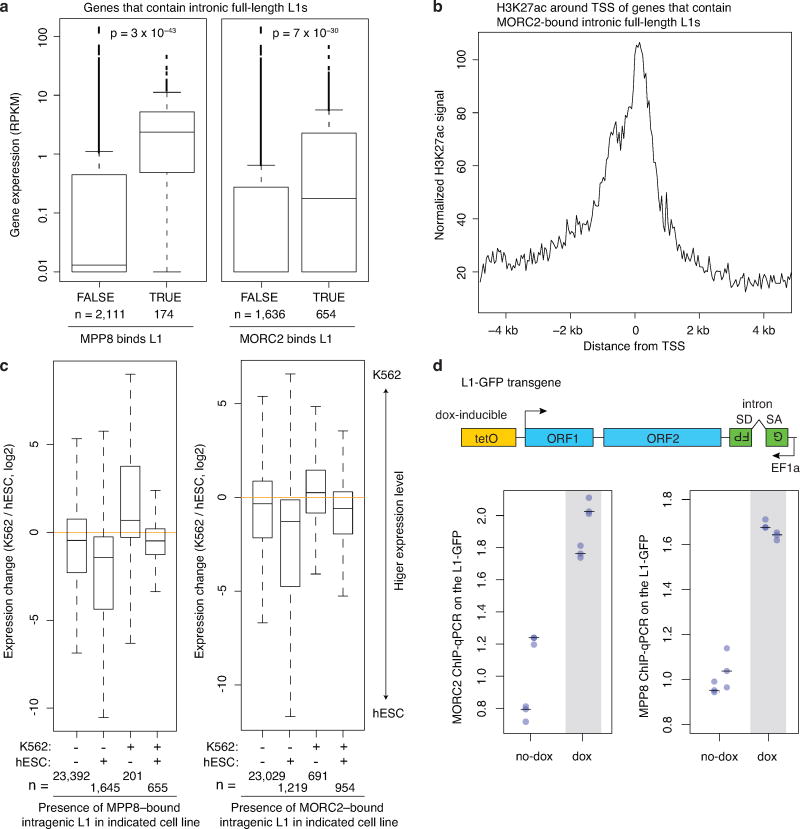
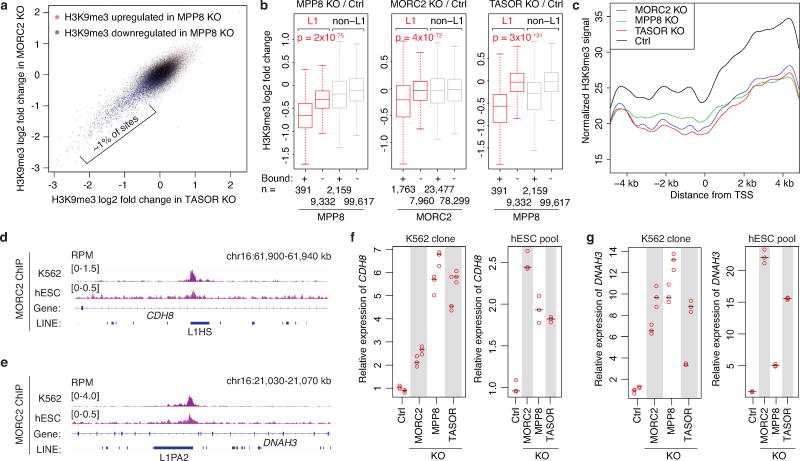
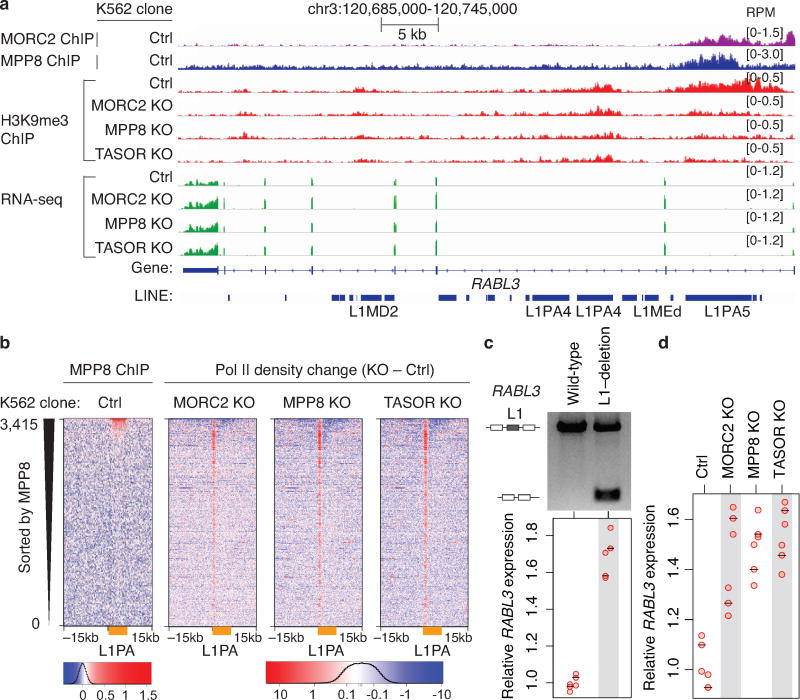
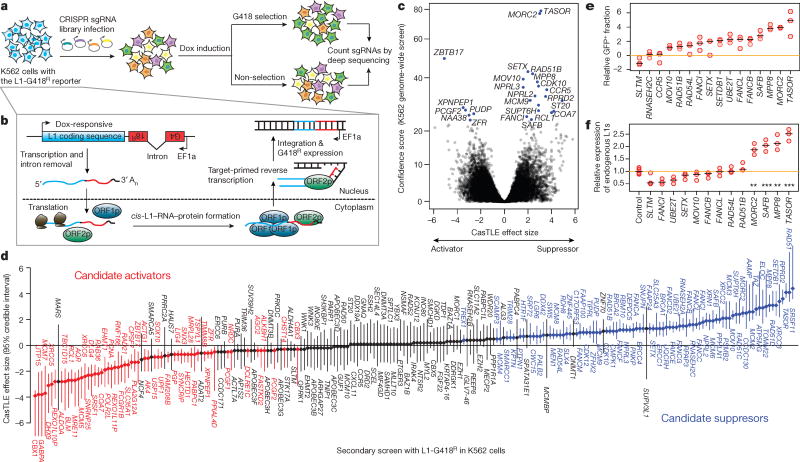
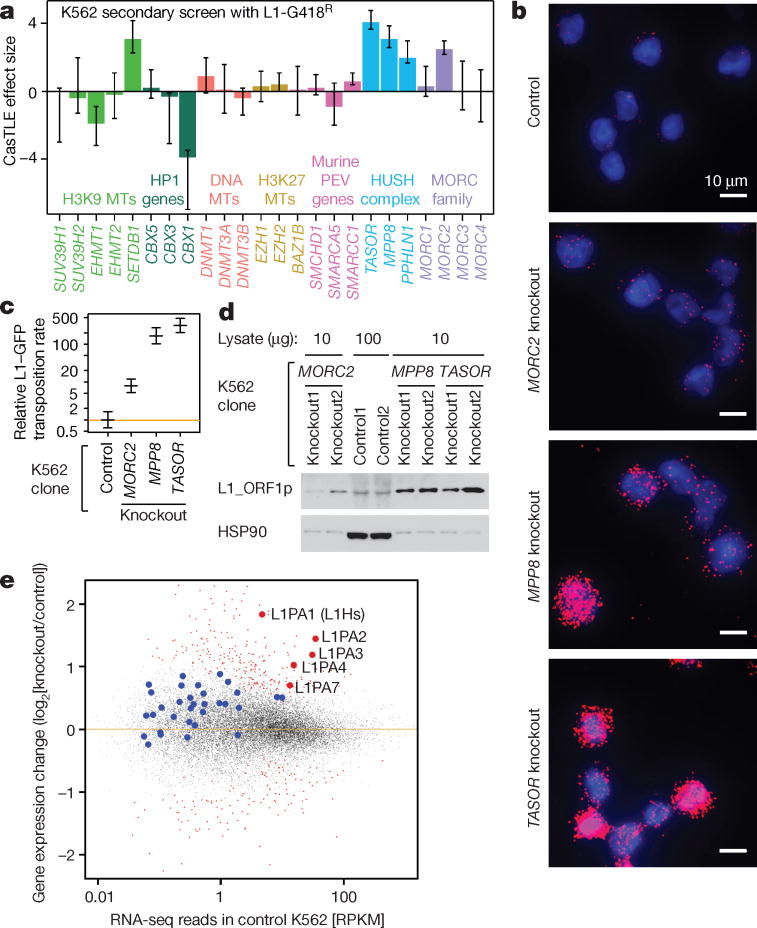
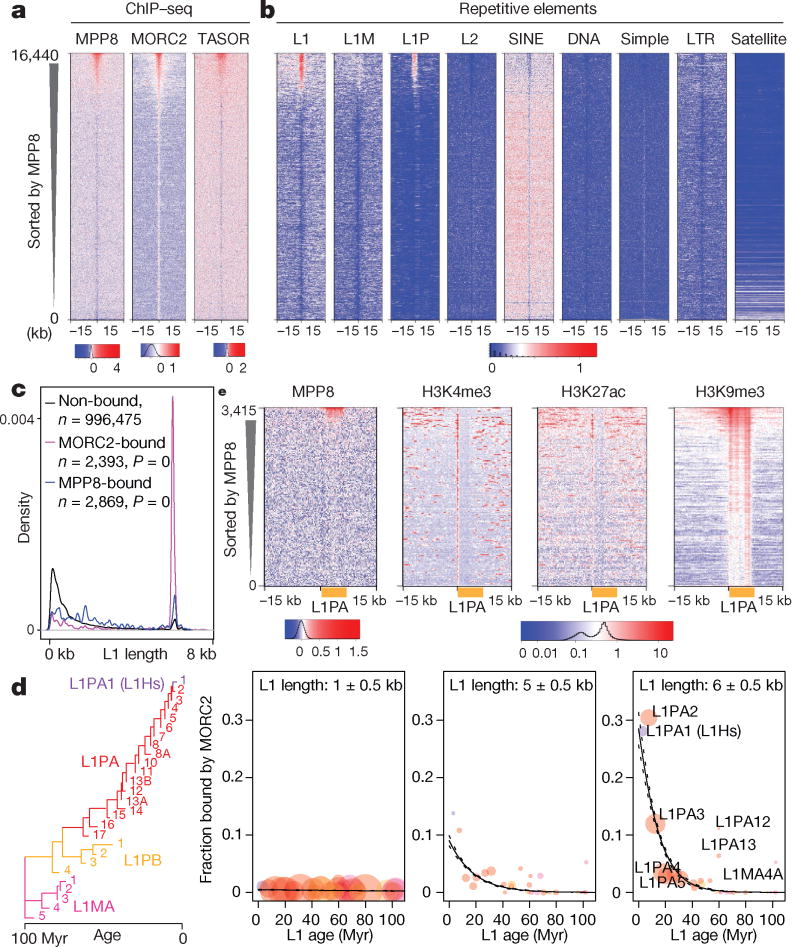
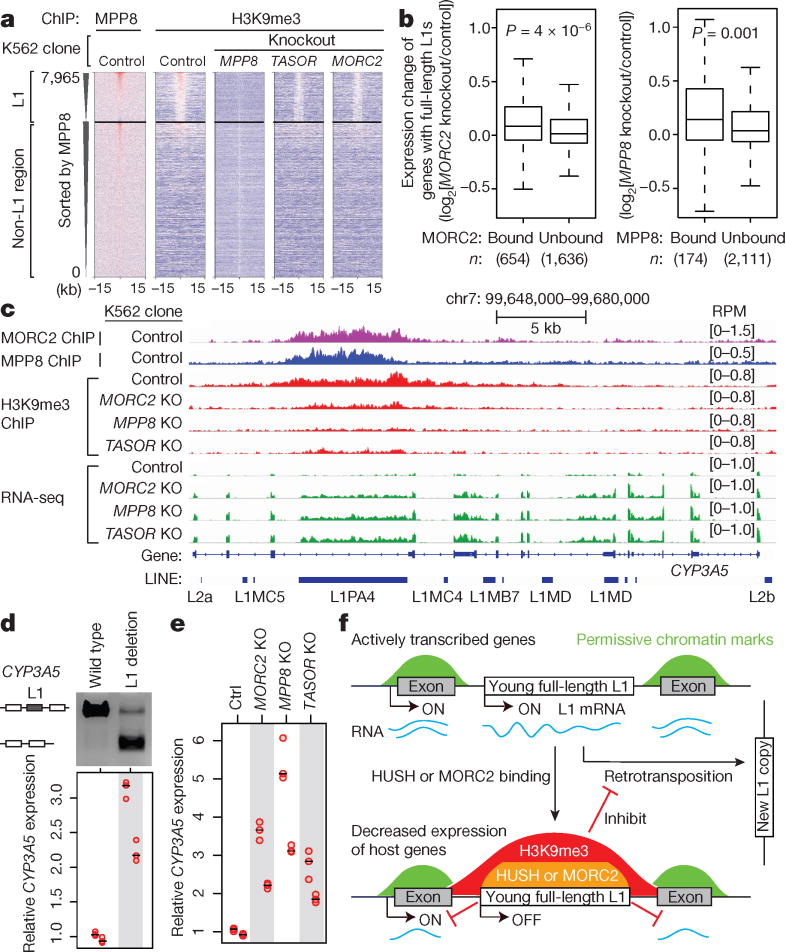
Transposable elements, also known as transposons, are now recognized not only as parasitic DNA, the spread of which in the genome must be controlled by the host, but also as major players in genome evolution and regulation. Long interspersed element-1 (LINE-1, also known as L1), the only currently autonomous mobile transposon in humans, occupies 17% of the genome and generates inter- and intra-individual genetic variation, in some cases resulting in disease. However, how L1 activity is controlled and the function of L1s in host gene regulation are not completely understood. Here we use CRISPR-Cas9 screening strategies in two distinct human cell lines to provide a genome-wide survey of genes involved in the control of L1 retrotransposition. We identify functionally diverse genes that either promote or restrict L1 retrotransposition. These genes, which are often associated with human diseases, control the L1 life cycle at the transcriptional or the post-transcriptional level in a manner that can depend on the endogenous L1 nucleotide sequence, underscoring the complexity of L1 regulation. We further investigate the restriction of L1 by the protein MORC2 and by the human silencing hub (HUSH) complex subunits MPP8 and TASOR. HUSH and MORC2 can selectively bind evolutionarily young, full-length L1s located within transcriptionally permissive euchromatic environments, and promote deposition of histone H3 Lys9 trimethylation (H3K9me3) for transcriptional silencing. Notably, these silencing events often occur within introns of transcriptionally active genes, and lead to the downregulation of host gene expression in a HUSH-, MORC2-, and L1-dependent manner. Together, these results provide a rich resource for studies of L1 retrotransposition, elucidate a novel L1 restriction pathway and illustrate how epigenetic silencing of transposable elements rewires host gene expression programs.


Conflict of interest statement

The authors declare no competing financial interests.

Figures

Extended Data Figure 1
Genome-wide CRISPR/Cas9 screen for L1 regulators in K562 cells. a. Schematic representation of L1-G418R and L1-GFP reporters used in this work. b. PCR assay on genomic DNA using primers that flank the engineered intron within the G418R cassette. Two experiments repeated independently with similar results. The spliced PCR bands were not observed prior to dox induction in either K562 or HeLa cells, suggesting that the L1-G418R reporter was not activated prior to the screening. However, there may exist extremely low level of reporter leakiness that is below the PCR assay detection limits. c. FACS results showing that the L1-GFP cells have no GFP signals without dox-induction (0 out of ~300,000 cells), and begin to produce GFP after dox-induction. Therefore, there is insignificant level of reporter leakiness without dox-induction. Two experiments repeated independently with similar results. d. CasTLE analysis of genome-wide screens in K562 cells, with 20,488 genes represented as individual points. Genes falling under 10% FDR colored in blue, CasTLE likelihood ratio test. n = 2 biologically independent screens. e. HeLa with L1-G418R are resistant to G418 after dox-induction. 7 days of dox-induction followed by 10 days of G418 selection. Live cells in equal volumes were counted in a single (n = 1) FACS experiment. Center value, total number of live cells. Error bar, square root of total events assuming Poisson distribution of counts.
Extended Data Figure 2
A secondary screen identifies functionally diverse L1 regulators in K562 cells. a. Reproducibility between two independent secondary screens (n = 2) in K562 cells. R-squared value, linear regression model. b. The K562 secondary screen recovers more sgRNAs than the K562 genome-wide screen, suggesting a higher detection sensitivity in the secondary screen. c. Comparison of the secondary screen data (252 genes from n = 2 independent screens) with the genome-wide screen data (n = 2 independent screens) in K562 cells. R-squared value, linear regression model. d. Volcano plot showing K562 secondary screen results (252 genes from two independent screens), with genes previously implicated in L1 biology colored in red. e. Classification diverse L1 activators and suppressors identified in K562 cells by their known biological process. f. The maximum effect size (center value) of indicated DNA repair genes, estimated by CasTLE from two independent K562 secondary screens with 10 different sgRNAs per gene. Error bars, 95% credible intervals of the estimated effect size.
Extended data Figure 3
Screen for L1 regulators in HeLa cells and and L1- sequence-dependent L1 regulators. a. CasTLE analysis of two independent genome-wide screens in HeLa cells, with 20,514 genes represented as individual points. Genes at 10% FDR cutoff colored in red, CasTLE likelihood ratio test. b. The maximum effect size (center value) estimated by CasTLE from two independent HeLa secondary screens with 10 different sgRNAs per gene. Bars, 95% credible interval (CI). L1 activators, red; L1 suppressors, blue. Genes whose CI include zero are colored in gray and are considered non-effective against L1. c. Scatter plots showing the secondary screen hits identified in K562 cells and HeLa cells (252 genes from two independent screens in each cell line), with Venn diagram comparing hits in the two cell lines is shown on the right. d. The maximum effect size (center value) of indicated heterochromatin regulators, estimated by CasTLE from two independent HeLa secondary screens with 10 different sgRNAs per gene. Error bars, 95% credible intervals of the estimated effect size. e. The maximum effect size (center value) of indicated DNA repair genes, estimated by CasTLE from two independent HeLa secondary screens with 10 different sgRNAs per gene. Error bars, 95% credible intervals of the estimated effect size. f. The (opt)-L1-GFP reporter retrotransposed more frequently than L1-GFP did in K562. The GFP(+) fraction of cells with the indicated L1 reporter after 15 days of dox induction was normalization to the L1-GFP sample. Box plots show median and interquartile range (IQR), whiskers are 1.5× IQR. n = 6 biologically independent replicates. g. The GFP(+) fraction of dox-induced Ctrl and mutant cell pools with the L1-GFP reporter or (opt)-L1-GFP reporter. Experiments were performed as Fig. 1e. Chromatin regulators (e.g. TASOR, MORC2, MPP8, SAFB) did not suppress the (opt)-L1-GFP reporter, in which 24% of the L1 ORF nucleotide sequence is altered, without changes in the encoded amino acid sequence,, indicating their L1 regulation depends on the native nucleotide-sequence of L1Hs. h. K562 secondary screen with the (opt)-L1-G418R reporter (252 genes from n = 2 independent screens) revealed genes that regulate retrotransposition dependent or nondependent on the native L1 nucleotide sequence. The K562 secondary screen candidates identified with L1-G418R (252 genes from n = 2 independent screens) were labeled in blue. A Venn diagram comparing hits identified from the two L1-reporters is also shown.
Extended Data Figure 4
MORC2, MPP8 and TASOR silence L1 transcription. a. Relative genomic copy number of newly integrated L1-GFP reporters in the indicated mutant K562 pools after dox-induction. PspGI-assisted qPCR assay used here was designed to selectively detect spliced GFP rather than the unspliced version (see Methods section). The L1-GFP copies were normalized to beta-actin DNAs; data then normalized to Ctrl. As a putative L1 activator, SLTM shows an opposite effect on the DNA copy number, compared with L1 suppressors. Center value as median. n = 3 technical replicates per gene. b. RNA-seq data in Ctrl K562 cells showing that most heterochromatin regulators in Fig. 2a are expressed, supporting the selective effect of HUSH and MORC2 in L1 regulation. c. Western blots validating the knockout (KO) effects in independent KO K562 cell clones. Ctrl samples were loaded at 4 different amounts (200%, 100%, 50%, 25% of KO clones). Three experiments repeated independently with similar results. To obtain KO clones, we sorted mutant K562 pools (cells used in Fig. 1e,f) into 96-well plates, expanded cells and screened for KO clones through western blotting. Of note, all K562 KO clones were derived from the same starting L1-GFP reporter line, and thus do not differ in reporter transgene integrations among the clones. d. Representative images of single molecule FISH (smFISH) assays targeting ACTB mRNAs and RNA transcripts from L1-GFP reporters in Ctrl and KO K562 clones after 5 days of dox-induction. No signal was observed from L1-GFP reporters without dox-induction (data not shown). Two experiments repeated independently with similar results. See also panel e and Fig. 2b (showing L1-GFP mRNA only). e. Quantitation of the L1-GFP transcription level from the indicated number of K562 cells, determined by smFISH assays (panel d and Fig. 2b). The number of L1-GFP mRNA transcripts is normalized to the number of beta-actin mRNAs within each K562 cell. Box plots show median and interquartile range (IQR), whiskers are 1.5× IQR. P-value, two-sided Wilcoxon test. 95% CI for median from 1,000× bootstrap: Control: 0.059-0.082; MORC2: 0.106-0.123; MPP8: 0.264-0.410; TASOR: 0.514-0.671. f. MORC2, MPP8, and TASOR KOs increase the genomic copy number of newly integrated L1-GFP reporters. PspGI-assisted qPCR assays were performed as in panel a), but using clonal KO K562 clones instead of mutant cell pools. Data normalized to Ctrl. n = 3 technical replicates, center value as median. g. MORC2 KO, MPP8 KO, and TASOR KO increase the expression of endogenous L1s. RT-qPCR experiments were performed as in (Fig. 1f), but using clonal KO K562 clones instead of mutant cell pools. n = 2 biological replicates × 3 technical replicates (center value as median). The primers do not target the L1-GFP reporter and the cell lines were not dox-induced, so these RT-qPCR assays will not detect L1-GFP transcripts. h. Western blots showing depletion effects of MORC2, MPP8 and TASOR in the mutant pools of K562 cells (left) and in the mutant pools of H9 hESCs without transgenic L1 reporters (right). Two experiments repeated independently with similar results. i. Northern blots showing increased transcription from the L1-GFP reporter in KO K562 clones (same cell lines as in panel c) after 5 days’ dox-induction. Two experiments repeated independently with similar results. As observed in Fig. 2b, while HUSH KO significantly increases L1-GFP transcription, MORC2 KO leads to only a modest increase. This is probably because the L1-GFP reporter does not contain the native L1 5’ UTR sequence, where MORC2 intensively binds (See Extended Data Fig. 7f,g). The 5 kb and 1.9 kb marks on the membrane refer to the 28S rRNA and 18S rRNA bands respectively. j. Northern blots showing that disruption of MORC2, MPP8 and TASOR increases the expression level of endogenous L1Hs in hESCs, same cell lines as in panel h). Size marker indicated as in panel i). Two experiments repeated independently with similar results. k. Western blots showing protein abundance of L1_ORF1p and HSP90 in the mutant pools of K562 cells and hESCs (same cell line as shown in panel h). Two experiments repeated independently with similar results. Experiments were performed without dox-induction of the transgenic L1 reporter. Due to the strong signal of bands from the KO samples, the blots were exposed for a very short time and the band signal in the Ctrl samples were relatively very weak compared to the KO samples; same case for panels i, j).
Extended Data Figure 5
The binding profiles of MORC2, MPP8 and TASOR revealed by ChIP-seq in K562 cells. a. Using a paired-end sequencing strategy for the ChIP-seq, together with the sequence divergence within native L1 elements, we could map ChIP-seq reads to individual L1 instances in the genome. Genome browser snapshots of MORC2 ChIP-seq reads alignment over L1PA7 (left) and L1Hs (right). Experiment was repeated once with similar results. Color scale indicates mapping quality score (MAPQ) for each read pair. MAPQ = 10 log10 p, where p is the probability that true alignment belongs elsewhere. With the exception of L1Hs, which is the youngest and least sequence divergent family, the bodies of L1 repeats are uniquely mappable. In case of L1Hs, the 5′UTR is still mappable to determine the level of L1Hs in Ctrl and KO clones. b. Genome browser snapshots for MPP8 (blue), TASOR (orange) and MORC2 (purple) ChIP-seq read densities from Ctrl and corresponding KO K562 clones at two representative example genomic loci. Experiment was repeated once with similar results. LINE element occurrences are indicated by blue rectangles at the bottom of the plot. Four instances of long L1 elements are named indicating L1 families they belong to. Note complete absence of ChIP-seq signal from KO lines and selectivity toward some but not other L1 instances. Of note, while MPP8 and MORC2 ChIP signals were robust, TASOR ChIPs showed relatively weak enrichments (either due to poor antibody quality or genuine biological properties); for this reason, a subset of our downstream analyses is focused on MORC2 and MPP8. c. In addition to full length L1, HUSH complex and MORC2 bind 3′UTRs of KRAB Zinc Finger (ZNF) genes. Genome browser snapshots of ChIP-seq read densities over representative examples, from both Ctrl and corresponding KO K562 clones. Experiment was repeated once with similar results. d. HUSH complex and MORC2 preferentially bind expressed KRAB-ZNF genes over other ZNF genes. Heatmaps of MPP8 (left) and MORC2 (center) signals over 2,600 ZNF genes, centered in the 3′ end of the genes and sorted first by the presence of KRAB domain and then by MPP8 ChIP signal. Upper 1,600 genes are KRAB-ZNF, lower 1,000 non-KRAB ZNF genes. Right heatmaps codes absolute expression level of each gene in RPKM scale from the K562 RNA-seq data (rightmost panel).
Extended Data Figure 6
HUSH and MORC2 collaborate at binding target L1s. a. Representative genome browser view of normalized ChIP-seq read densities over L1 elements. Experiment was repeated once with similar results. Loss of MPP8 and TASOR results in no detectable binding by MORC2, MPP8 and TASOR, while loss of MORC2 results in partially diminished recruitment of HUSH complex subunits. b. Heatmaps of MPP8 (left), TASOR (center) and MORC2 (right) ChIP-seq signals subtracted for ChIP signal from corresponding KO lines. Heatmaps are centered on MPP8 and MORC2 peaks, separated by the presence or absence of underlying L1 and then sorted by MPP8 ChIP signal strength. Loss of MORC2 has only partial effect on recruitment of MPP8 and TASOR to the L1 elements, while loss of either MPP8 or TASOR abrogates MORC2 recruitment.
Extended Data Figure 7
HUSH/MORC2 preferentially bind full-length L1 instances in human ESCs, mouse ESCs and K562 cells. a. Widespread genomic co-binding of MPP8 and MORC2 in hESCs. Heatmap representation of ChIP-seq results at 57,000 genomic loci, centered on MPP8 and MORC2 summits and sorted by MORC2 ChIP-seq signal. Plotted is normalized ChIP read density from hESCs. b. Heatmaps of MORC2/MPP8 ChIP-seq density over indicated repeat classes, centered and sorted as in panel a. HUSH complex and MORC2 bind predominantly to L1 elements in hESCs, in particular to the primate-specific L1P families, suggesting that HUSH/MORC2-dependent silencing is relevant in many embryonic and somatic cell types. c. L1 families that encompass active L1 copies, such as L1Md-T and L1Md-A, are significantly enriched among MPP8 binding sites in mouse ESC. L1Md_Gf is also enriched but not shown due to the low number of instances. Thus, HUSH-mediated L1 regulation appears to be conserved among species. Of note, MPP8 is also strongly enriched at IAP elements, a class of murine endogenous retroviruses that remain currently mobile in the mouse genome. d. MPP8 ChIP-seq heatmaps in mESCs featuring retrotransposition-competent L1Md-T, L1Md-A and L1Md-Gf. e. MPP8 preferentially bind full-length L1Md-A and L1Md-T in mESCs. Plotted is size distribution of the indicated L1 instances that overlap with MPP8 ChIP-seq peaks, or remaining L1s that do not overlap with such ChIP-seq signals. Box plots show median and interquartile range (IQR), whiskers are 1.5× IQR. f. Aggregate plots of MORC2 (red) and MPP8 (black) ChIP-seq signals over 500 full-length, MPP8-bound L1PAs, centered on the L1 5’ end. g. Aggregate plots of MORC2 (red) and MPP8 (black) ChIP-seq signals on L1Hs (L1PA1). Similar as the binding profile on L1PA (panel f), MPP8/MORC2 occupy the whole body of L1Hs, with MORC2 additionally binding L1Hs 5′UTR. Please note that ChIP-seq fragments are much less likely to be uniquely mapped, and thus removed by the alignment criteria, within the L1Hs non-5’UTR region, due to their minimal sequence divergence (Extended Data Fig. 5a).
Extended Data Figure 8
HUSH/MORC2 preferentially bind intronic L1s within actively transcribed genes. a. Genes that contain MPP8 or MORC2 bound intronic L1s are expressed at significantly higher levels in Ctrl K562 cells, compared to genes that contain intronic full-length L1s unbound by MPP8 or MORC2. p-value, two-sided Mann-Whitney-Wilcoxon test. Box plots show median and interquartile range (IQR), whiskers are 1.5× IQR. b. The promoters of genes that contain MPP8 or MORC2 bound intronic full-length L1s are marked by transcriptionally permissive H3K27ac in wild-type K562 cells. H3K27ac ChIP-seq data are taken from K562 epigenome pilot study, accession number PRJEB8620. TSS, transcription start site. c. Genes selectively occupied by MORC2/MPP8 either in K562 or in hESC cells exhibit higher gene expression in the corresponding cell line (p-values = 4.3 × 10−107 for MPP8 binding; p-values = 5.0 × 10−92 for MORC2 binding, Kruskal-Wallis test). Boxplots defined as in panel a. RNA-seq datasets for hESC are from SRA entries SRR2043329 and SRR2043330. d. ChIP-qPCR assays quantifying HUSH/MORC2 binding to an inducible L1 transgene in K562 cells before or after its transcriptional induction via Dox. Transcriptional induction increases binding of MORC2 and MPP8 to the L1 transgene. n = 2 biological replicates × 3 technical replicates (center value as median).
Extended Data Figure 9
HUSH/MORC2 facilitate H3K9me3 at their L1 targets for transcription repression. a. Concordant subset (~1%) of (n = 111,499) H3K9me3 sites in the genome lose H3K9me3 signal in MORC2 KO, MPP8 KO and TASOR KO K562 clones. Two independent lines each for WT, MORC2KO, TASOR KO, MPP8 KO. Plotted is log2 fold change in H3K9me3 ChIP signal in TASOR KO relative to Ctrl (x-axis) and log2 fold change in H3K9me3 ChIP signal in MORC2 KO relative to Ctrl (y-axis). Points are color coded with blue sites having significant H3K9me3 loss in MPP8 KO, red sites significantly gaining the signal in MPP8 KO, while gray have no detectable change. Sites that significantly lose H3K9me3 signal in KO line are more likely to have corresponding loss in other KO lines. Odds ratios: 26.23 with 95% confidence intervals (CI) [23,66, 29.10] for MORC2 versus MPP8; 21.70 with 95% CI [19.75, 23.83] for TASOR versus MPP8; 122.53 with 95% CI [109.21, 137.43] for TASOR versus MORC2. P = 0 each case, two-sided Fisher’s exact test. b. Genomic sites that exhibit the strongest loss of H3K9me3 in MORC2, MPP8 or TASOR KOs are preferentially L1 occupied by these factors. Boxplots of log2 fold change in H3K9me3 relative to Ctrl for MPP8 KO (left), MORC2 KO (center) and TASOR KO (right). Box plots show median and interquartile range (IQR), whiskers are 1.5× IQR. MPP8 and MORC2 bound L1s show significant loss of H3K9me3 (p-values, two-sided Mann-Whitney-Wilcoxon test). c. Averaged distribution of H3K9me3 ChIP-seq signals in Ctrl and KO K562 clones over the host genes that contain the MORC2-targeted intronic full-length L1s, centered on the transcription start site (TSS) of the host genes. d. Genome browser showing MORC2 binding at the intronic full-length L1Hs within CDH8 in both K562 and hESCs. Experiment was repeated once with similar results. e. Genome browser showing MORC2 binding at the intronic full-length L1PA2 within DNAH3 in both K562 and hESCs. Experiment was repeated once with similar results. f. Depletion of MORC2/HUSH increases the expression of CDH8 in both K562 (n = 2 biological replicates × 3 technical replicates) and hESCs (n = 3 technical replicates), as measured by RT-qPCR assay. The CDH8 expression level was normalized to beta-actin mRNA. All samples were then normalized to Ctrl sample. Center value as median. g. Depletion of MORC2/HUSH increases the expression of DNAH3 in both K562 (n = 2 biological replicates × 3 technical replicates) and hESCs (n = 3 technical replicates), as measured by RT-qPCR assay. The DNAH3 expression level was normalized to beta-actin mRNA. All samples were then normalized to Ctrl sample. Center value as median.
Extended Data Figure 10
HUSH/MORC2 binding at intronic L1s results in the decreased expression of active host genes. a. Genome browser tracks illustrating loss of HUSH/MORC2 causing decreased H3K9me3 over the intronic L1PA5 element and concomitant increase in the expression of host gene RABL3. Experiment was repeated once with similar results. b. Loss of HUSH/MORC2 leads to increased Pol II signals at 5’UTR and decreased Pol II signals within L1 bodies at HUSH-bound L1PA elements (orange bars). Heatmaps show Pol II density change in KO K562 clones compared to Ctrl, centered on the L1 5’ end and sorted by MPP8 ChIP signal. c. Deletion of the intronic L1 within RABL3 causes increased RABL3 expression. Upper panel: an agarose gel analysis of the PCR assay with primers flanking the HUSH/MORC2-bound intronic L1; two experiments repeated independently with similar results. Lower panel: RT-qPCR analysis of RABL3 expression. The RABL3 expression level was normalized to beta-actin mRNA. All samples were then normalized to wild-type sample. n = 2 biological replicates × 3 technical replicates (center value as median). d. Depletion of MORC2, MPP8, TASOR increases RABL3 expression. RT-qPCR data normalized as in panel c). n = 2 biological replicates × 3 technical replicates (center value as median).
Figure 1
Figure 1
Genome-wide screen for L1 activators and suppressors in K562 cells. a. Schematic for the screen. b. Schematic for the L1-G418R retrotransposition. c. CasTLE analysis of (n = 2) independent K562 genome-wide screens. Genes at 10% FDR cutoff colored in blue, CasTLE likelihood ratio test. d. The maximum effect size (center value) estimated by CasTLE from two independent K562 secondary screens with 10 independent sgRNAs per gene. Bars, 95% credible interval (CI). L1 activators, red; L1 suppressors, blue; insignificant genes whose CI include 0, gray. e. L1-GFP retrotransposition in control (infected with negative control sgRNAs, hereinafter referred to as ‘Ctrl’) and mutant K562 cells as indicated. GFP(+) cell fractions normalized to Ctrl. Center value as median. n = 3 biological replicates per gene. f. RT-qPCR measuring endogenous L1Hs expression in mutant K562 cells, normalized to Ctrl. Center value as median. n = 3 technical replicates per gene. **P < 0.01; ***P < 0.001; two-sided Welch t-test.
Figure 2
Figure 2
HUSH and MORC2 silence L1 transcription to inhibit retrotransposition. a. The maximum effect size (center value) of indicated heterochromatin regulators, estimated by CasTLE from two independent K562 secondary screens with 10 independent sgRNAs per gene. Error bars, 95% credible intervals. b. Visualization of L1-GFP mRNAs in dox-induced K562 clones, from single smFISH experiment that was independently repeated twice with similar results. See also Extended Data Fig. 4d,e. c. L1-GFP retrotransposition rate (center value) in K562 clones, from logistic regression fit of the GFP(+) cell counts at 7 time points (0, 5, 10, 15, 20, 25, 30 days post-induction) and two independent clones per gene. Over 200 GFP(+) cells per cell count. Data normalized to Ctrl. Bar, 95% credible interval. d. Endogenous L1_ORF1p level in K562 clones by western blots, HSP90 as loading control. Three experiments repeated independently with similar results. e. RNA-seq read counts from MORC2 KO, MPP8 KO and TASOR KO K562 clones, compared to Ctrl RNA-seq reads. n = 6 + 2 biologically independent RNA-seq experiments). Dots represent transcripts; large dots represent L1 transcripts. Red, significant changes (padj < 0.1, DESeq analysis); blue and gray, insignificant changes.
Figure 3
Figure 3
HUSH/MORC2 target young full-length L1s in euchromatic environment. a. Heatmaps showing signal enrichment of ChIPs with indicated antibodies in K562 cells, sorted by MPP8 ChIP signal and centered on MPP8 and MORC2 peaks. Plotted is normalized ChIP signal (Ctrl subtracted with corresponding KO). b. Heatmaps showing MPP8 and MORC2 ChIP signal enrichment over repetitive elements, centered and sorted as in (a). c. Size distribution of the L1s bound or unbound by MORC2 or MPP8 in K562 cells. P-values, two-tailed Kolmogorov-Smirnov test. d. Fraction of MORC2–bound L1s (center values) as function of L1 length (three size classes are presented) and age (predicted from the phylogenetic analysis) in K562 cells. Colored circles represent L1 families, with areas proportional to count of L1 instances with indicated age and length. n = 1,501 MORC2–bound L1 + 200,160 unbound L1. p = 2.2 × 10−90 for age–length interaction term, lower for simple terms (ANOVA, χ2 test), plotted logistic regression lines with 95% credible interval. e. Heatmaps showing signal enrichment of ChIPs with indicated antibodies in K562 cells, centered on the 5’ end of full-length L1PAs.
Figure 4
Figure 4
HUSH/MORC2 binding at L1s decreases active host gene expression. a. Heatmaps showing MPP8 and H3K9me3 ChIP signal enrichment, centered on MPP8 and MORC2 summits and separated by L1 presence or absence. b. Expression change of genes with intronic full-length L1s that are bound or unbound by MORC2 or MPP8 (RNA-seq reads from KO K562 clones compared to Ctrl). Box plots show median and interquartile range (IQR), whiskers are 1.5× IQR. p-value, two-sided Mann-Whitney-Wilcoxon test. c. Genome browser tracks: HUSH/MORC2 loss causing H3K9me3 decrease at the target L1 and expression increase at both the target L1 and its host gene, independently repeated once with similar results. d. Deleting the target intronic L1 from CYP3A5 in K562 increases CYP3A5 expression, by RT-qPCR normalized to wild-type sample. n = 2 biological replicates × 3 technical replicates (center value as median). Gel image confirms L1 deletion; two experiments repeated independently with similar results. e. RT-qPCR for CYP3A5 expression in K562 clones, normalized to Ctrl. n = 2 biological replicates × 3 technical replicates (center value as median). f. Model: HUSH/MORC2 bind young full-length L1s within transcriptionally active genes, and promote H3K9me3 deposition at target L1s to silence L1 transcription. This pathway not only inhibits L1 retrotransposition, but also decreases host gene expression.

References

    1. Lander ES, et al. Initial sequencing and analysis of the human genome. Nature. 2001;409:860–921. - PubMed
    1. Levin HL, Moran JV. Dynamic interactions between transposable elements and their hosts. Nat Rev Genet. 2011;12:615–627. - PMC - PubMed
    1. Beck CR, Garcia-Perez JL, Badge RM, Moran JV. LINE-1 Elements in Structural Variation and Disease. Annu Rev Genomics Hum Genet. 2011;12:187–215. - PMC - PubMed
    1. Mita P, Boeke JD. How retrotransposons shape genome regulation. Curr Opin Genet Dev. 2016;37:90–100. - PMC - PubMed
    1. Goodier JL. Restricting retrotransposons: a review. Mob DNA. 2016;7:16. - PMC - PubMed

Publication types