. 2017 Dec 14;552(7684):253-257.
doi: 10.1038/nature24993. Epub 2017 Dec 6.

Runx3 programs CD8+ T cell residency in non-lymphoid tissues and tumours

Affiliations

Runx3 programs CD8+ T cell residency in non-lymphoid tissues and tumours

J Justin Milner et al. Nature. .

Erratum in

Abstract

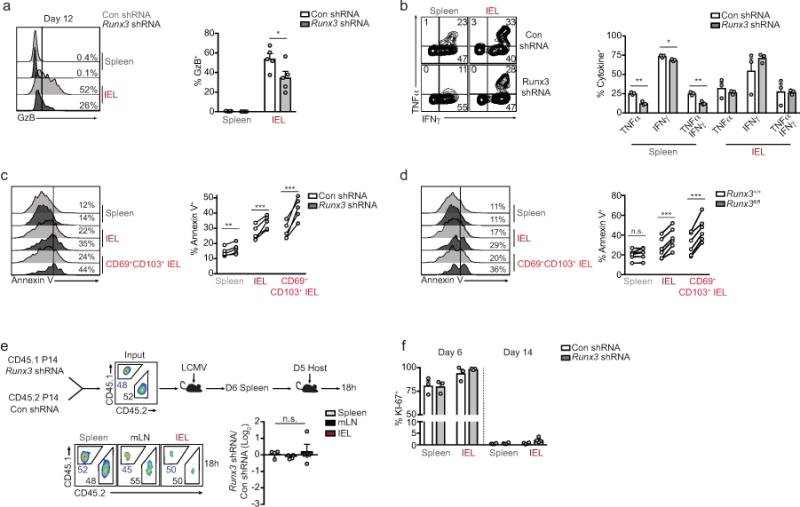
Tissue-resident memory CD8+ T (TRM) cells are found at common sites of pathogen exposure, where they elicit rapid and robust protective immune responses. However, the molecular signals that control TRM cell differentiation and homeostasis are not fully understood. Here we show that mouse TRM precursor cells represent a unique CD8+ T cell subset that is distinct from the precursors of circulating memory cell populations at the levels of gene expression and chromatin accessibility. Using computational and pooled in vivo RNA interference screens, we identify the transcription factor Runx3 as a key regulator of TRM cell differentiation and homeostasis. Runx3 was required to establish TRM cell populations in diverse tissue environments, and supported the expression of crucial tissue-residency genes while suppressing genes associated with tissue egress and recirculation. Furthermore, we show that human and mouse tumour-infiltrating lymphocytes share a core tissue-residency gene-expression signature with TRM cells that is associated with Runx3 activity. In a mouse model of adoptive T cell therapy for melanoma, Runx3-deficient CD8+ tumour-infiltrating lymphocytes failed to accumulate in tumours, resulting in greater rates of tumour growth and mortality. Conversely, overexpression of Runx3 enhanced tumour-specific CD8+ T cell abundance, delayed tumour growth, and prolonged survival. In addition to establishing Runx3 as a central regulator of TRM cell differentiation, these results provide insight into the signals that promote T cell residency in non-lymphoid sites, which could be used to enhance vaccine efficacy or adoptive cell therapy treatments that target cancer.


Conflict of interest statement

Author Information: The authors declare no competing financial interests.

Figures

Extended Data Figure 1
Extended Data Figure 1. KLRG1lo cells preferentially give rise to Trm
a, Representative flow cytometric gating strategy for distinguishing P14 cells located in non-lymphoid tissues following CD8α i.v. administration in LCMV infected mice (left). Right, in vitro activated P14 cells were transferred to recipient mice and infected with LCMV and the frequency of CD69+ and CD103+ P14 cells among KLRG1hi and KLRG1lo on day 7 of infection is indicated. b, Frequency of CCR9, CXCR3, and CD49d on KLRG1lo and KLRG1hi cells in the IEL compartment on day 7 of infection. c, Schematic of experimental design (top). KLRG1lo and KLRG1hi P14 cells were sorted from spleens and LNs on day 5 of LCMV infection and transferred into recipient mice infected 4 days prior with LCMV. Tcm, Tem, and Trm P14 cells were enumerated on days 20 or 25 of infection using flow cytometry (bottom). Graphs indicate mean ± s.e.m of n=5 mice (a,b) or n=3–4 mice (c) from one representative of 2 independent experiments, *P<0.05, **P<0.01, ***P<0.005. Symbols represent an individual mouse (c).
Extended Data Figure 2
Extended Data Figure 2. Representative ATAC-seq peaks and putative Trm regulators identified through PageRank analysis
a, ATAC-seq analysis of the indicated loci on day 7 of infection (left) and corresponding gene expression (right). b, Personalized PageRank score and gene-expression of TFs with select TFs highlighted.
Extended Data Figure 3
Extended Data Figure 3. Runx3-deficiency impairs IEL Trm formation
a, Runx3 mRNA levels from indicated cells determined by microarray analyses. b, Relative Runx3 mRNA expression of in vitro cultured cells transduced with Con shRNAmir or Runx3 shRNAmir-encoding retroviruses measured by qPCR. c, Congenically distinct P14 cells were transduced with Runx3 shRNAmir or Con shRNAmir encoding retroviruses, mixed at a 1:1 ratio, and transferred to recipient mice that were subsequently infected with LCMV. Representative flow cytometry plots (bottom, left) and quantification of the ratio of Runx3 shRNAmir or control shRNAmir transduced P14 cells in indicated tissues on day 12 of infection (bottom, right). d, Representative flow cytometry plots (left) and quantification of the frequency of CD69+ and CD103+ cells of Con shRNAmir or Runx3 shRNAmir cells (right) from experimental schematic in c. e, Representative flow cytometry plots and quantification of the frequency of CD69+ and CD103+ cells from Fig. 2 c,d. f, Representative flow cytometry plots and quantification of the frequency of CD69+ and CD103+ cells from Fig. 2f. Graphs indicate mean ± s.e.m and representative of two independent experiments (b) with n=5 (c,d), n=5 (LM-GP33–41) or n=6 (LCMV) (e), and n=5 (vehicle) or n=3 (tamoxifen) (f), *P<0.05, **P<0.01 ***P<0.005. Symbols represent an individual mouse (c–f).
Extended Data Figure 4
Extended Data Figure 4. Runx3-deficiency impairs IEL Trm formation in a polyclonal setting
a, Representative flow cytometry plot of H-2Db GP33–41 tetramer staining of lymphocytes from Runx3fl/fl dLck-Cre+YFP and Runx3+/+dLck-Cre+YFP mice on day 12 of LCMV infection (gated on total lymphocytes). b, Quantification of the proportion (left) and absolute number (right) of tetramer+ cells. c,d, Representative flow cytometry plots and quantification of the frequency of CD69+ and CD103+ cells. Graphs indicate mean ± s.e.m with n=4 (Runx3+/+) or n=5 (Runx3fl/fl) mice pooled from two independent experiments, **P<0.01, ***P<0.005. Symbols represent an individual mouse (b,d).
Extended Data Figure 5
Extended Data Figure 5. Runx3 is required for Trm formation in diverse non-lymphoid tissues
a, Schematic of experimental design. b, Representative flow cytometry plots (left) and quantification (right) of the ratio Runx3fl/fl and Runx3+/+ P14 cells (gated on YFP-Cre+ cells) in lymphoid and non-lymphoid compartments on days 15/16 of LCMV infection (same data as in Fig. 2d but including SG and kidney populations). c, Schematic for experimental design. d, Representative flow cytometry plots (left) and quantification (right) of the ratio of transduced cells in the skin relative to the spleen for Con shRNAmir or Runx3 shRNAmir P14 cells on day 12 of an intradermal (i.d.) LCMV infection. e, Frequency of CD69+ and CD103+ cells. f, Schematic for experimental design. g, Representative flow cytometry plots (left) and quantification (right) of the ratio of transduced cells in the lung parenchyma relative to the spleen for Con shRNAmir or Runx3 shRNAmir P14 cells on day 12 of an intratracheal (i.t.) LCMV infection. h, Frequency of CD69+ and CD103+ cells. Graphs indicate mean ± s.e.m and representative of two independent experiments with n=6 (b), or data pooled from two individual experiments with n=6 per group (c–h), *P<0.05, **P<0.01, ***P<0.005. Symbols represent an individual mouse (b,d,e,g,h).
Extended Data Figure 6
Extended Data Figure 6. Runx3-deficiency enhances Trm apoptosis but does impact trafficking or proliferation
a, Representative flow cytometry histogram of granzyme B (GzB) staining (left) and quantification of frequency of GzB+ cells on day 12 or 14 of infection. b, Representative flow cytometry plots (left) and quantification (right) of the frequency of IFNγ- and TNFα-producing Con shRNAmir or Runx3 shRNAmir P14 cells on day 6 of LCMV infection, restimulated with GP33–41 peptide. c,d, Representative histograms and quantification of Annexin V+ cells from shRNAmir mixed transfers on day 14 of LCMV infection (c) or from day 8 Runx3fl/fl and Runx3+/+ mixed P14 transfers where tamoxifen was administered on days 2–5 of LCMV infection (d). e, Congenically distinct P14 cells were transduced with Con shRNAmir or Runx3 shRNAmir encoding retroviruses, mixed at a 1:1 ratio, and transferred to recipient mice that were subsequently infected with LCMV. On day 6 of infection, splenocytes were harvested and retransferred to day 5 infected host mice and 18h later spleen, mLN and small intestine were harvested to assess trafficking. Representative flow cytometry plots (bottom, left) and quantification of the ratio of Con shRNAmir and Runx3 shRNAmir transduced P14 cells (bottom, right) in indicated tissues 18h after transfer. f, Frequency of KI-67+ Con shRNAmir or Runx3 shRNAmir transduced P14 cells in a mixed transfer setting on days 6 and 12 or 14 of LCMV infection. Graphs indicate mean ± s.e.m and representative of two independent experiments with n=5 (a), n=3 (b), n=5 (c), n=6 (d), n=4 (e), and n=3 on day 6 or n=4 on day 14 (f) except d is pooled from two independent experiments, *P<0.05, **P<0.01, ***P<0.005, n.s., not significant. Symbols represent an individual mouse (a–f).
Extended Data Figure 7
Extended Data Figure 7. Runx3 overexpression enhances lung Trm differentiation
a, Runx3 mRNA expression of in vitro cultured cells transduced with GFP-RV or Runx3-RV. b, Schematic for experimental design of intratracheal (i.t.) LCMV infection. c, Representative flow cytometry plots (left) and quantification (right) of the ratio of GFP-RV or Runx3-RV cells in the mediastinal LN (medLN), lung parenchyma, or CD69+CD103+ lung parenchyma population on day 12 or 13. d, Representative flow cytometry plots (left) and quantification (right) of the frequency of CD69+ and CD103+ P14 cells in the lung parenchyma. Graphs indicate mean ± s.e.m and data representative of one of two independent experiments (a) and n=4 per group (c,d), *P<0.05, ***P<0.005. Symbols represent an individual mouse (c,d).
Extended Data Figure 8
Extended Data Figure 8. Runx3 regulates distinct gene programs in circulating cells versus tissue resident cells and operates upstream of T-bet in programming IEL Trm differentiation
a, Percentage of genes of the core tissue-residency signature, core circulating signature, or background sites that exhibit direct Runx3 binding by ChIP-seq analysis. b, Predicted Runx3 binding network, generated from ATAC-seq analysis, in IEL P14 cells and splenic P14 cells on day 7 of infection (left). Red indicates genes putatively regulated by Runx3 in IEL cells; grey indicates genes putatively regulated by Runx3 in splenic cells. Gene Ontology (GO) enrichment analysis (right) of gene sets in the predicted Runx3 binding network in each tissue. c, Runx3 ChIP-seq of the Tbx21 locus in naive and activated CD8+ T cells from Lotem et al.. d, Representative flow cytometry histograms (left) and MFI quantification (right) of T-bet expression in splenic P14 cells on day 8 of infection. e, Schematic for experimental design (left) in which Runx3+/+lErt2-Cre+YFP were transduced with Con shRNAmir and Runx3+/+Ert2-Cre+YFP P14 cells were transduced with Tbx21 shRNAmir, mixed 1:1 and transferred into recipient mice subsequently infected with LCMV. Recipient mice were treated with tamoxifen on days 0–4 of infection. Representative flow cytometry plots (middle panel) and quantification of the ratio of untransduced (ametrine) Runx3+/+ and Runx3fl/fl P14 cells and the ratio of transduced (ametrine+) Runx3+/+/Con shRNAmir and Runx3fl/fl/Tbx21 shRNAmir (right) were evaluated on day 12 of LCMV infection. f, Representative flow cytometry plots (left) and quantification (right) of the frequency of CD69+ and CD103+ cells. g, Runx3 ChIPseq of the Klf2 locus in naive and activated CD8+ T cells. h, Fold change in gene-expression of Klf2, S1pr1, and Ccr7 in Runx3fl/fl and Runx3-RV cells relative to Runx3+/+ WT cells, from RNA-seq analysis consisting of 2 replicates per sample. Graphs indicate mean ± s.e.m and data representative of one of two independent experiments with n=6 (Runx3fl/fl) or n=4 (Runx3 shRNA) (d) and n=4 per group(e,f). *P<0.05, **P<0.01 ***P<0.005. Symbols represent an individual mouse (d–f).
Extended Data Figure 9
Extended Data Figure 9. Runx3-deficiency does not impair trafficking to the tumor but impacts the effector phenotype of TIL
a, Schematic of adoptive therapy experimental design. b, Congenically distinct P14 cells were transduced with Runx3 shRNAmir or Con shRNAmir encoding retroviruses, mixed at a 1:1 ratio, and transferred into mice with established B16-GP melanoma tumors. Eighteen hours after transfer, tumors were harvested to assess the ratio of Runx3 shRNAmir or Con shRNAmir P14 cells. c, Representative flow cytometry histograms of Con shRNAmir, Runx3 shRNAmir, GFP-RV, or Runx3-RV TIL in mixed transfer settings. Control P14 splenocytes were included in histograms for reference. d, Gene set enrichment analysis of the core tissue-residency and core circulating gene signatures in human lung CD8+ TIL relative to corresponding CD8+ PBMCs. Graphs indicate mean ± s.e.m and combined of two independent experiments with n=5 mice per group (b) or representative of two independent experiments with n=3–6 per group (b). Symbols represent an individual mouse (b).
Figure 1
Figure 1
Computational and functional RNAi screens identify transcriptional regulators of Trm differentiation. a, Comparison of gene-expression of IEL (left) and kidney Trm (right) relative to Tcm and Tem subsets on day 35 of LCMV infection; red, genes elevated in Trm relative to Tcm and Tem; blue, genes elevated in Tcm and Tem relative to Trm (top). Comparison of differentially-expressed genes in mature Trm (from top panel) in cells from the spleen, IEL, or kidney on day 7 of infection (bottom). b, Differentially-expressed genes between splenic, IEL, and kidney populations on day 7 of infection were compared among effector and memory CD8+ T cell subsets. Populations are ordered by hierarchical clustering with Pearson correlation. c, PCA of differentially-expressed genes among day 7 subsets and naive P14 cells. d, PCA of differential global chromatin accessibility of subsets on day 7 of infection identified by ATAC-seq analysis. e, Combinatorial screening approach. f, TFs with a PageRank score of ≥1.5-fold change in day 7 non-lymphoid cells compared to day 7 splenic cells are included in the heatmap; genes known to regulate Trm formation are in bold font. i, Relative enrichment of shRNAmirs in IEL Trm relative to splenic Tcm from the RNAi screen, reported as the average Z-score from 3 independent screens where each independent screen was performed by pooling DNA from sorted P14 cells from 15–18 mice. Each timepoint represents an individual experiment consisting of 2–3 biological replicates where n=2–10 mice were pooled for each replicate (a–d).
Figure 2
Figure 2
Runx3 is essential for the differentiation and long-term maintenance of CD8+ Trm cells. a, Ratio of Runx3- or control-shRNAmir transduced P14 cells in indicated tissues on day 23 or 26 of LCMV infection. b, Ratio of transduced transferred cells in indicated tissues on day 32 of enteric LM-GP33–41 infection. c, Ratio of transferred Runx3fl/flErt2-Cre+YFP (Runx3fl/fl) and Runx3+/+Ert2-Cre+YFP (Runx3+/+) P14 cells in indicated tissues on days 6/7 and 15/16 of LCMV infection (top) or enteric LM-GP33–41 infection (bottom). d, Ratio Runx3fl/fl and Runx3+/+ P14 cells on day 15 of LCMV infection. e, Ratio of Runx3fl/fl and Runx3+/+ P14 cells on day 35 of infection. Graphs indicate mean ± s.e.m of n=5 (a), n=3 (b), n=3 (day 7) and n= 6 (day 15/16) (c), n=5 (d), and n=5 (vehicle) and n=3 (tamoxifen) (e). All data are from one representative experiment of 2 independent experiments except a is pooled from 2 independent experiments; *P<0.05, **P<0.01, ***P<0.005. Symbols represent an individual mouse (a–e).
Figure 3
Figure 3
Runx3 programs CD8+ T cell tissue-residency. a, Congenically distinct P14 cells were transduced with Runx3-RV (CD45.1+ cells) or GFP-RV (CD45.1.2+ cells), mixed at a 1:1 ratio, and transferred to recipient mice subsequently infected with LCMV. Ratio of transduced cells evaluated on days 8 and 12/13 of infection. b Frequency of CD69+ and CD103+ cells from a. c, Relative expression of the core “circulating” and “residency” genes between Runx3-RV, Runx3fl/fl, and Runx3+/+ CD8+ T cells (left) and gene set enrichment analysis (right). Graphs show mean ± s.e.m of n=5 mice (a,b) from one representative experiment of 2 independent experiments, *P<0.05, **P<0.01, ***P<0.005, n.s., not significant. Symbols represent an individual mouse (a,b).
Figure 4
Figure 4
CD8+ TIL share transcriptional similarity with Trm and require Runx3 for tumor residency. a, Comparison of the core tissue-residency signature and core circulating signature (from Fig. 3c) in B16 melanoma CD8+ TIL or PyMT mammary tumor CD8+ TIL relative to corresponding splenic cells. b, PCA of gene-expression of the core tissue-residency and circulating gene sets for TIL, Trm, or splenic subsets. c, d Congenically distinct P14 cells were transduced with Runx3 shRNAmir or Runx3-RV (CD45.1+ cells) and Con shRNAmir or GFP-RV (CD45.1.2+ cells), mixed at a 1:1 ratio and transferred into mice with established B16-GP33–41 melanoma tumors. Flow plots and graphs indicate ratio of transduced cells. e, Relative expression of the core tissue-residency and core circulating gene sets in GFP-RV splenocytes, GFP-RV TIL, and Runx3-RV TIL following the same approach as in c. f,g, Tumor growth and survival following adoptive transfer of the indicated cell population. h, Gene set enrichment analysis of the core tissue-residency signature in Runx3hi vs Runx3lo TIL from single-cell RNA-seq analyses of mouse and human melanoma TIL. Graphs indicate mean ± s.e.m of n=5 (Runx3 shRNAmir) or n=7 mice per group (Runx3-RV) from one representative experiment of 3 independent experiments (c,d) or data pooled from 3 independent experiments consisting of n=10–21 mice per group (f, g), *P<0.05, **P<0.01, ***P<0.005. Symbols represent an individual mouse (d).

Comment in

References

    1. Jiang X, et al. Skin infection generates non-migratory memory CD8+ T(RM) cells providing global skin immunity. Nature. 2012;483:227–231. - PMC - PubMed
    1. Schenkel JM, et al. Resident memory CD8 T cells trigger protective innate and adaptive immune responses. Science. 2014;346:98–101. - PMC - PubMed
    1. Chang JT, Wherry EJ, Goldrath AW. Molecular regulation of effector and memory T cell differentiation. Nat Immunol. 2014;15:1104–1115. - PMC - PubMed
    1. Mueller SN, Gebhardt T, Carbone FR, Heath WR. Memory T cell subsets, migration patterns, and tissue residence. Annu Rev Immunol. 2013;31:137–161. - PubMed
    1. Mackay LK, et al. The developmental pathway for CD103+ CD8+ tissue-resident memory T cells of skin. Nat Immunol. 2013;14:1294–1301. - PubMed

Publication types

MeSH terms

LinkOut - more resources