. 2017 Dec 14;552(7684):187-193.
doi: 10.1038/nature25143. Epub 2017 Dec 6.

Enhancing mitochondrial proteostasis reduces amyloid-β proteotoxicity

Affiliations

Enhancing mitochondrial proteostasis reduces amyloid-β proteotoxicity

Vincenzo Sorrentino et al. Nature. .

Abstract

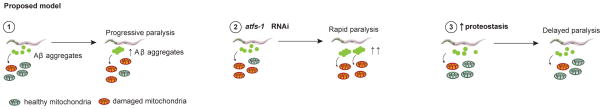
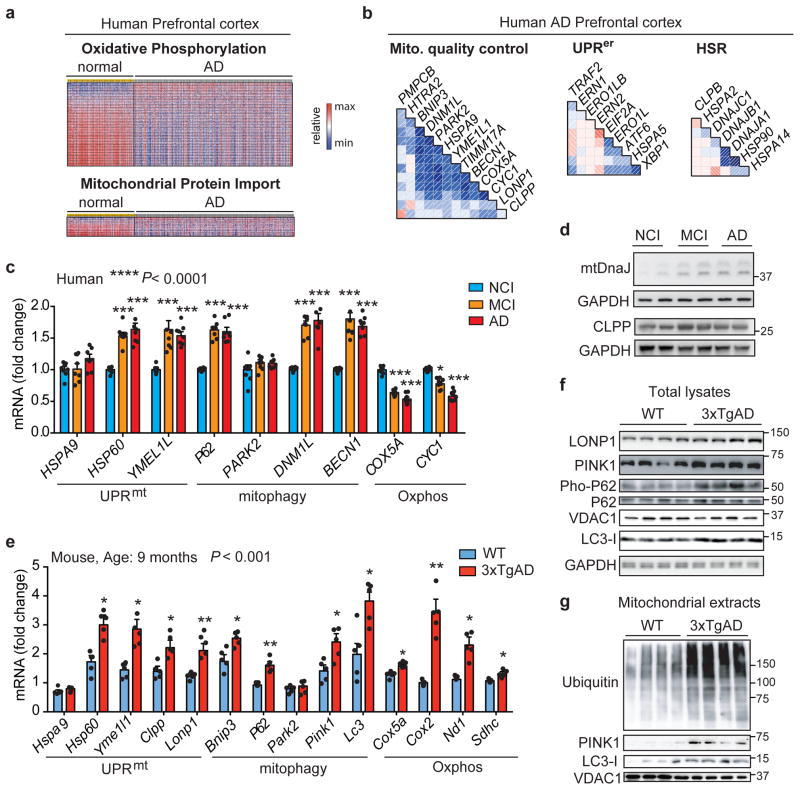
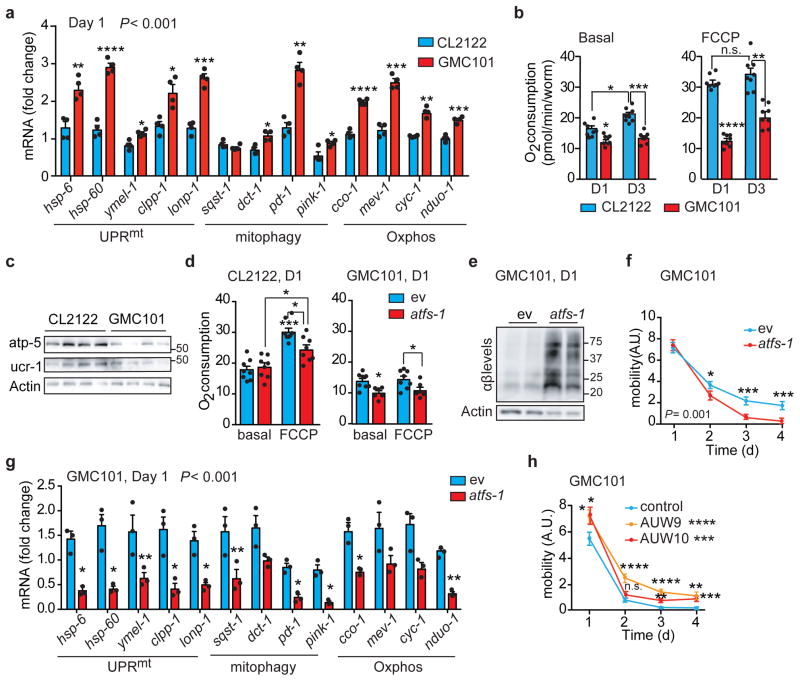
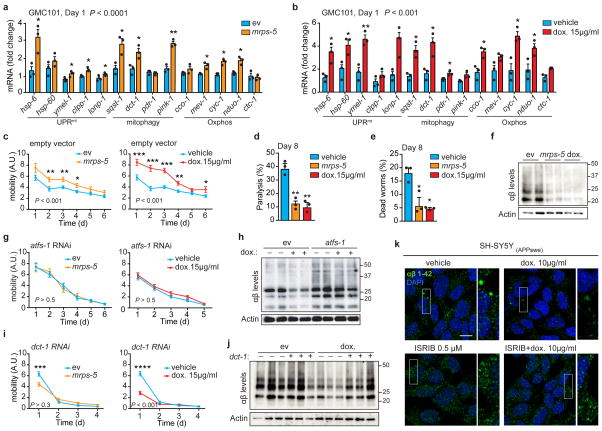
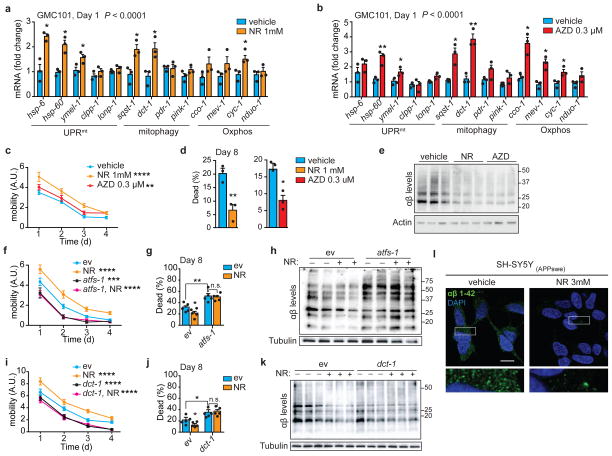
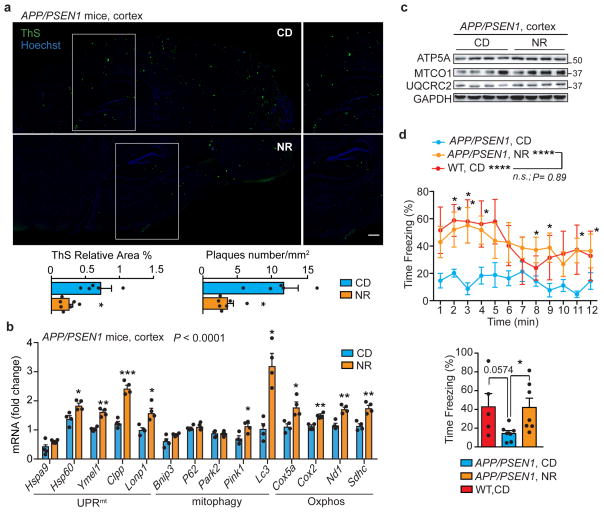
Alzheimer's disease is a common and devastating disease characterized by aggregation of the amyloid-β peptide. However, we know relatively little about the underlying molecular mechanisms or how to treat patients with Alzheimer's disease. Here we provide bioinformatic and experimental evidence of a conserved mitochondrial stress response signature present in diseases involving amyloid-β proteotoxicity in human, mouse and Caenorhabditis elegans that involves the mitochondrial unfolded protein response and mitophagy pathways. Using a worm model of amyloid-β proteotoxicity, GMC101, we recapitulated mitochondrial features and confirmed that the induction of this mitochondrial stress response was essential for the maintenance of mitochondrial proteostasis and health. Notably, increasing mitochondrial proteostasis by pharmacologically and genetically targeting mitochondrial translation and mitophagy increases the fitness and lifespan of GMC101 worms and reduces amyloid aggregation in cells, worms and in transgenic mouse models of Alzheimer's disease. Our data support the relevance of enhancing mitochondrial proteostasis to delay amyloid-β proteotoxic diseases, such as Alzheimer's disease.


Conflict of interest statement

The authors declare no competing financial interests.

Figures

Extended Data Figure 1
Extended Data Figure 1. Mitochondrial function pathways are perturbed in AD
a, GSEA of Oxphos (FDR:0.051, nominal-P=0.008) and mitochondrial import (FDR:0.295, nominal-P=0.002) genes in human AD prefrontal cortex (GN328; normal, n=195; AD, n=388 individuals). b–g, GSEA of Oxphos (FDR:0.754, P=0.038) and mitochondrial import (FDR:0.657, P=0.031) genes in human Alzheimer visual cortex (GN327, n=195 normal and n=388 AD individuals) (b) and whole brain (GN314, n=16 normal and 33 AD individuals) (FDR:0.076, P=0.002 for Oxphos, FDR:0.218, P=0.006 for mitochondrial import) (e). Heatmaps of genes from visual cortex (c) and whole brain (f) datasets. Correlation plots of mitochondrial stress genes, UPRer and HSR levels in human visual cortex (d) and whole brain (g) from AD patients. For further information, see Supplementary Table 5. h, Quantification of immunoblots for mtDNaJ and CLPP (n=8 per group) from brains of humans with no cognitive impairment (NCI), mild-cognitive impairment (MCI) and mild/moderate AD. This experiment was performed independently twice. Values in the figure are mean ± s.e.m. ***P≤0.001. Differences were assessed using two-tailed t tests (95% confidence interval). Mito., mitochondrial. For all the individual p values, see the Extended Data Fig. 1 Spreadsheet file.
Extended Data Figure 2
Extended Data Figure 2. MSR analysis and mitochondrial function in 3xTgAD mice
a, Human APP expression in cortex tissues of WT and 3xTgAD mice (n=4 animals per group). **P≤0.01 (P=0.002). b, MSR transcript analysis from cortex tissues of WT (n=4 animals) and 3xTgAD mice (n=4 animals) at 6 months of age. c, Immunoblot analysis (WT, n=5; 3xTgAD, n=6, WB of 4 representative mice) and quantification of the same samples as in b. *P<0.05. (P=0.035,0.029). d–f, MSR transcript analysis from cortex tissues of WT (d, 6mo, n=4 animals; 9mo, n=5 animals) and 3xTgAD mice (e, 6mo, n=4 animals; 9mo, n=5 animals) at 6 and 9 months of age, and corresponding heatmaps (f) representing relative variation in gene expression between groups. g, CS activity assay in cortex tissues from WT and 3xTgAD mice (WT, n=8 animals; 3xTgAD, n=7 animals). *P<0.05 (P=0.039). Values in the figure are mean ± s.e.m. *P<0.05; **P≤0.01; ***P≤0.001; n.s., non-significant. Throughout the figure, overall differences between conditions were assessed by two-way ANOVA. Differences for individual genes, proteins or two groups were assessed using two-tailed t tests (95% confidence interval). All experiments were performed independently twice. For uncropped gel source data, see Supplementary Fig. 1. For all the individual p values, see the Extended Data Fig. 2 Spreadsheet file.
Extended Data Figure 3
Extended Data Figure 3. Characterization of Aβ proteotoxicity and stress response pathways in GMC101 worms
a, Amyloid aggregation in CL2122 and GMC101 worms (n=3 biologically independent samples) at 20°C or 25°C. b, MSR transcript analysis in worms at 20°C (n=3 biologically independent samples). c, Respiration assay in CL2122 and GMC101 (CL2122, n=8; GMC101, n=8 biologically independent samples). d, mtDNA/nDNA ratio in CL2122 and GMC101 (n=13 animals per group). e, CS activity in CL2122 and GMC101 on D1 (n=5 biologically independent samples). **P≤0.01 (P=0.004). f, CL2122 and GMC101 mobility (CL2122, n=48; GMC101, n=59 worms). g, Confocal images of D1 adult worms showing muscle cell integrity, nuclear morphology and mitochondrial networks. Scale bar, 10μm. See also Methods. h, Representative images and fraction of worms upon atfs-1 RNAi (n=4 independent experiments). *P<0.05 (Larvae,0.048; Adults,0.035). i, Transcript analysis of UPRer, HSR and daf-16 target genes (n=3 biologically independent samples). j, Representative images and fraction of worms fed with atfs-1, xbp-1 and hsf-1 RNAis at 20°C (n=8 per group; xbp-1, n=3 biologically independent samples). k, Amyloid aggregation upon atfs-1 RNAi (n= 2 biological replicates). l, Mobility of CL2122 fed with 50% dilution of atfs-1 RNAi (ev, n=48; atfs-11/2, n=47 worms). m, Validation of the atfs-1 RNAi in CL2122 and GMC101 (n=3 biologically independent samples). n, MSR transcript analysis of CL2122 upon atfs-1 RNAi (n=3 biologically independent samples). o, Mobility of D1 adult worms fed with atfs-1 or hsf-1 RNAi at 25°C (CL2122, n=22,27,28; GMC101, n=27,21,18; N2, n=31,38,27 worms). p, Validation of the newly generated atfs-1#2 RNAi (n=3 biologically independent samples). For further information, see Methods. q, Worm mobility upon atfs-1#2 RNAi (CL2122, ev, n=47; atfs-1#2, n=42; GMC101, ev, n=55; atfs-1#2, n=46 worms). ev, scrambled RNAi; A.U., arbitrary units. Values in the figure are mean ± s.e.m. *P<0.05; **P≤0.01; ***P≤0.001; ****P≤0.0001; n.s., non-significant. Throughout the figure, overall differences between conditions were assessed by two-way ANOVA. Differences for individual genes or two groups were assessed using two-tailed t tests (95% confidence interval). All experiments were performed independently at least twice. For uncropped gel source data, see Supplementary Fig. 1. For all the individual p values, see the Extended Data Fig. 3 Spreadsheet file.
Extended Data Figure 4
Extended Data Figure 4. Reliance on ubl-5 and on increased mitochondrial stress response of GMC101 worms
a, Fraction of D1 adult worms fed with ubl-5 RNAi (n=5 biologically independent samples). b–c, Mobility of worms (b) and percentage of paralyzed and dead D8 adult worms (c) upon ubl-5 RNAi (b, CL2122, ev, n=39; ubl-5, n=43; GMC101, ev, n=40; ubl-5, n=41 worms; n for c, 5 biologically independent samples). d–e, Transcript analysis of UPRer, HSR and daf-16 target genes in GMC101 (d) and CL2122 (e) upon atfs-1 RNAi (n=3 biologically independent samples) f, Validation of the atfs-1 overexpressing strains AUW9, AUW10 and AUW11 (n=3 biologically independent samples). See also Methods. g, Worm mobility in atfs-1 overexpressing CL2122- and GMC101-derived lines (CL2122, n=40; GMC101, n=57; AUW9, n=40; AUW10, n=38; AUW11, n=42 worms). h, Percentage of paralyzed and dead D6 adult worms (n=5biologically independent samples). *P<0.05 (P=0.019,0.046,0.041). i–j, Mobility (i) and percentage of paralyzed and dead D8 adult (j) GMC101, clk-1 mutants (CB4876), and AUW12 (i, GMC101, n= 35; CB4876 n=42; AUW12, n=38 worms; n for j, 5 biologically independent samples). k–l, Mobility (k) and percentage of paralyzed and dead D8 adult (l) of GMC101, nuo-6 mutant (MQ1333), and AUW13 (k, GMC101, n=46; MQ1333 n=50; AUW13, n=47 worms; n for l, n=5 biologically independent samples). For further information on all these strains, see Methods section. ev, scrambled RNAi; A.U., arbitrary units. Values in the figure are mean ± s.e.m. *P<0.05; **P≤0.01; ***P≤0.001; ****P≤0.0001; n.s., non-significant. Throughout the figure, overall differences between conditions were assessed by two-way ANOVA. Differences for individual genes or two groups were assessed using two-tailed t tests (95% confidence interval). All experiments were performed independently at least twice. For uncropped gel source data, see Supplementary Fig. 1. For all the individual p values, see the Extended Data Fig. 4 Spreadsheet file.
Extended Data Figure 5
Extended Data Figure 5. Effects of the inhibition of mitochondrial translation and mitophagy in worms, and of compound treatments in mammalian cells
a, Representative images of GMC101 worms upon mrps-5 RNAi or dox treatment (15μg/mL) from eggs to D1 (n=2 independent experiments). b, MSR transcript analysis of dox-treated CL2122 (n=4 biologically independent samples). c–d, Transcript analysis of UPRer, HSR and daf-16 target genes in GMC101 fed with mrps-5 RNAi (c), or treated with dox (15μg/mL) (d) (c–d, n=3 biologically independent samples). e, Amyloid aggregation in worms upon mrps-5 RNAi or dox treatment (n=3 biologically independent samples). f, Respiration on D3 and 6 in GMC101 fed with mrps-5 RNAi (n=9; mrps-5 D6, n=8 biologically independent samples). g, Additional confocal images of the SH-SY5Y(APPSwe) cells stained with the anti-β-Amyloid 1-42 antibody, after dox and ISRIB treatment. Scale bar, 10μm. h, Oxphos immunoblot of SH-SY5Y(APPSwe) cells showing the effects of NR (1mM) and dox (10μg/mL) (n=2 biologically independent samples). i–j, Transcript levels of MSR (i) and ATF4 target genes (j) in APPSwe-expressing cell line after 24h of dox (10μg/mL; n=4 biologically independent samples). k, Mobility of GMC101 upon dct-1 RNAi (ev, n=54; dct-1, n=44 worms). l, Mobility of GMC101 fed with dct-1, mrsp-5, or both RNAis (ev, n=54; dct-1, n=44; mrps-5, n=35; mrps-5,dct-1, n=45 worms). m, Mobility of GMC101 treated with dox or fed dct-1 RNAi (ev, n =54; dct-1, n=44; dox, n=52; dox,dct-1, n=54 worms). n–o, Mobility of CL2122 fed with dct-1 RNAi (n) from D1 to 4 (ev, n=44; dct-1, n=40 worms), or (o) at D8 (n=38 worms, *P<0.05 (0.018)). ev, scrambled RNAi; dox., doxycycline; NR, nicotinamide riboside; ISRIB, integrated stress response inhibitor; A.U. Values in the figure are mean ± s.e.m. *P<0.05; **P≤0.01; ***P≤0.001; ****P≤0.0001; n.s., non-significant. Throughout the figure, overall differences between conditions were assessed by two-way ANOVA. Differences for individual genes or two groups were assessed using two-tailed t tests (95% confidence interval). All experiments were performed independently at least twice. For uncropped gel source data, see Supplementary Fig. 1. For all the individual p values, see the Extended Data Fig. 5 Spreadsheet file.
Extended Data Figure 6
Extended Data Figure 6. Effect of NAD+-boosting compounds and sirtuin depletion in worms, and NR treatment in mammalian cells
a, Percentage of paralyzed D8 adult GMC101 after NR or AZD (n=3 independent experiments). b–c, MSR transcript analysis of CL2122 treated with NR (b,1mM) or AZD (c, 0.3μM) (b–c, n=3 biologically independent samples). d–e, Mobility of CL2122 treated with NR (1mM) or AZD (0.3μM) from (d) D1 to 4 (vehicle, n=44; NR, n=48 ; AZD, n=43 worms, or (e) at D8 (vehicle, n=38; NR, n=36; AZD, n=33 worms, *P<0.05 (P=0.017); **P≤0.01 (P=0.004)). f–g, Percentage of paralyzed D8 adult GMC101 treated with NR upon atfs-1 RNAi (f) or dct-1 RNAi (g) (n=5 biologically independent samples). h, Representative images of worms fed with atfs-1, sir-2.1, and daf-16 RNAis (n=2 independent experiments). i, Mobility of NR-treated GMC101 (1mM) fed with sir-2.1 RNAi (ev, n=52; sir-2.1, n=37; NR, n=40; sir-2.1,NR, n=51 worms). j, Mobility of NR-treated GMC101 (1mM) fed daf-16 RNAi (ev, n=52; daf-16, n=43; NR, n=40; daf-16,NR, n=48 worms k, Percentage of paralyzed and dead D8 adult GMC101 treated with NR or fed sir-2.1, daf-16 or atfs-1 RNAis (n=5 biologically independent samples). l–m,, Transcript analysis of UPRer, HSR and daf-16 target genes in GMC101 treated with NR (l, 1mM, *P<0.05 (P=0.03,0.008)), or AZD (m, 0.3μM, *P<0.05 (P=0.033); **P≤0.01 (P=0.0004) (n=3 biologically independent samples). n, Additional confocal images of the intracellular amyloid deposits in the SH-SY5Y(APPSwe) cells after 24 h NR treatment. o, Transcript levels of MSR genes in APPSwe-expressing cells after NR (1mM) (n=4 biologically independent samples). NR, nicotinamide riboside; ISRIB, integrated stress response inhibitor; AZD, Olaparib; ev, scrambled RNAi; A.U., arbitrary units. Values in the figure are mean ± s.e.m. *P<0.05; **P≤0.01; ***P≤0.001; ****P≤0.0001; n.s., non-significant. Throughout the figure, overall differences between conditions were assessed by two-way ANOVA. Differences for individual genes or two groups were assessed using two-tailed t tests (95% confidence interval). All experiments were performed independently twice. For all the individual p values, see the Extended Data Fig. 6 Spreadsheet file.
Extended Data Figure 7
Extended Data Figure 7. Proposed model
Scheme illustrating the role of mitochondrial proteostasis in Aβ proteopathies based on our studies in the GMC101 model. (1) Accumulation of amyloid aggregates triggers mitochondrial dysfunction, which induces the MSR. (2) atfs-1 depletion results in loss of mitochondrial homeostasis, more pronounced amyloid aggregation and decreased healthspan. (3) Enhancing mitochondrial proteostasis with dox, mrps-5 RNAi, and NAD+ boosters (NR and Olaparib), increases organismal fitness, delaying the development of Aβ proteotoxicity.
Figure 1
Figure 1. Mitochondrial dysfunction in AD is typified by a conserved Mitochondrial Stress Response
a Heatmap of the expression levels of Oxphos and mitochondrial import genes in human AD prefrontal cortex (GN328; normal, n=195; AD, n=388 individuals). b, Correlation plots of mitochondrial stress genes, UPRer and HSR levels in prefrontal cortex from AD patients (GN328; n as in a). See Extended Data Fig. 1 and Supplementary Table 1–5. c–d, Transcript analysis of the Mitochondrial Stress Response signature (c; MSR, n=8 per group) and Western blot (d, WB, n=2 individuals) of mtDNaJ and CLPP in brains of humans with no cognitive impairment (NCI), mild-cognitive impairment (MCI) and mild/moderate AD. e–f, Transcript (e) and immunoblot (f) analysis of MSR genes in cortex of 9-months old wild type (WT) and 3xTgAD mice (WT, n=5; 3xTgAD, n=5 for RNA; WT, n=4; 3xTgAD, n=4 for WB, representative of 6 animals). g, Immunoblot (WT, n=4; 3xTgAD, n=4, WB representative of 5 animals) of mitophagy and autophagy proteins in mitochondrial extracts from cortex tissues of the animals in e–f. Values in the figure are mean ± s.e.m. *P<0.05; **P≤0.01; ***P≤0.001. Throughout the figure, overall differences between conditions were assessed by two-way ANOVA. Differences for individual genes/proteins were assessed using two-tailed t tests (95% confidence interval). All experiments were performed independently twice. Mito., mitochondrial. See also Extended Data Fig. 2. For uncropped gel source data, see Supplementary Fig. 1. For all the individual p values, see the Fig. 1 Spreadsheet file.
Figure 2
Figure 2. Mitochondrial dysfunction and reliance on atfs-1 of GMC101 worms upon proteotoxic stress
a, MSR transcript analysis in CL2122 and GMC101 (n=3 biologically independent samples). b, Basal respiration and after FCCP (45 min, 10μM) of day 1 (D1) and 3 (D3) adult worms (CL2122, n=8; GMC101, n=8 biologically independent samples). c, Immunoblot (CL2122, n=4; GMC101, n=4, WB representative of 5 biological replicates) of Oxphos proteins in control and GMC101 at D1. d, Respiration assay as in b in CL2122 (ev, n=8; atfs-1, n=8 biologically independent samples) and GMC101 (ev, n=8; atfs-1, n=6 biologically independent samples) fed with atfs-1 RNAi. e, Amyloid aggregation in GMC101 upon atfs-1 RNAi shown by WB of 2 biological repeats. f, Mobility of GMC101 fed with 50% atfs-1 RNAi (ev, n=59; atfs-11/2, n=50 worms). g, MSR transcript analysis of GMC101 upon atfs-1 RNAi (n=3 biologically independent samples). h, Mobility of control and afts-1 overexpressing GMC101 strains (GMC101, n=61; AUW9, n=48; AUW10, n=41 worms). Values in the figure are mean ± s.e.m. *P<0.05; **P≤0.01; ***P≤0.001; ****P≤0.0001; n.s., non-significant. Throughout the figure, overall differences between conditions were assessed by two-way ANOVA. Differences for individual genes/proteins were assessed using two-tailed t tests (95% confidence interval). All experiments were performed at least independently twice. Mito., mitochondrial; ev, scrambled RNAi; A.U., arbitrary units. See also Extended Data Fig. 3–4. For uncropped gel source data, see Supplementary Fig. 1. For all the individual p values, see the Fig. 2 Spreadsheet file.
Figure 3
Figure 3. Inhibiting mitochondrial translation reduces Aβ proteotoxicity and aggregation in GMC101 worms and in cells
a–b, MSR transcript levels in GMC101 fed mrps-5 RNAi or treated with dox (a and b, n=3 biologically independent samples). c, Mobility of GMC101 upon mrps-5 RNAi (n=35 worms) or dox treatment (n=54 worms). d–e, Percentage of paralyzed (d) and dead (e) D8 adult GMC101 worms after mrps-5 RNAi or dox treatment (n=3 independent experiments). f, Western-blot of amyloid aggregation in GMC101 upon mrps-5 RNAi or dox treatment (n=2 biologically independent samples). g, Mobility of GMC101 upon atfs-1 RNAi feeding (ev, n=54; mrps-5, n=49; dox, n=49 worms). h, Amyloid aggregation in dox-treated GMC101 upon atfs-1 RNAi (n=2 biological replicates). i, Mobility of GMC101 upon dct-1 RNAi (ev, n=44; dox, n=59; mrps-5, n=66 worms). ***P≤0.001 (P=0.0004); ****P≤0.0001. j, Amyloid aggregation in dox-treated GMC101 upon dct-1 RNAi (n=3 biologically independent samples). k, Confocal images of the SH-SY5Y neuroblastoma cell line stained with the anti-β-Amyloid 1-42, after dox and, where indicated, ISRIB treatments for 24 h. Scale bar, 10μm. See Methods for further details. Values in the figure are mean ± s.e.m. *P<0.05; **P≤0.01; ***P≤0.001; ****P≤0.0001. Throughout the figure, overall differences between conditions were assessed by two-way ANOVA. Differences for individual genes or two groups were assessed using two-tailed t tests (95% confidence interval). All experiments were performed independently at least twice. ev, scrambled RNAi; dox., doxycycline; A.U., arbitrary units; ISRIB, integrated stress response inhibitor. See also Extended Data Fig. 5. For uncropped gel source data, see Supplementary Fig. 1. For all the individual p values, see the Fig. 3 Spreadsheet file.
Figure 4
Figure 4. NAD+ boosters reduce Aβ proteotoxicity and aggregation in GMC101 worms and cells
a–b, MSR transcripts in GMC101 worms treated with nicotinamide riboside (a, NR) or Olaparib (b, AZD). a–b, n=3 biologically independent samples. c, Mobility of GMC101 treated with NR (n=50 worms) or AZD (n=39 worms). **P≤0.001 (AZD,0.006); ****P≤0.0001 (NR). d, Percentage of dead D8 adult GMC101 after NR or AZD (n=3 independent experiments). e, Western-blot of amyloid aggregation in GMC101 after NR or AZD (n=3 biologically independent samples for all groups). f, Mobility of GMC101 treated with NR upon atfs-1 RNAi feeding (ev, n=52; atfs-1, n=38; NR, n=40; NR, atfs-1, n=41 worms). ***P≤0.001 (atfs-1,0.0006). g, Percentage of dead D8 adult GMC101 treated with NR upon atfs-1 RNAi (n=5 biologically independent samples). h, Amyloid aggregation in NR-treated GMC101 upon atfs-1 RNAi feeding (WB representative of 2 biological replicates). i, Mobility of NR-treated GMC101 upon dct-1 RNAi (ev, n=41; dct-1, n=40; NR, n=39; NR, dct-1, n=50 worms). j, Percentage of dead D8 adult GMC101 treated with NR upon dct-1 RNAi (n=5 biologically independent samples). k, Amyloid aggregation immunoblot in NR-treated GMC101 upon dct-1 RNAi (n=3 biologically independent samples). l, Confocal images of APPSwe SH-SY5Y cells stained with anti-β-Amyloid 1-42, after 24 h NR treatment. Scale bar, 10μm. Values in the figure are mean ± s.e.m. *P<0.05; **P≤0.01; ***P ≤ 0.001; ****P≤0.0001; n.s., non-significant. Throughout the figure, overall differences between conditions were assessed by two-way ANOVA. Differences for individual genes or two groups were assessed using two-tailed t tests (95% confidence interval). All experiments were performed independently at least twice. ev, scrambled RNAi; A.U., arbitrary units. See also Extended Data Fig. 6. For uncropped gel source data, see Supplementary Fig. 1. For all the individual p values, see the Fig. 4 Spreadsheet file.
Figure 5
Figure 5. NR reduces Aβ deposits, induces the MSR and improves contextual memory in transgenic AD mice
a, Representative images and corresponding quantification of plaques in cortex samples of APP/PSEN1 AD mice following NR treatment, stained using Thioflavin S (ThS) (CD, n=5 animals; NR, n=7 animals; NR 400mg/kg/day for 10 weeks). Scale bar, 200μm. *P<0.05 (relative % area,0.041; number,0.014). b–c, MSR transcript (b) and immunoblot (c) analyses of cortex samples of APP/PSEN1 mice following NR treatment (b, n=5 animals per group; c, n=4 animals per group). Data in b,c are representative of two independent experiments. d, Contextual fear conditioning in WT (n=5 animals) and APP/PSEN1 mice with or without NR treatment (n=7 animals), plotted in function of the time intervals (left) or as average of the total obtained values (right). *P<0.05 (P=0.03); ****P≤0.0001. One-tail t test performed between WT and APP/PSEN1 averaged values (P=0.0574, 95% confidence interval). Values in the figure are mean ± s.e.m. *P<0.05; **P≤0.01; ***P≤0.001; ****P≤0.0001; n.s., non-significant. Throughout the figure, overall differences between conditions were assessed by two-way ANOVA. Differences for individual genes or two groups were assessed using two-tailed t tests (95% confidence interval). See Methods for further details. CD, chow diet. For uncropped gel source data, see Supplementary Fig. 1. For all the individual p values, see the Fig. 5 Spreadsheet file.

Comment in

References

    1. Alzheimer’s A. 2016 Alzheimer’s disease facts and figures. Alzheimer’s & dementia : the journal of the Alzheimer’s Association. 2016;12:459–509. - PubMed
    1. Dember LM. Amyloidosis-associated kidney disease. Journal of the American Society of Nephrology : JASN. 2006;17:3458–3471. - PubMed
    1. Askanas V, Engel WK. Sporadic inclusion-body myositis: conformational multifactorial ageing-related degenerative muscle disease associated with proteasomal and lysosomal inhibition, endoplasmic reticulum stress, and accumulation of amyloid-beta42 oligomers and phosphorylated tau. Presse medicale. 2011;40:e219–235. - PubMed
    1. Gauthier S, et al. Why has therapy development for dementia failed in the last two decades? Alzheimer’s & dementia : the journal of the Alzheimer’s Association. 2016;12:60–64. - PubMed
    1. Soejitno A, Tjan A, Purwata TE. Alzheimer’s Disease: Lessons Learned from Amyloidocentric Clinical Trials. CNS drugs. 2015;29:487–502. - PubMed

Publication types

MeSH terms