. 2018 Mar 1;35(3):575-581.
doi: 10.1093/molbev/msx309.

Transformation Asymmetry and the Evolution of the Bacterial Accessory Genome

Affiliations

Transformation Asymmetry and the Evolution of the Bacterial Accessory Genome

Katinka J Apagyi et al. Mol Biol Evol. .

Abstract

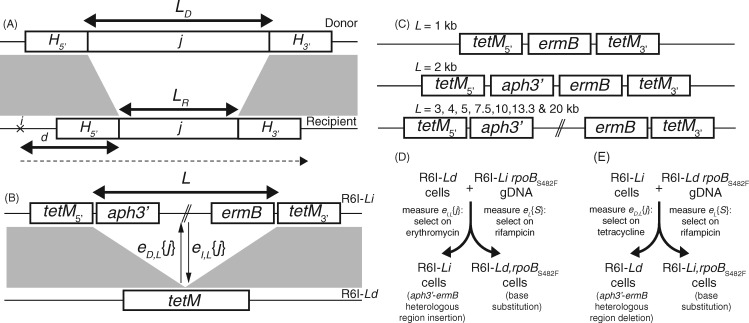
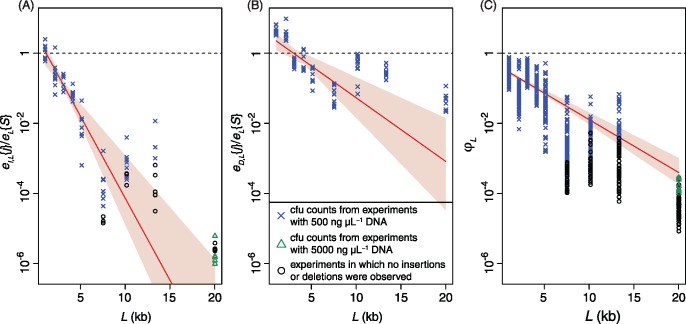
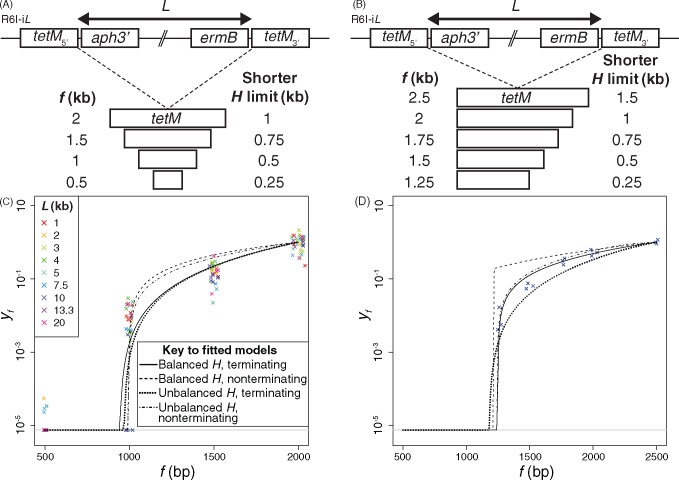
Bacterial transformation can insert or delete genomic islands (GIs), depending on the donor and recipient genotypes, if an homologous recombination spans the GI's integration site and includes sufficiently long flanking homologous arms. Combining mathematical models of recombination with experiments using pneumococci found GI insertion rates declined geometrically with the GI's size. The decrease in acquisition frequency with length (1.08×10⁻³ bp-1) was higher than a previous estimate of the analogous rate at which core genome recombinations terminated. Although most efficient for shorter GIs, transformation-mediated deletion frequencies did not vary consistently with GI length, with removal of 10-kb GIs ∼50% as efficient as acquisition of base substitutions. Fragments of 2 kb, typical of transformation event sizes, could drive all these deletions independent of island length. The strong asymmetry of transformation, and its capacity to efficiently remove GIs, suggests nonmobile accessory loci will decline in frequency without preservation by selection.

Keywords: bacterial evolution; horizontal gene transfer; mobile elements; pneumococcus; recombination; transformation.


Figures

<sc>Fig</sc>. 1
Fig. 1
Exchange of heterologous regions through homologous recombination. (A) Description of the recombination process. Donor and recipient DNA sequences are shown with gray bands linking regions of sequence similarity, separated by a central heterologous locus j, of length LD in the donor and LR in the recipient. The minimum lengths of the flanking homologous arms necessary for exchange through homologous recombination, H5′ and H3′, are shown on either side. The dashed line indicates an homologous recombination initiating at position i, d bases upstream of j. (B) Genotypes used in the experimental system, displayed as in (A). The R6I-Li genotype had either ermB, or ermB and aph3′, inserted between two halves of the tetM gene. The R6I-Ld genotype had an intact tetM gene, with all intervening sequence in the complementary R6I-Li genotype removed. Rifampicin-resistant derivatives of both were generated through transformation with an rpoB allele encoding an S482F substitution. (C) Structure of the R6I-Li genotypes. For L = 1 kb, the insert was a single ermB gene; for L = 2 kb, both ermB and aph3′ were inserted within tetM; and for L ≥ 3 kb, these genes flanked nonessential DNA to generate constructs with the specified lengths. (D) Assaying insertion of heterology through transformation. Each R6I-Ld genotype was transformed with genomic DNA from the complementary R6I-Li rpoBS482F genotype. Insertion of heterology (eI,L{j}) was inferred from counting erythromycin-resistant colonies, and acquisition of SNPs (eL{S}) was inferred from counting rifampicin-resistant colonies. (E) Assaying deletion of heterology through transformation. Each R6I-Li genotype was transformed with genomic DNA from the complementary R6I-Ld rpoBS482F genotype. Deletion of heterology (eD,L{j}) was inferred from counting tetracycline-resistant colonies, and acquisition of SNPs (eL{S}) was inferred from counting rifampicin-resistant colonies.
<sc>Fig</sc>. 2
Fig. 2
Rates of polymorphism transfer through transformation. (A) Relationship between heterologous locus length, L, and rate of insertion, eI,L{j}, relative to rate of SNP acquisition, eL{S}. Each point represents a biological replicate. Blue crosses and green triangles represent eI,L{j} estimates from counting colonies following transformation with 500 ng, or 5,000 ng, donor DNA, respectively; black circles represent experiments where eI,L{j} was too low to be experimentally detectable following transformation, hence a value of eI,L{j} = 0.5 cfu ml−1 was assumed for display purposes. The red line displays the best fitting relationship of the form τI(1−λI)L. The pink shaded region indicates the full range of associated uncertainty inferred from 100 bootstrap replicates. The horizontal dashed line indicates where eI,L{j} equals eL{S}. (B) Relationship between heterologous locus length, L, and rate of deletion, eD,L{j}, relative to rate of SNP acquisition, eL{S}. Results are displayed as in panel (A). (C) Asymmetry of transformation, ϕL. The points represent every ratio of eI,L{j}/eL{S} to eD,L{j}/eL{S} for each L. The characters correspond to those of the underlying eI,L{j}/eL{S} value in panel (A); eI,L{j} values of zero are again substituted for 0.5 cfu ml−1. The red line and pink shaded region display the best-fitting relationship of the form ϕ0(1−λϕ)L, and the associated uncertainty inferred from 100 bootstrap replicates.
<sc>Fig</sc>. 3
Fig. 3
Characterizing the length distribution of homologous arms. (A) Deletion of loci with different L by tetM fragments of different lengths, f. Each fragment had similarity to an equal length of sequence on both flanks of the heterologous locus. (B) Efficiency of deletion with symmetrical homologous arms. The metric yf corresponds to the ratio eD,f{j}/ef{S} for a fragment of length f standardized to the mean of the same metric for the largest fragment (2 kb), adjusted to account for the differing number of DNA molecules available for transformation (described in supplementary text S2, Supplementary Material online). Hence across all L, the mean relative efficiency is one at f = 2 kb. Shorter fragments drove deletions less efficiently, hence were associated with yf < 1. Three biological replicates are shown for each genotype at each f, coloured according to the genotype of the recipient, which is of the type R6I-Li. The points for each value of f are distributed over a small fraction of the horizontal axis for display purposes. The horizontal gray line at the bottom represents the threshold to which all zero values were adjusted for plotting, and the curves show the fit of four models (see key). (C) Deletion of a region of heterology in R6I-10d by tetM fragments matching different lengths downstream of the heterologous locus (supplementary text S3, Supplementary Material online). Each fragment was identical to the 1 kb of tetM upstream of the heterologous locus, with different lengths matching the downstream region. (D) Efficiency of deletion with unbalanced homologous arms. Data are plotted as in panel (B), but only for R6I-10d. The yf metric is calculated in the same way, except the maximum f in this experiment is 2.5 kb, hence this is the point at which the mean yf is one.

References

    1. Adams A. 1972. Transformation and transduction of a large deletion mutation in Bacillus subtilis. Mol Gen Genet. 118(4):311–322. - PubMed
    1. Baumdicker F, Hess WR, Pfaffelhuber P.. 2012. The infinitely many genes model for the distributed genome of bacteria. Genome Biol Evol. 4(4):443–456.http://dx.doi.org/10.1093/gbe/evs016 - DOI - PMC - PubMed
    1. Claverys JP, Lefevre JC, Sicard AM.. 1980. Transformation of Streptococcus pneumoniae with S. pneumoniae-lambda phage hybrid DNA: induction of deletions. Proc Natl Acad Sci U S A. 77(6):3534–3538.http://dx.doi.org/10.1073/pnas.77.6.3534 - DOI - PMC - PubMed
    1. Collins RE, Higgs PG.. 2012. Testing the infinitely many genes model for the evolution of the bacterial core genome and pangenome. Mol Biol Evol. 29(11):3413–3425.http://dx.doi.org/10.1093/molbev/mss163 - DOI - PubMed
    1. Croucher NJ, Coupland PG, Stevenson AE, Callendrello A, Bentley SD, Hanage WP.. 2014. Diversification of bacterial genome content through distinct mechanisms over different timescales. Nat Commun. 5:5471.. - PMC - PubMed