. 2017 Dec 5;113(11):2519-2529.
doi: 10.1016/j.bpj.2017.09.028.

Desmoglein 3 Order and Dynamics in Desmosomes Determined by Fluorescence Polarization Microscopy

Affiliations

Desmoglein 3 Order and Dynamics in Desmosomes Determined by Fluorescence Polarization Microscopy

Emily I Bartle et al. Biophys J. .

Abstract

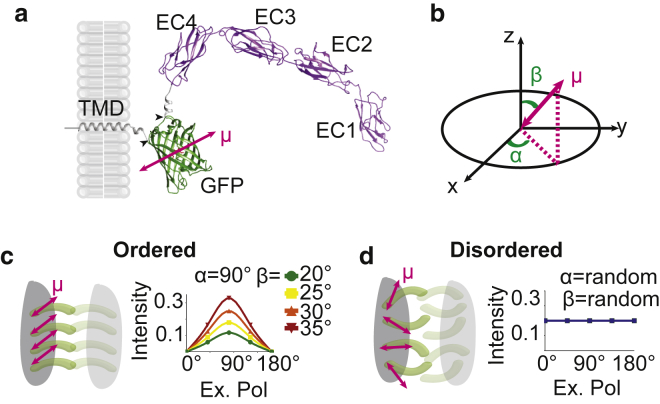
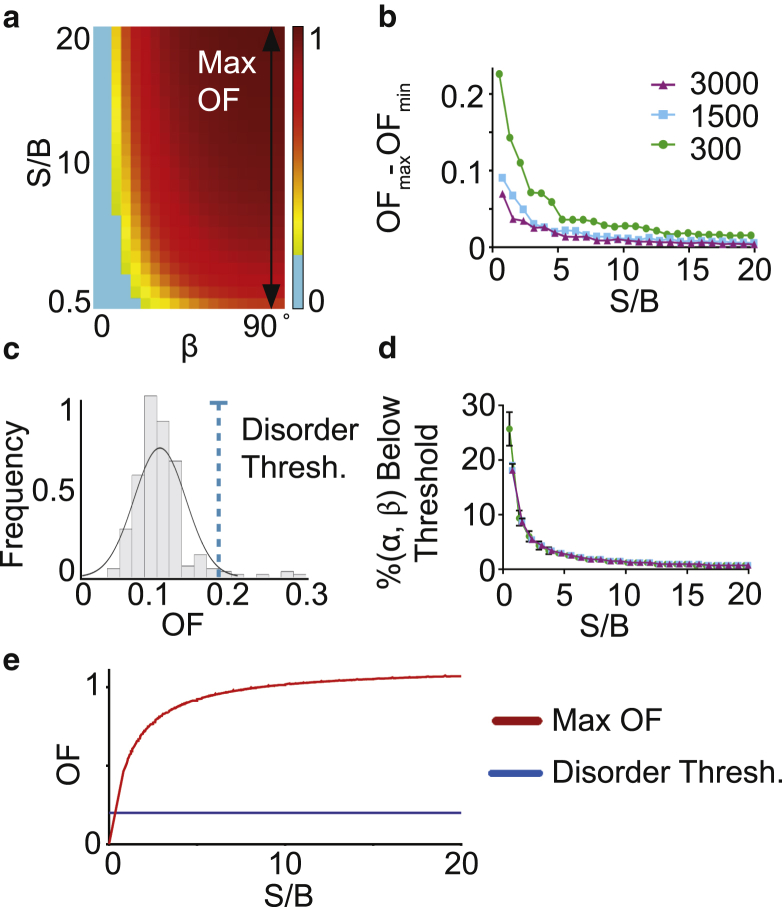
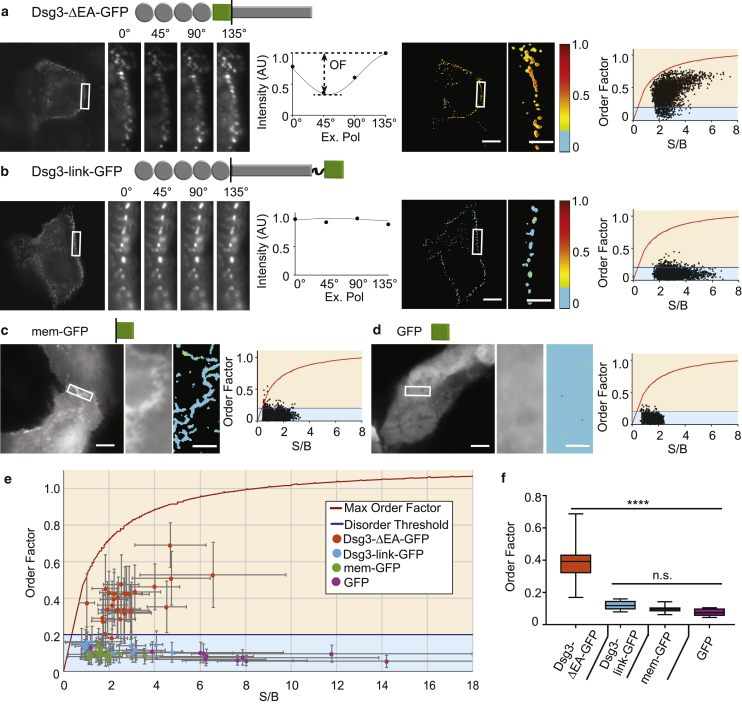
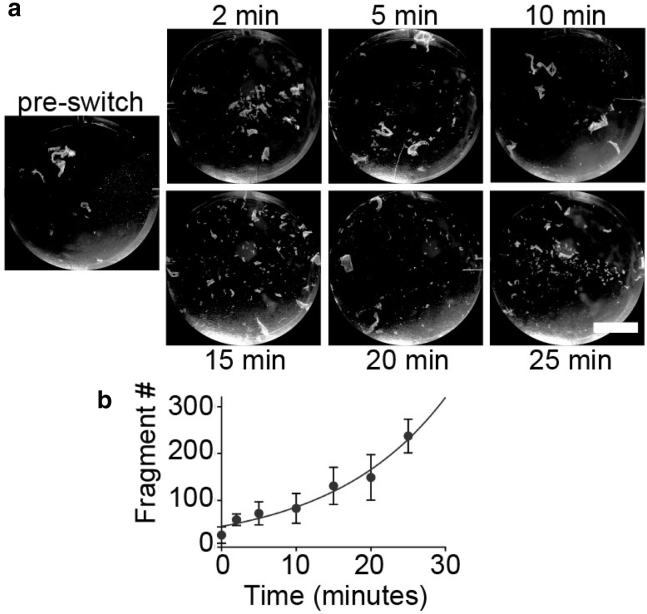
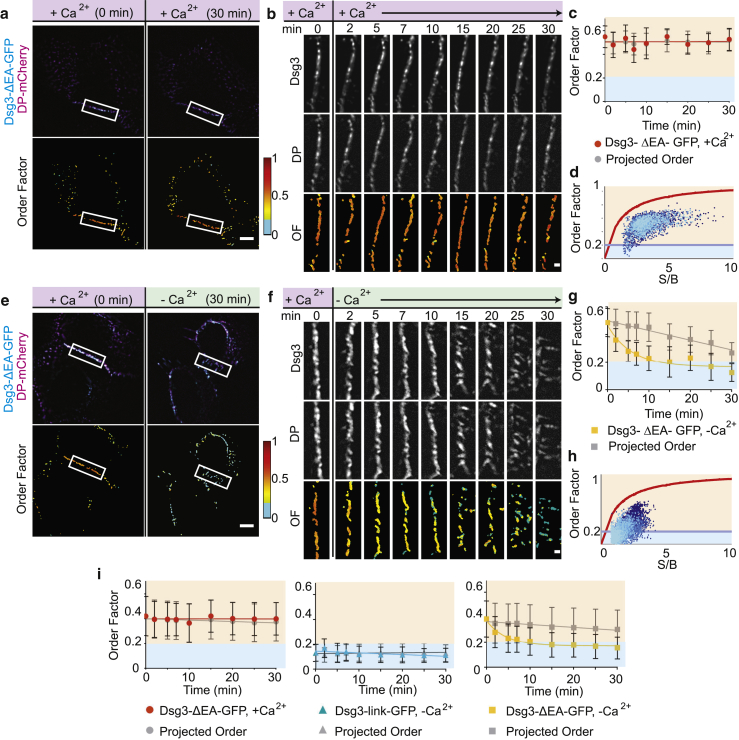
Desmosomes are macromolecular cell-cell junctions that provide adhesive strength in epithelial tissue. Desmosome function is inseparably linked to structure, and it is hypothesized that the arrangement, or order, of desmosomal cadherins in the intercellular space is critical for adhesive strength. However, due to desmosome size, molecular complexity, and dynamics, the role that order plays in adhesion is challenging to study. Herein, we present an excitation resolved fluorescence polarization microscopy approach to measure the spatiotemporal dynamics of order and disorder of the desmosomal cadherin desmoglein 3 (Dsg3) in living cells. Simulations were used to establish order factor as a robust metric for quantifying the spatiotemporal dynamics of order and disorder. Order factor measurements in keratinocytes showed the Dsg3 extracellular domain is ordered at the individual desmosome, single cell, and cell population levels compared to a series of disordered controls. Desmosomal adhesion is Ca2+ dependent, and reduction of extracellular Ca2+ leads to a loss of adhesion measured by dispase fragmentation assay (λ = 15.1 min). Live cell imaging revealed Dsg3 order decreased more rapidly (λ = 5.5 min), indicating that cadherin order is not required for adhesion. Our results suggest that rapid disordering of cadherins can communicate a change in extracellular Ca2+ concentration to the cell, leading to a downstream loss of adhesion. Fluorescence polarization is an effective bridge between protein structure and complex dynamics and the approach presented here is broadly applicable to studying order in macromolecular structures.


Figures

Figure 1
Figure 1
Polarization microscopy to study desmosome protein organization. (a) Shown here is a ribbon diagram of the Dsg3-ΔEA-GFP chimeric protein. Dsg3 extracellular domains EC1-4 (purple) and GFP (green) with the EA domain deletion/GFP insertion sites are indicated by black arrowheads and the transition dipole moment (μ) by the red double-headed arrow. (b) The fluorophore transition dipole (μ; red arrow) is described by azimuthal (α) and polar (β) angles in a spherical coordinate system where x-y is the imaging plane and z is the optical axis. (c) If Dsg3 is ordered, fluorescence intensity will be modulated by the excitation polarization, resulting in a sinusoidal curve with an amplitude dependent on the polar angle as shown for β = 20°, 25°, 30°, and 35°. (d) If Dsg3 is disordered, the fluorescence intensity will be constant regardless of the excitation polarization. To see this figure in color, go online.
Figure 2
Figure 2
Computational modeling and derivation of order factor. (a) Theoretical average order factor was calculated from Monte Carlo simulations at different S/B levels and β orientations averaged over all α (background = 1500 photons). The maximum order factor at each S/B occurs when μ is entirely in the imaging place (β = 90°). (b) Range of order factor (max-min) is given as a function of S/B with varying backgrounds. (c) Given here is a histogram of data from Monte Carlo simulations of disorder showing the maximum order factor resulting from experimental signal and background levels. The threshold for distinguishing order from disorder, shown here by the blue dashed line, was set at 2 SDs above the mean of this distribution. Order factors below this threshold are considered disordered and are shown in cyan on the order factor heatmap. (d) Shown here is percent of (α, β) orientations with an order factor less than the disordered threshold as a function of S/B. (e) Given here is theoretically determined maximum order factor as a function of S/B (red) and the disorder threshold (blue). To see this figure in color, go online.
Figure 3
Figure 3
The extracellular domain of Dsg3 is ordered. Shown here are HaCaT cells expressing (a) Dsg3-ΔEA-GFP and (b) Dsg3-link-GFP. The average intensity image and individual ROIs (white rectangle) at each excitation polarization are shown. The intensity from a single pixel is plotted as a function of excitation polarization and fit to the sinusoid (Eq. 1) (solid line). Desmosome order factor is shown as a masked heatmap. Pixel-by-pixel order factor is plotted as a function of S/B. (c and d) Given here is an average intensity image of the HaCaT cell expressing (c) mem-GFP and (d) GFP. Average intensity and order factor heatmap are shown for the ROI. The pixel-by-pixel order factor is plotted over S/B. (ad) Scale bars, 10 μm; ROI scale bars, 2 μm. (e) Shown here is the mean order factor as a function of mean S/B for individual cells expressing each construct (error bars: SD) compared to the theoretical maximum order factor (red line) and disorder threshold (blue line). (f) Box plots of cell population order factor; full range (whiskers) are given with the median (line) and 25–75 percentile range (box). (∗∗∗∗p < 0.0001; ns = no significance, by one-way ANOVA.) To see this figure in color, go online.
Figure 4
Figure 4
Dynamics of loss of cell adhesion. (a) Given are representative images of HaCaT cell sheets after fragmentation assay at indicated times after calcium switch. Scale bars, 10 mm. (b) Given here is a plot of the fragment count as a function of time after calcium switch (mean ± SD; n = 8). The trendline shows nonlinear (exponential) fit (R2 = 0.97).
Figure 5
Figure 5
Reduction of Ca2+ results in loss of order concurrent with loss of adhesion. (a) HaCaT cells were transfected with Dsg3-ΔEA-GFP (cyan) and DP-mCherry (magenta). Cells were imaged before (0 min) and after an exchange of normal Ca2+ media. Shown are intensity and order factor images for time = 0 and 30 min. Scale bars, 5 μm. (b) Shown here is ROI time lapse of Dsg3-ΔEA-GFP, DP-mCherry, and order factor. Scale bars, 1 μm. (c) Given here is a plot of Dsg3-ΔEA-GFP order factor (red; mean ± SD) and the projected order factor (gray; mean ± SD) as a function of time. (d) Shown here is a pixel-by-pixel order factor plotted as a function of S/B for the ROI over the time course (time progresses from dark to light blue). (e) HaCaT cells were transfected with Dsg3-ΔEA-GFP (cyan) and DP-mCherry (magenta). Intensity and order factor images are shown for time = 0 and 30 min after switch from normal (∼3 mM) to low (∼0.03 mM) Ca2+ media. Scale bars, 5 μm. (f) Shown here is the time lapse of cell border ROI of Dsg3-ΔEA-GFP, DP-mCherry, and order factor showing dynamics after calcium switch. Scale bars, 1 μm. (g) Plot of Dsg3-ΔEA-GFP order factor (yellow; mean ± SD) and the projected order factor (gray; mean ± SD) from the ROI are shown as a function of time. Order factor was fit to an exponential decay (solid line) with the equation y=0.47e5.5t1 (R2 = 0.94). (h) Pixel-by-pixel order factor was plotted as a function of S/B for the ROI over the time course (time progresses from dark to light blue). (i) Population average and projected order factor were plotted as a function of time. The average Dsg3-ΔEA-GFP switch to normal calcium (red; n = 6 cells) and average Dsg3-link-GFP order factor after switch to low calcium (blue; n = 4 cells) were fit by linear regression (solid lines). The average Dsg3-ΔEA-GFP order factor switch to low Ca2+ (n = 8 cells) was fit with an exponential decay y=0.38e4.5t (R2 = 0.97). To see this figure in color, go online.

References

    1. Beck M., Hurt E. The nuclear pore complex: understanding its function through structural insight. Nat. Rev. Mol. Cell Biol. 2017;18:73–89. - PubMed
    1. Xu T., Pagadala V., Mueller D.M. Understanding structure, function, and mutations in the mitochondrial ATP synthase. Microb. Cell. 2015;2:105–125. - PMC - PubMed
    1. Gumbiner B.M. Cell adhesion: the molecular basis of tissue architecture and morphogenesis. Cell. 1996;84:345–357. - PubMed
    1. Atkinson C.E., Mattheyses A.L., Simon S.M. Conserved spatial organization of FG domains in the nuclear pore complex. Biophys. J. 2013;104:37–50. - PMC - PubMed
    1. McQuilken M., Mehta S.B., Gladfelter A.S. Polarized fluorescence microscopy to study cytoskeleton assembly and organization in live cells. Curr. Protoc. Cell Biol. 2015;67:4.29.1–4.29.13. - PMC - PubMed

LinkOut - more resources