. 2018 Feb 12;92(5):e01805-17.
doi: 10.1128/JVI.01805-17. Print 2018 Mar 1.

Factors Leading to the Loss of Natural Elite Control of HIV-1 Infection

Affiliations

Factors Leading to the Loss of Natural Elite Control of HIV-1 Infection

María Pernas et al. J Virol. .

Abstract

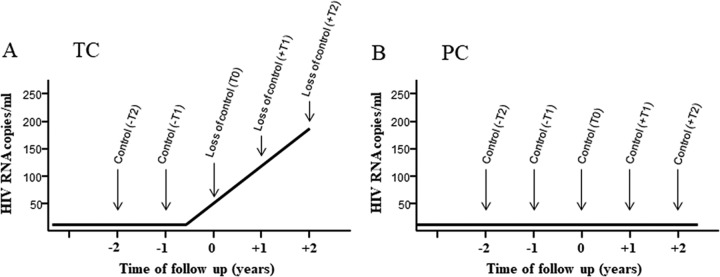
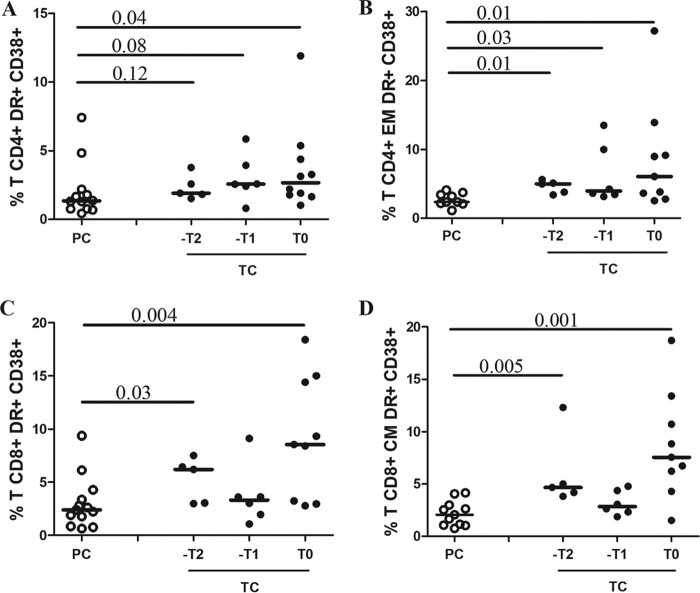
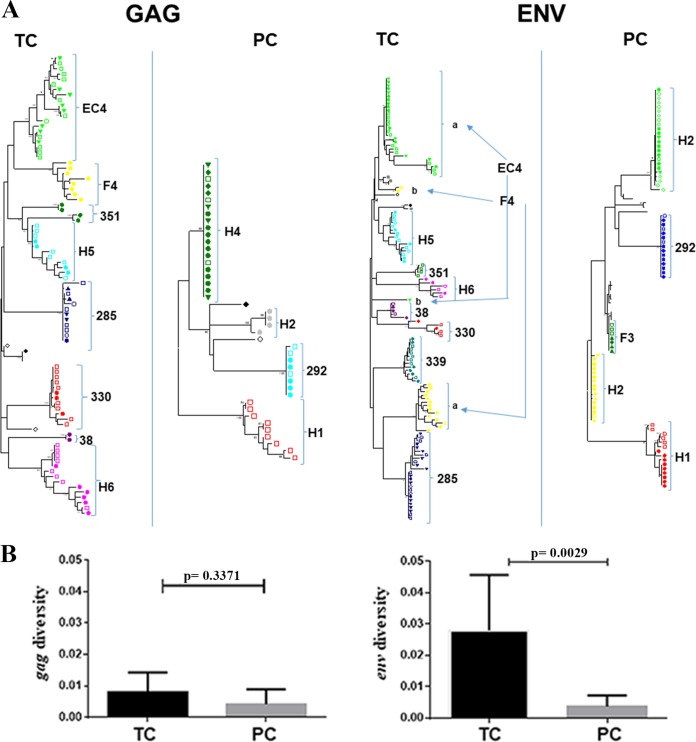
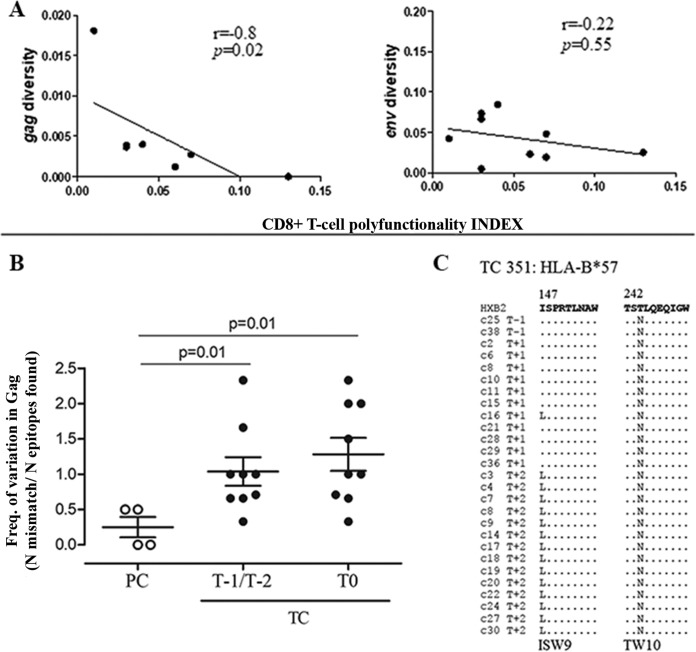
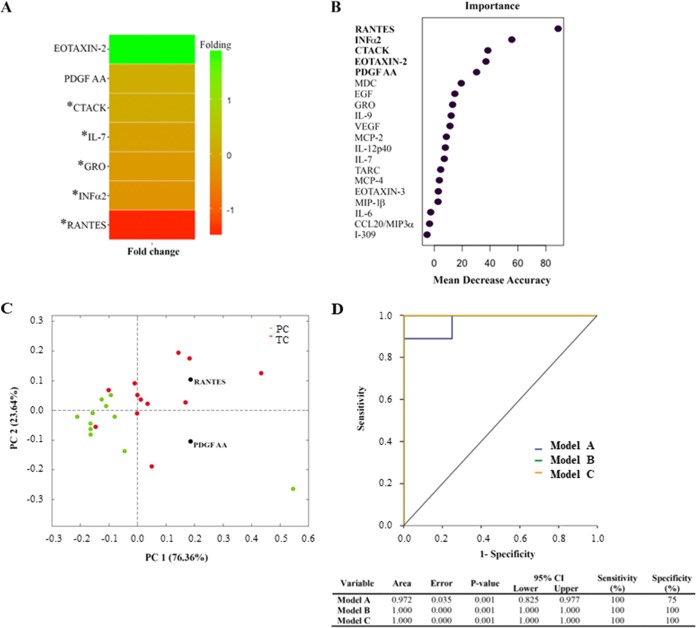
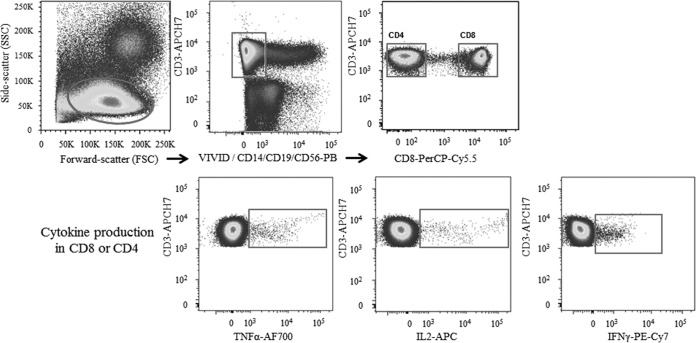
HIV-1 elite controllers (EC) maintain undetectable viral loads (VL) in the absence of antiretroviral treatment. However, these subjects have heterogeneous clinical outcomes, including a proportion that loses HIV-1 control over time. In this work, we compared, in a longitudinal design, transient EC, analyzed before and after the loss of virological control, with persistent EC. The aim was to identify factors leading to the loss of natural virological control of HIV-1 infection with a longitudinal retrospective study design. Gag-specific T-cell responses were assessed by in vitro intracellular polycytokine production quantified by flow cytometry. Viral diversity determinations and sequence dating were performed in proviral DNA by PCR amplification at limiting dilution of env and gag genes. The expression profile of 70 serum cytokines and chemokines was assessed by multiplex immunoassays. We identified transient EC as subjects with low Gag-specific T-cell polyfunctionality, high viral diversity, and high proinflammatory cytokine levels before the loss of control. Gag-specific T-cell polyfunctionality was inversely associated with viral diversity in transient controllers before the loss of control (r = -0.8; P = 0.02). RANTES was a potential biomarker of transient control. This study identified virological and immunological factors, including inflammatory biomarkers associated with two different phenotypes within EC. These results may allow a more accurate definition of EC, which could help in better clinical management of these individuals and in the development of future curative approaches.IMPORTANCE There is a rare group of HIV-infected patients who have the extraordinary capacity to maintain undetectable viral load levels in the absence of antiretroviral treatment, the so-called HIV-1 elite controllers (EC). However, there is a proportion within these subjects that eventually loses this capability. In this work, we found differences in virological and immune factors, including soluble inflammatory biomarkers, between subjects with persistent control of viral replication and EC that will lose virological control. The identification of these factors could be a key point for a right medical care of those EC who are going to lose natural control of viral replication and for the design of future immunotherapeutic strategies using as a model the natural persistent control of HIV infection.

Keywords: HIV-1 controllers; HIV-1 elite controllers; T-cell response; inflammation; inflammatory biomarkers; viral diversity.


Figures

FIG 1
FIG 1
Study design. Schematic representation of the longitudinal and retrospective study design in transient controllers (TC) (A) and persistent controllers (PC) (B). In TC, up to five determinations were performed: two in the “under-control period,” 2 years (−T2) and 1 year (−T1) before the loss of control, and up to three determinations in the “post-loss-of-control period,” including the closest time point to the loss of virological control (T0) and 1 year (+T1) and 2 years (+T2) after the loss of virological control. At least the −T2, −T1, and T0 samples were required for the subject to be included in the study. In total, a maximum of 54 time points were analyzed in this group. In PC, up to five determinations were performed at 1-year intervals, but at least three consecutive time points per subject were required to be included in the study. In total, a maximum of 63 time points were analyzed in this group. For Gag-specific T-cell response assays, all available follow-up time points were tested (PC, n = 14; TC, n = 14). Virological and soluble biomarkers assays were done for all available follow-up time points in the PC (n = 10 and n = 11, respectively) and only at –T2 and –T1 in the TC (n = 9 and n = 12, respectively).
FIG 2
FIG 2
Representative longitudinal Gag-specific T-cell-associated parameters in PC. The T-cell response was defined as the frequency of cells (>0.05% after background subtraction of the unstimulated condition) with detectable IFN-γ, TNF-α, and/or IL-2 intracellular cytokine production after stimulation of cryopreserved PBMCs with Gag overlapped peptides. Gag-specific total CD4+ T-cell response (A), central memory CD4+ T-cell response (B) (CM, CD4 CD45RA CD27), total CD8+ T-cell response (C), and terminally differentiated CD8+ T-cell response (D) (TD, CD8 CD45RA CD27) levels are shown. No statistical differences were obtained throughout the follow-up. NS denotes no significant differences between multiple paired sample comparisons determined by the Wilcoxon signed-rank test (P > 0.05 in all cases). The Friedman test could not be applied due to insufficient statistical power using the five follow-up time points.
FIG 3
FIG 3
CD4+ and CD8+ T-cell Gag-specific responses. The percentages of subjects with Gag-specific CD4+ and CD8+ T-cell responses are shown. (A) The T-cell response was defined as the frequency of cells (>0.05% after background subtraction of the unstimulated condition) with detectable IFN-γ, TNF-α, and/or IL-2 intracellular cytokine production after stimulation of cryopreserved PBMCs with Gag overlapped peptides. (B) Total, central memory (CM; CD4+ CD45RA CD27+), and effector memory (EM; CD4+ CD45RA CD27) Gag-specific CD4+ T-cell levels; (C) total, CM, EM, and terminally differentiated (TD; CD8+ CD45RA+ CD27) Gag-specific CD8+ T-cell levels. Differences between unpaired groups were determined by the Mann-Whitney U and chi-square tests, and differences between paired samples were determined by the Wilcoxon signed-rank test. The Friedman test was not applied due to the small number of paired samples. Only significant differences are shown. *, P < 0.05; **, P < 0.001.
FIG 4
FIG 4
HIV-1-specific CD8+ T-cell polyfunctionality. Polyfunctionality, understood as simultaneous multiple production of IFN-γ, TNF-α, and IL-2 per T cell, was studied only for subjects categorized as responders. The T-cell response was defined as the frequency of cells (>0.05% after background subtraction of the unstimulated condition) with detectable IFN-γ, TNF-α, and/or IL-2 intracellular cytokine production after stimulation. Due to the low number of Gag-specific CD4+ T-cell responders in TC, polyfunctionality analysis was not applicable. (A) Pie charts show polyfunctional distribution of HIV-1-specific CD8+ TD CD57+ T cells with up to three functional responses to Gag stimulation; IFN-γ, TNF-α, and IL-2 production in the polyfunctional distribution is shown in arcs. Pestle and Spice were used for analysis. (B) Percentages of Gag-specific CD8+ T cells expressing the activation profile, CD38+, and the maturation profile, CD45RA CD27+ CD57; only significant differences are shown. (C to E) Polyfunctionality index of Gag-specific total CD8+ T cells. Values from PC and preloss time points of follow-up (–T2 and –T1) in TC are based on the proportions of cells expressing combinations of IFN-γ, TNF-α, and IL-2 (three functions) (C), plus CD107a (four functions) (D), and plus perforin (five functions) (E). Single and double production of CD107a and perforin were excluded from the analyses. Differences between groups were determined by the Mann-Whitney U test.
FIG 5
FIG 5
CD4+ and CD8+ T-cell activation. Percentages of total (A) and effector memory (B) CD4+ HLA-DR+ CD38+ T cells and total (C) and central memory (D) CD8+ HLA-DR+ CD38+ T cells are shown. Differences between unpaired groups were determined by the Mann-Whitney U test. The Friedman test was not applied due to the small number of paired samples. P < 0.15 are shown.
FIG 6
FIG 6
Virological assays: phylogenetic analysis and virus diversity. All virological assays were performed with all time point samples in PC and with only samples from time points prior to the loss of control in TC. Phylogenetic analysis of sequences in env and gag genes from TC and PC during follow-up was done. Sequences were submitted to GenBank under accession numbers MF988754 to MF989105. (A) Phylogenetic trees were estimated by a maximum likelihood approach using the best-fit model of nucleotide substitution (GTR+G+I; jModelTest v.0.1.1) implemented in the MEGA 6 software program. Each subject is represented by a different color. Samples taken at different times are marked with different symbols. In double-infected subjects (EC4 and F4), the two viral populations are marked and labeled a and b. Bars indicate a genetic distance of 0.02. (B) Comparison between intrasample diversity in env and gag regions for TC and PC. The mean and standard errors for all pairwise nucleotide distances were determined using the MEGA 6.0 program. Differences between unpaired groups were determined by the Mann-Whitney U test. **, P < 0.05.
FIG 7
FIG 7
Correlation of virus diversity with CD8+ T-cell polyfunctionality and analysis of Gag CD8+ T-cell epitope variation. (A) Correlations between gag and env diversity and the total CD8+ T-cell three-cytokine polyfunctionality index (pINDEX for three functions) in TC are shown. The Spearman rho correlation coefficient test was used. (B) Analysis of HIV-1 Gag CD8+ T-cell epitope variation. The frequencies (Freq.) of variation in HIV-1 Gag CD8+ T-cell epitopes in PC and TC before and after the loss of virological control are shown. Differences between groups were determined by the Mann-Whitney U test. (C) HIV-1 sequence variation in Gag ISW9 and TW10 epitopes restricted by HLA-B*57 in TC 351 during the follow-up.
FIG 8
FIG 8
Soluble cytokines and chemokines as potential biomarkers of the loss of virological control. Assays were performed with all time point samples in PC and with samples at preloss time points of follow-up (–T2 and –T1) in TC. (A) A fold change heat map of the relative plasma concentrations of measured inflammatory markers is shown. Positive folding (green) means higher concentrations in PC, while negative folding (red) means the opposite. Of these potential biomarkers, the five marked with an asterisk reached a concentration with a P value of <0.05 in the Mann-Whitney U test, and the remaining two were added to the list due to their classification power in the two-multivariate test. (B) Random forest analysis importance plot of the top 20 variables in importance of classification from a total of 70 cytokines and chemokines. Only the top five, highlighted in bold, were considered potential biomarkers. (C) The score plot of the PCA showed that the best percentage of separation between groups was achieved with only two variables, RANTES and PDGF AA. (D) Using logistic regression and receiver operator characteristic (ROC) curves, we assessed three different multimarker models that could accurately predict the loss of control in EC: model A (blue), which includes the statistically significant variables in the Mann-Whitney U test, model B (green), composed of the top five variables obtained from the random forest analysis, and model C (orange), compounded by the two variables obtained in the PCA analysis.
FIG 9
FIG 9
Schematic diagram of the cytometry gating strategy. For gating strategies for Gag-specific CD4+ and CD8+ T cells, the representative plots show the functional cytokine responses to Gag peptides.

References

    1. Lambotte O, Faroudy B, Madec Y, Nguyen A, Goujard C, Meyer L, Rouzioux C, Venet A, Delfraissy J-F, SEROCO-HEMOCO Study Group. 2005. HIV controllers: a homogeneous group of HIV-1 infected patients with a spontaneous control of viral replication. Clin Infect Dis 41:1053–1056. doi: 10.1086/433188. - DOI - PubMed
    1. Shasha D, Walker BD. 2013. Lessons to be learned from natural control of HIV—future directions, therapeutic, and preventive implications. Front Immunol 4:1–8. doi: 10.3389/fimmu.2013.00162. - DOI - PMC - PubMed
    1. Pereyra F. 2010. The major genetic determinants of HIV-1 control affect HLA class I peptide presentation. Science 330:1551–1557. doi: 10.1126/science.1195271. - DOI - PMC - PubMed
    1. Migueles SA, Osborne CM, Royce C, Compton AA, Joshi RP, Weeks KA, Rood JE, Berkley AM, Sacha JB, Cogliano-Shutta NA, Lloyd M, Roby G, Kwan R, McLaughlin M, Stallings S, Rehm C, O'Shea MA, Mican J, Packard BZ, Komoriya A, Palmer S, Wiegand AP, Maldarelli F, Coffin JM, Mellors JW, Hallahan CW, Follman DA, Connors M. 2008. Lytic granule loading of CD8+ T cells is required for HIV-infected cell elimination associated with immune control. Immunity 29:1009–1021. doi: 10.1016/j.immuni.2008.10.010. - DOI - PMC - PubMed
    1. Machmach K, Leal M, Gras C, Viciana P, Genebat M, Franco E, Boufassa F, Lambotte O, Herbeuval JP, Ruiz-Mateos E. 2012. Plasmacytoid dendritic cells reduce HIV Production in elite controllers. J Virol 86:4245–4252. doi: 10.1128/JVI.07114-11. - DOI - PMC - PubMed

Publication types