. 2017 Dec 6;8(1):1961.
doi: 10.1038/s41467-017-01867-9.

Human CD26high T cells elicit tumor immunity against multiple malignancies via enhanced migration and persistence

Affiliations

Human CD26high T cells elicit tumor immunity against multiple malignancies via enhanced migration and persistence

Stefanie R Bailey et al. Nat Commun. .

Abstract

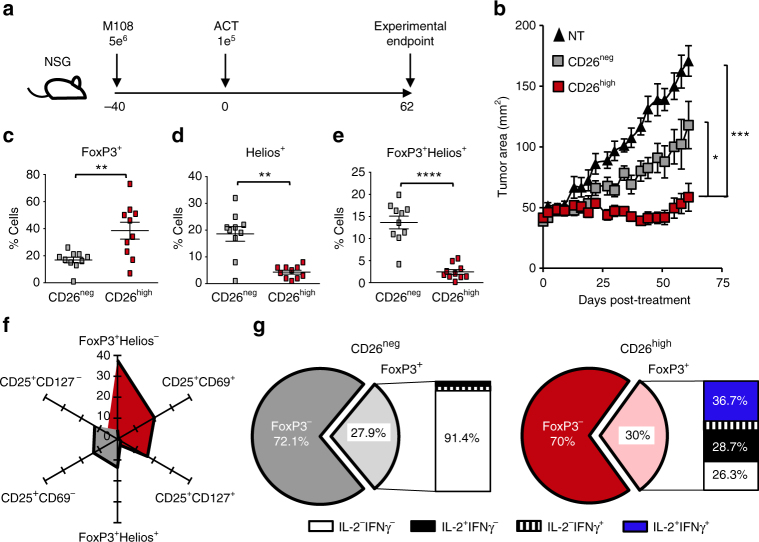
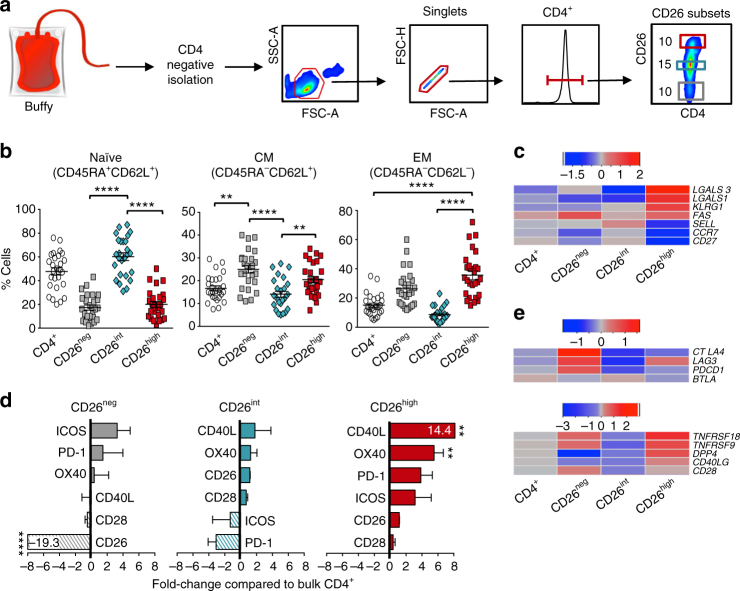
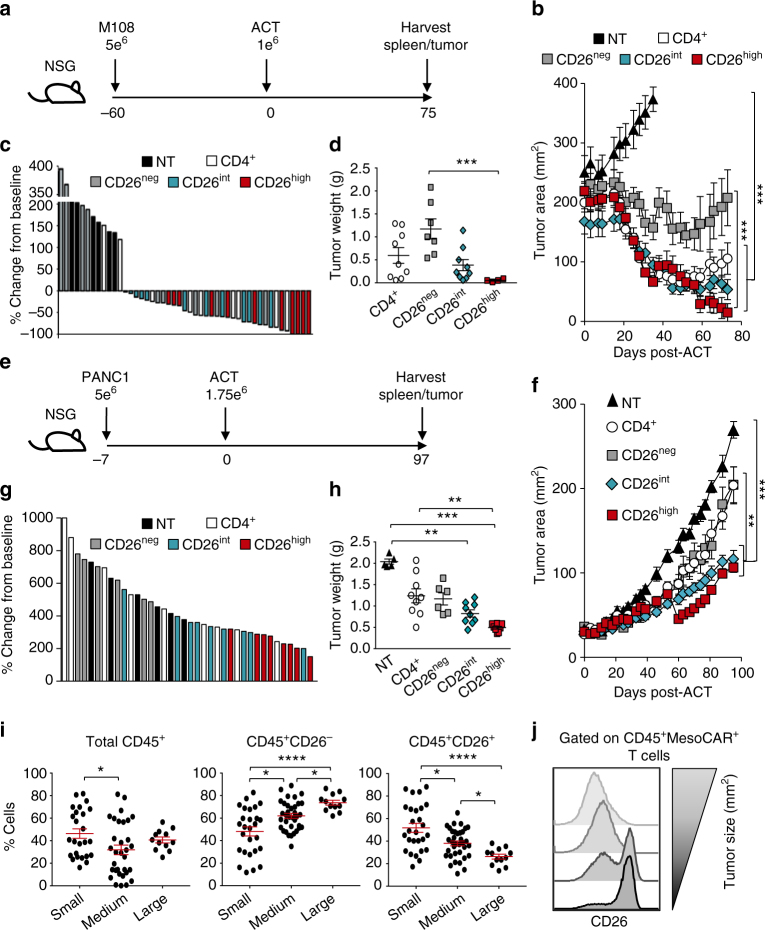
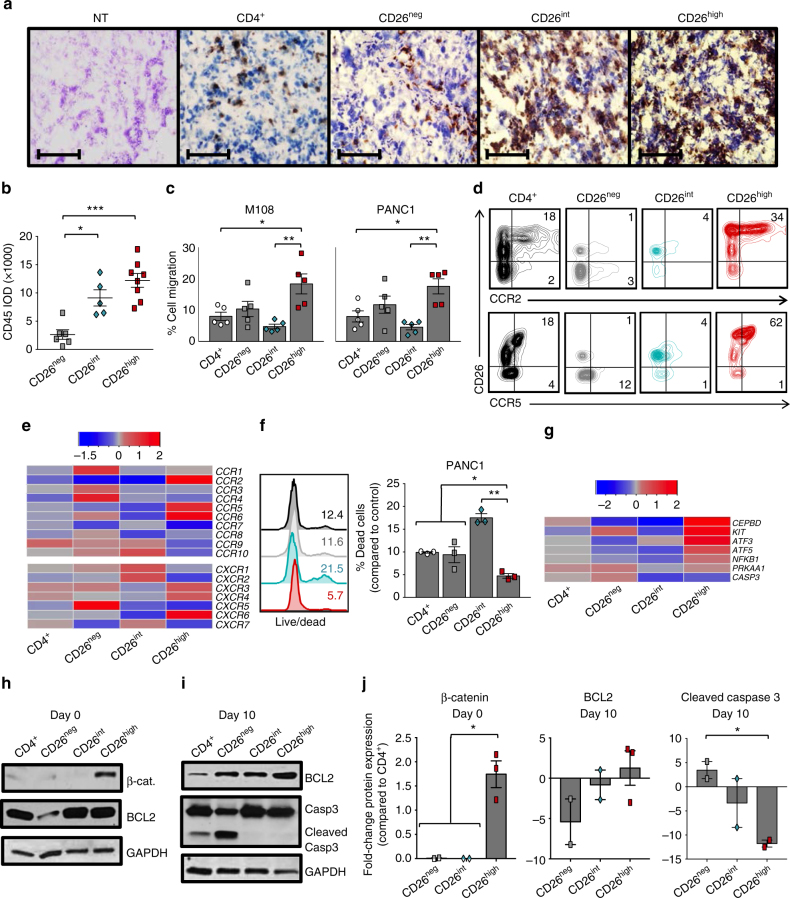
CD8+ T lymphocytes mediate potent immune responses against tumor, but the role of human CD4+ T cell subsets in cancer immunotherapy remains ill-defined. Herein, we exhibit that CD26 identifies three T helper subsets with distinct immunological properties in both healthy individuals and cancer patients. Although CD26neg T cells possess a regulatory phenotype, CD26int T cells are mainly naive and CD26high T cells appear terminally differentiated and exhausted. Paradoxically, CD26high T cells persist in and regress multiple solid tumors following adoptive cell transfer. Further analysis revealed that CD26high cells have a rich chemokine receptor profile (including CCR2 and CCR5), profound cytotoxicity (Granzyme B and CD107A), resistance to apoptosis (c-KIT and Bcl2), and enhanced stemness (β-catenin and Lef1). These properties license CD26high T cells with a natural capacity to traffic to, regress and survive in solid tumors. Collectively, these findings identify CD4+ T cell subsets with properties critical for improving cancer immunotherapy.


Conflict of interest statement

S.R.B, M.H.N. and C.M.P. have a provisional patent for the use of CD26high T cells for adoptive cell transfer therapy. The remaining authors declare no competing financial interests.

Figures

Fig. 1
Fig. 1
Human CD26high T cells are activated and display antitumor activity. CD4+ lymphocytes were isolated from healthy donor PBMCs, sorted by CD26 expression and stimulated with magnetic beads coated with CD3 and ICOS agonists (cultured at a ratio of 1 bead to every 5 T cells). T cells were transduced 36 h post-activation with a lentiviral vector encoding a first generation chimeric antigen receptor that recognizes mesothelin and stimulates the CD3ζ domain. These cells were expanded for 10 days with IL-2 (100 IU/ml). a, b NSG mice were subcutaneously injected with 5e6 M108 mesothelioma cells. Forty days post-M108 establishment, mice were intravenously infused with 1e5 human CD26neg or CD26high T cells redirected to express MesoCAR. Tumors were measured bi-weekly (N = 10 mice per group). P values for the tumor curve were calculated by one-way ANOVA with a Kruskal-Wallis comparison using final tumor measurements from day 62. c–g Graphical representations of transcription factors (c–f N = 10) and cytokine production (g N = 3) by sorted T cells isolated from multiple healthy individuals prior to bead stimulation. In g, the frequency of FoxP3+ cells from the enriched CD26neg or CD26high cultures secreting inflammatory cytokines were assayed by flow cytometry. P values for c-e were calculated using a Mann-Whitney U Test. Data with error bars represent mean ± SEM. *P  < 0.05; **P < 0.01; ***P < 0.001; ****P < 0.0001
Fig. 2
Fig. 2
CD26int T cells are naive, whereas CD26neg/CD26high T cells are differentiated. a Sorting strategy: CD4+ T cells were isolated from buffy coats from healthy individuals and FACS-sorted into bulk CD4+, CD26neg (bottom ~ 10%), CD26int (middle ~15%), and CD26high (top ~10%). b, c Memory phenotype for all subsets was determined using flow cytometry (b N = 26) and gene array analysis (c N = 3–5) prior to bead stimulation. For c, RNA was isolated and gene expression assessed by OneArray. Heat map displays (+/−) log2-fold change in memory-associated genes. d, e Graphical representation of co-stimulatory and co-inhibitory markers determined by flow cytometry (d N = 20–26) and gene array (e N = 3–5) prior to bead stimulation. Surface marker expression in d was calculated and graphed as a fold change of CD26neg, CD26int, and CD26high T cells compared to bulk CD4+P values were calculated using a One-way ANOVA with a Kruskal Wallis comparison. Error bars represent mean ± SEM. **P < 0.01; ****P < 0.0001
Fig. 3
Fig. 3
CD26 defines CD4+ T cells with naive, helper, or regulatory properties. CD4+ T cells were isolated from healthy donors and sorted by CD26 expression (Fig. 2a). Representative FACS plots (a) and phenotype data (b N = 26) from multiple healthy individuals. c Heat map of (+/−) log2-fold change in expression of CD4+ subset-associated genes (N = 3–5) prior to bead stimulation. d, e Human CD4+ T cells were sorted into bulk CD4+, CD26neg, CD26int, CD26high, Th1 (CXCR3+CCR6), Th2 (CCR4+CCR6), Th17 (CCR6+CCR4+), and Th1/Th17 (CXCR3+CCR6+). DNA was isolated from sorted T cells prior to expansion of TCRβ sequences using an immunoSEQ kit and subsequent analysis. Data shown is the percent TCRβ overlap between groups (d) and a Venn diagram (e) displaying the overlap frequencies of identical TCRβ sequences between CD26neg, CD26int, CD26high, and Th1/Th17 subsets (N = 4). P values for b and d were calculated using one-way ANOVA with a Kruskal-Wallis comparison. Error bars represent mean ± SEM. *P < 0.05; **P < 0.01; ****P < 0.0001
Fig. 4
Fig. 4
CD26high T cells are multi-functional and enzymatically active. CD4+ T cells from healthy individuals were isolated and sorted by CD26 expression (Fig. 2a). a, b Sorted T cells were activated with PMA/Ionomycin and Monensin for 4 h prior to intracellular staining (N = 26). In b, three independent donors were analyzed by FlowJo software and graphed to display the percentage of cells simultaneously secreting 1–5 cytokines (IL-2, IFNγ, TNFα, IL-17A, IL-22). c Supernatant was collected from cells at pre-activation (0) and 1, 6, and 12 days post-activation time points for ELISA (N = 2; data shown is representative of two individual experiments). d T cells activated in vitro were subjected to intracellular staining (N = 5–11). e 1e5 sorted cells per group from pre-activation (0) and 10 days post-activation were cultured with the CD26 ligand gly-pro-P-nitroanalide for 2 h at 37 °C and analyzed for colorimetric changes to determine enzymatic activity (N = 5). P values in a and e were calculated by One-way ANOVA with a Kruskal-Wallis comparison. Error bars represent mean ± SEM. *P < 0.05; **P < 0.01; ***P < 0.001; ****P < 0.0001
Fig. 5
Fig. 5
Human CD26int and CD26high T cells regress/slow established tumors. CD4+ T cells were isolated from healthy individuals, sorted by CD26 expression, transduced to express MesoCAR, and expanded for 10 days. a, b NSG mice bearing large M108 mesothelioma tumor (established for 60 days) were infused with 1e6 human CD4+, CD26neg, CD26int, or CD26high T cells. Post-ACT, tumors were measured bi-weekly until mice were killed and organs harvested at 75 days post-ACT (N = 7–9 mice per group). P values for the tumor curve were calculated by one-way ANOVA with a Kruskal-Wallis comparison on the final day when mice from all comparison groups were still alive (NT vs. all groups = day 38; CD26neg vs. CD26high = day 59). c Percent change in tumor size from baseline (day 0) to endpoint (day 75) was calculated and graphed as a Waterfall plot. d Graphical representation of tumor weights (g) harvested from treated mice 75 days post-ACT. e, f NSG mice bearing established pancreatic tumors (PANC1) were infused with 1.75e6 human CD4+, CD26neg, CD26int, and CD26high T cells and tumors were measured bi-weekly for more than 3 months (N = 6–9 mice per group). P values for the tumor curve were calculated by one-way ANOVA with a Kruskal-Wallis comparison on the final day when mice from all comparison groups were still alive (All groups = day 84). g Graphical representation of tumor weight (g) harvested from mice 97 days post-ACT. hj Tumors from all treated mice were harvested, digested, and run through a strainer. Resulting cell suspension was stained for flow cytometry and graphed relative to tumor size (small <100 mm2, medium = 100–200 mm2, large >200 mm2). P values for d, h and i were calculated by one-way ANOVA with a Kruskal-Wallis component. Data with error bars represent mean ± SEM. *P < 0.05; **P < 0.01; ***P < 0.001; ****P < 0.0001
Fig. 6
Fig. 6
CD26high T cells have stemness and increased migratory capacity. a, b Tumors from treated PANC1-bearing mice (from Fig. 5) were harvested and then frozen in cryomatrix. Tumor samples were then sliced and used for immunohistochemistry analysis (purple = H&E, brown = CD45; N = 5–9 tumors per group). Magnification = ×10. In b, the integrated optical density (IOD) of CD45 in CD26-sorted groups was quantified with ImageJ software and graphed (N = 5–8 per group). c Sorted T cells were activated with CD3/ICOS beads and expanded in 100 IU/ml IL-2 for 10 days prior to testing cell migration via a transwell assay. 0.75e6 sorted cells were re-suspended and assessed for percent cell migration towards M108 or PANC1 supernatant in a 2 h time period (N = 5). d, e Sorted T cells were analyzed for chemokine receptor expression by flow cytometry (d N = 12–15) and gene array (e N = 3–5) prior to bead stimulation. In e, data shown in heat map as (+/−) log2-fold change in chemokine receptor expression compared to bulk CD4+. f Viability of T cells that migrated towards PANC1 was determined by live/dead staining (N = 3). g Anti-apoptotic and stemness genes were analyzed and displayed as a (+/−) log2-fold change compared to bulk CD4+ (N = 3–5). hj Protein from pre-activation (day 0) and post-activation (day 10) cells was isolated and used for western blot analysis (N = 2–3). In j, the fold change of β-catenin, BCL2 and cleaved Caspase-3 for each subset compared to bulk CD4+ T cells was graphed (N = 2–3). P values were calculated using a One-way ANOVA with a Kruskal-Wallis comparison. Data with error bars represent mean ± SEM. *P < 0.05; **P < 0.01; ***P < 0.001
Fig. 7
Fig. 7
CD26 identifies three CD4+ T cell subsets with distinct properties. Depiction of our observations on CD26 expression and cellular therapy described herein. CD26neg T cells, despite their enhanced capacity to migrate, fail to regress tumors due to regulatory properties, decreased persistence, and increased sensitivity to cell death. CD26int and CD26high T cells exhibit similar antitumor activity, but have vastly different immunological properties. Despite their decreased migration, CD26int T cells are naive and capable of persisting long-term. CD26high T cells, despite their differentiated phenotype, exhibit several anti-apoptotic and stemness features, persist long-term, co-secrete multiple cytokines, and cytotoxic molecules and have a natural capacity to migrate towards various established solid tumors

References

    1. Topalian SL, et al. Survival, durable tumor remission, and long-term safety in patients with advanced melanoma receiving nivolumab. J. Clin. Oncol. 2014;32:1020–1030. doi: 10.1200/JCO.2013.53.0105. - DOI - PMC - PubMed
    1. Pedicord VA, Montalvo W, Leiner IM, Allison JP. Single dose of anti-CTLA-4 enhances CD8+ T cell memory formation, function, and maintenance. Proc. Natl Acad. Sci. USA. 2011;108:266–271. doi: 10.1073/pnas.1016791108. - DOI - PMC - PubMed
    1. June CH. Adoptive T cell therapy for cancer in the clinic. J. Clin. Invest. 2007;117:1466–1476. doi: 10.1172/JCI32446. - DOI - PMC - PubMed
    1. Morgan RA, et al. Cancer regression and neurological toxicity following anti-MAGE-A3 TCR gene therapy. J. Immunother. 2013;36:133–151. doi: 10.1097/CJI.0b013e3182829903. - DOI - PMC - PubMed
    1. Robbins PF, et al. Tumor regression in patients with metastatic synovial cell sarcoma and melanoma using genetically engineered lymphocytes reactive with NY-ESO-1. J. Clin. Oncol. 2011;29:917–924. doi: 10.1200/JCO.2010.32.2537. - DOI - PMC - PubMed

Publication types

MeSH terms