

Automated Interpretation and Extraction of Topographic Information from Time of Flight Secondary Ion Mass Spectrometry Data
- PMID: 29213083
- PMCID: PMC5719033
- DOI: 10.1038/s41598-017-17049-y
Automated Interpretation and Extraction of Topographic Information from Time of Flight Secondary Ion Mass Spectrometry Data
Abstract
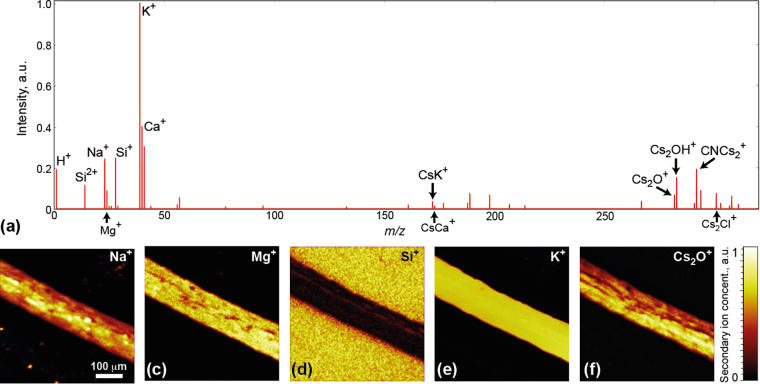
Time of flight secondary ion mass spectrometry (ToF-SIMS) is a powerful surface-sensitive characterization tool allowing the imaging of chemical properties over a wide range of organic and inorganic material systems. This technique allows precise studies of chemical composition with sub-100-nm lateral and nanometer depth spatial resolution. However, comprehensive interpretation of ToF-SIMS results is challenging because of the very large data volume and high dimensionality. Furthermore, investigation of samples with pronounced topographical features is complicated by systematic and measureable shifts in the mass spectrum. In this work we developed an approach for the interpretation of the ToF-SIMS data, based on the advanced data analytics. Along with characterization of the chemical composition, our approach allows extraction of the sample surface morphology from a time of flight registration technique. This approach allows one to perform correlated investigations of surface morphology, biological function, and chemical composition of Arabidopsis roots.
Conflict of interest statement
The authors declare that they have no competing interests.
Figures


References
-
- Chabala JM, et al. High-resolution chemical imaging with scanning ion probe SIMS. Int. J. Mass Spectrom. 1995;143:191–212. doi: 10.1016/0168-1176(94)04119-R. - DOI
Publication types
LinkOut - more resources
Full Text Sources
Other Literature Sources
