. 2017 Dec 6;8(1):1970.
doi: 10.1038/s41467-017-02037-7.

Developmental nonlinearity drives phenotypic robustness

Affiliations

Developmental nonlinearity drives phenotypic robustness

Rebecca M Green et al. Nat Commun. .

Abstract

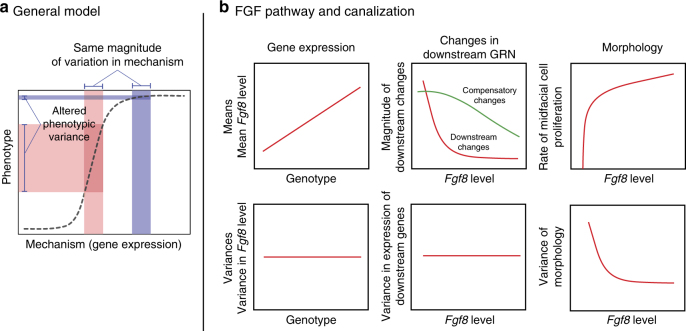
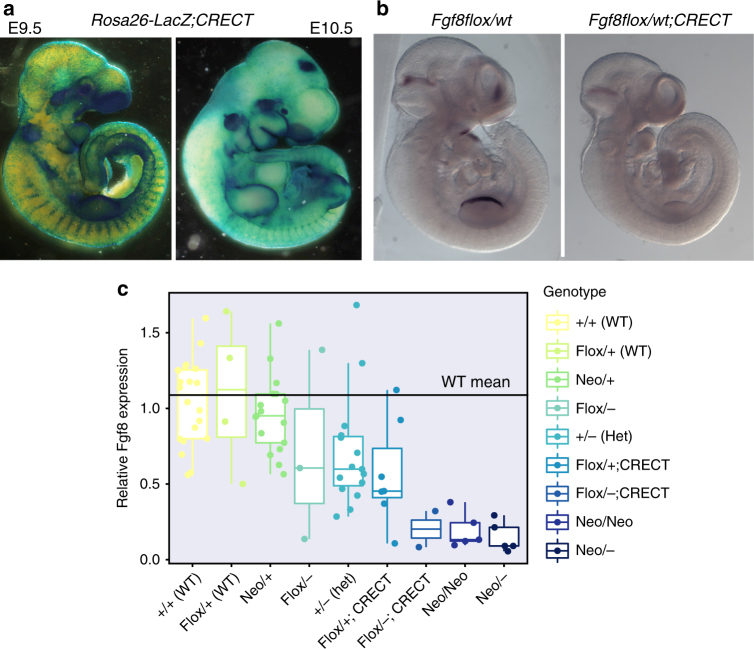
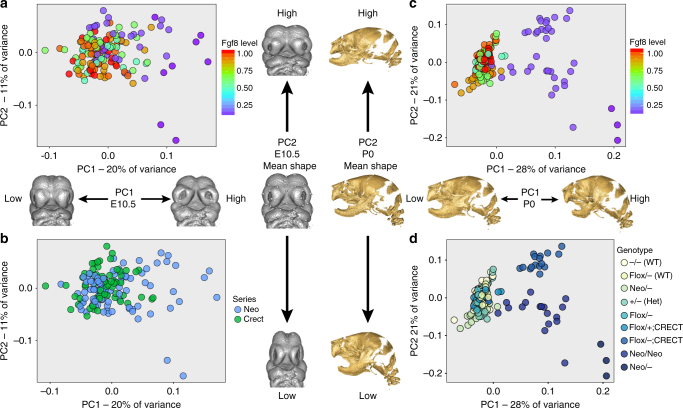
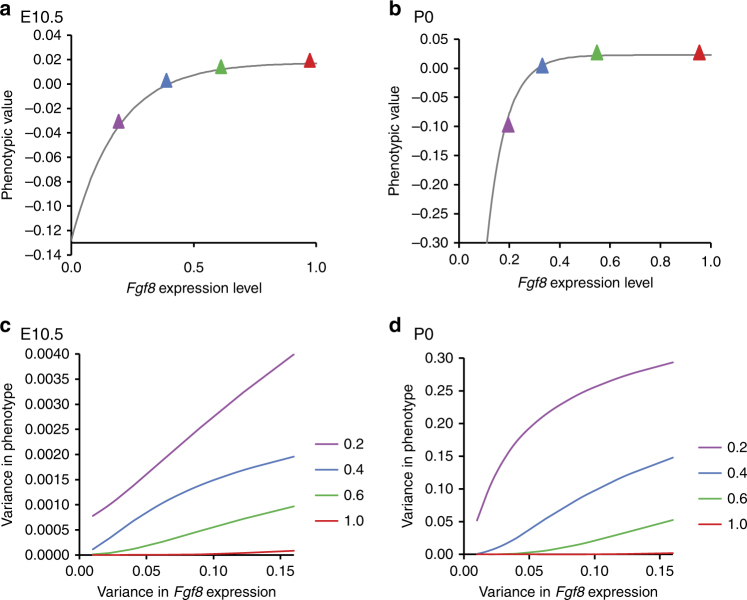
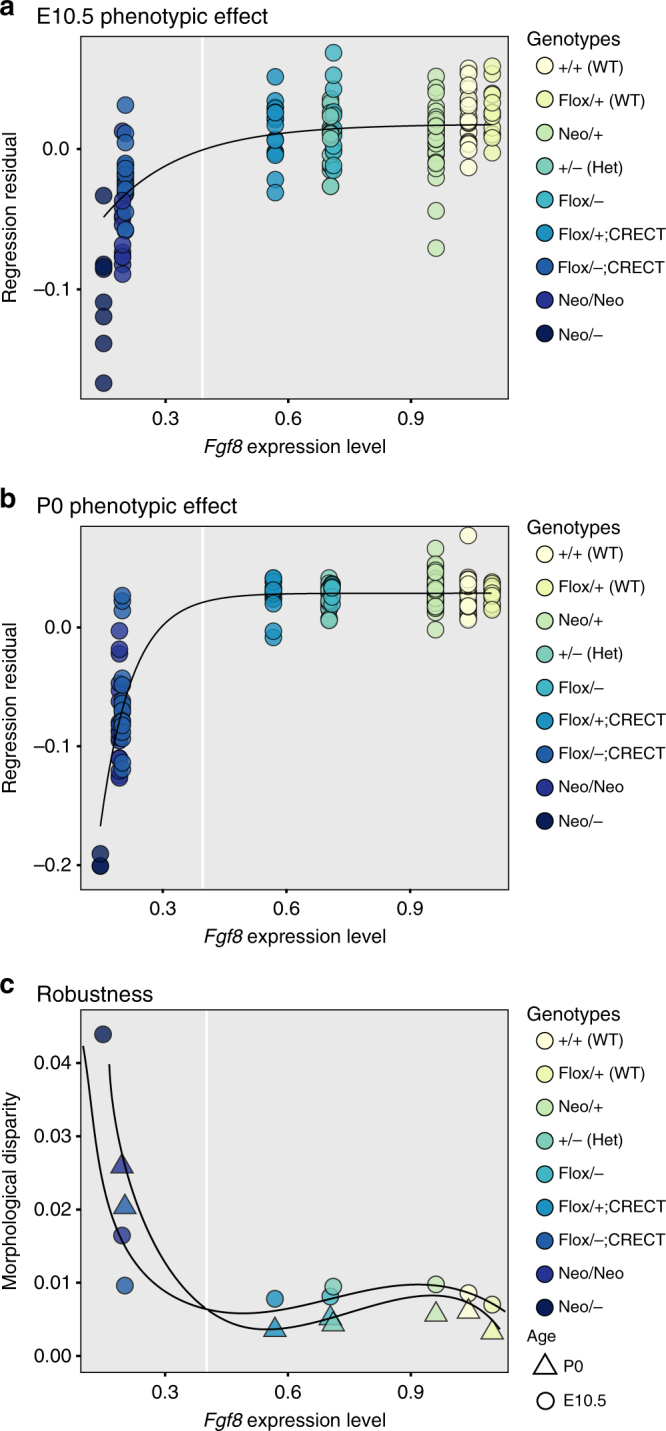
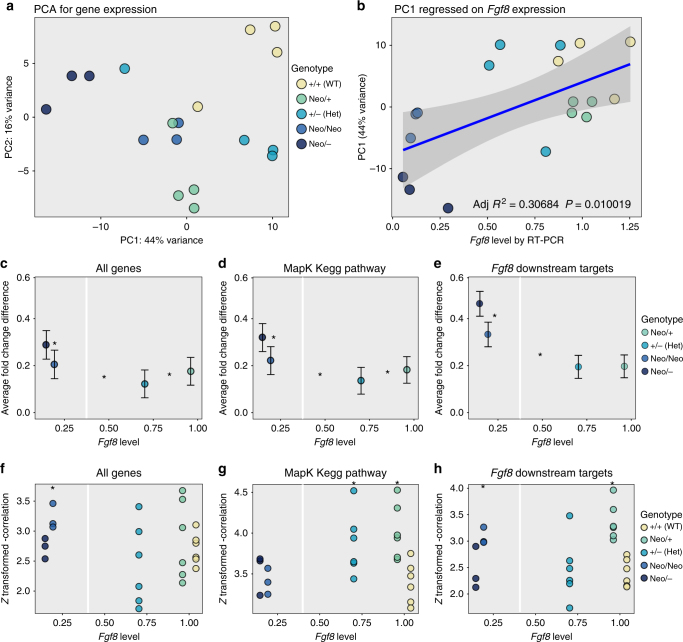
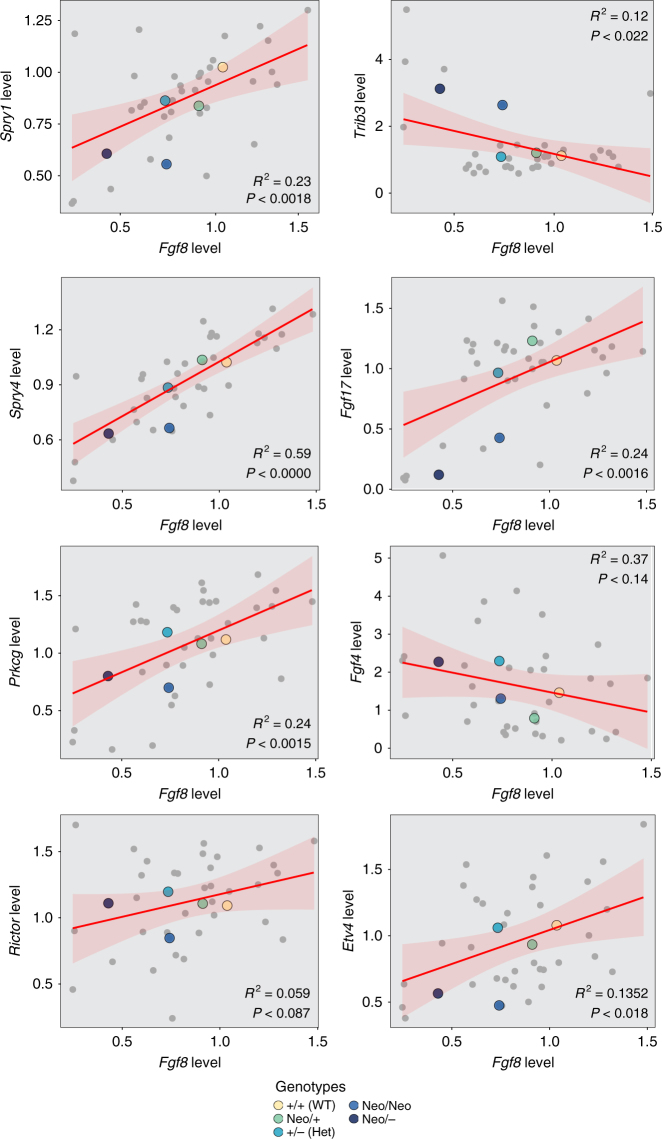
Robustness to perturbation is a fundamental feature of complex organisms. Mutations are the raw material for evolution, yet robustness to their effects is required for species survival. The mechanisms that produce robustness are poorly understood. Nonlinearities are a ubiquitous feature of development that may link variation in development to phenotypic robustness. Here, we manipulate the gene dosage of a signaling molecule, Fgf8, a critical regulator of vertebrate development. We demonstrate that variation in Fgf8 expression has a nonlinear relationship to phenotypic variation, predicting levels of robustness among genotypes. Differences in robustness are not due to gene expression variance or dysregulation, but emerge from the nonlinearity of the genotype-phenotype curve. In this instance, embedded features of development explain robustness differences. How such features vary in natural populations and relate to genetic variation are key questions for unraveling the origin and evolvability of this feature of organismal development.


Conflict of interest statement

The authors declare no competing financial interests.

Figures

Fig. 1
Fig. 1
Nonlinearities at multiple levels across development modulate variance. a General model of a nonlinear genotype–phenotype map where the amount of a particular developmental process (e.g., cell survival, proliferation, and Fgf signaling) determines mean phenotype. Note that the same amount of variation in the mechanism (“wild-type” gene expression—blue vertical bar, “mutant” gene expression—red vertical bar) can generate vastly different amounts of phenotypic variation. This model yields a canalized region where variance is buffered (“wild-type” shape variation, blue horizontal bar) and an area where canalization is lost (“mutant” shape variation, red horizontal bar). b Hypothetical model of how nonlinear genotype–phenotype relationships are generated at multiple biological levels. The top left panel shows that gene expression will relate linearly to cranial phenotype. The top mid panel shows that changes in the gene regulatory network (GRN) downstream to Fgf8 respond either nonlinearly, driving change in the phenotypic mean (red line), or act in a compensatory manner, buffering the effect of variation in Fgf8 (green line). The top right panel shows that morphology will relate nonlinearly to Fgf8 level, potentially due to nonlinear changes in the underlying cell biological processes. Variances are influenced at the level at which the nonlinearity arises (lower panels)
Fig. 2
Fig. 2
Generation of the allelic series. a E9.5 and E10.5 expression of CRECT as detected by crossing CRECT males with B6;129S4-Gt(ROSA)26Sortm1Sor/J (R26R) females and staining the embryos for beta-galactosidase expression. Note the thin layer of blue present over the entire embryo showing the ectodermal CRE expression. b In situ hybridization showing regions of decreased Fgf8 in the E10.0 Fgf8flox/flox;Crect embryos. c qRT-PCR of cranial tissue showing Fgf8 levels by genotype; sample size is between 2 and 22 samples per group. The box represents 1.5× the interquartile range of the data. Allelic series for Fgf8 generates gradual loss of Fgf8 mRNA. Data shown is the delta–delta-CT value, where data were normalized against the mean delta-CT for the WT group. The homozygous null is not included as it is lethal
Fig. 3
Fig. 3
Shape changes in response to decreased Fgf8 gene dosage. Principal component analysis (PCA) of shape at E10.5 (a, b) and P0 (c, d). Gray embryos (E10.5) show shape change trajectories for PC1 (horizontal) and PC2 (vertical), and the middle vertical image represents the mean shape for each time point. Gold skulls show the same shape change trajectories for the P0 data. a, c PC plots colored by Fgf8 level with warm colors representing wild-type embryos and cool colors and purples showing around 20% Fgf8 mRNA expression (mean per group by qRT-PCR). b Coloration by genotypic series, genotypes separate by allelic series, but the differences between low PC1 and low PC2 are small. The mean shape of individual genotypes is already significantly different (Procrustes permutation test, P <0.001) by E10.5. d Coloration by genotype as used in the rest of the paper. A total of 187 neonates were analyzed and divided between groups as follows: WT (+/+) = 22, Flox/+ = 29, Neo/+ = 41, Flox/− = 10, ± = 25, Flox/+;Crect = 21, Flox/−;Crect = 19, Neo/Neo = 17, and Neo/− = 3 (w/all landmarks present). A total of 156 embryos were analyzed and divided between groups as follows: WT (+/+) = 27, Flox/+ = 15, Neo/+ = 30, Flox/− = 13, ± = 16, Flox/+;Crect = 16, Flox/−;Crect = 19, Neo/Neo = 12, and Neo/− = 8
Fig. 4
Fig. 4
Mathematical modeling of phenotypic variance. a, b Fitting the shape data (regression residuals) to a nonlinear, von Bertalanffy growth curve. Colored dots highlight the location on curves of four gene expression values that are modeled in b, c. Least-squares regression models the curve as z = 0.01765−(0.01765–(−0.12787))e(−5.3003*x) at E10.5 (A) and z = 0.0288–(0.0288–(−1.333))e(−13.049*x) at P0. c, d Predicted relationship between the variance of Fgf8 expression and phenotypic variance at four different levels of Fgf8 expression. Expression levels were not extrapolated below zero. This led to the use of truncated normal distributions for expression variance and is responsible for the nonlinearities in c, d
Fig. 5
Fig. 5
Shape and shape variance relate nonlinearly to Fgf8 mRNA expression. Shape is defined using the common allometric component of shape (CAC). a, b Multivariate regression of shape on Fgf8 level at a E10.5 and b P0. The black line shows the von Bertalanffy curve modeled in Fig. 4. c Variance as calculated by the Procrustes variance or morphological disparity,. The white vertical line shows an apparent threshold near 40% of wild-type Fgf8 level. P values between groups are shown in Supplementary Table 2
Fig. 6
Fig. 6
Gene expression changes across the Fgf8 allelic series. a PC 1 and 2 plot of RNAseq data (18 samples). No differences in dispersion are observed between groups. b Relationship between PC1 of the RNAseq data and Fgf8 level for each sample as quantified by RT-PCR. The blue line shows the line of best fit, gray shows the 20% error around the line. ce Average absolute value fold change (dot) and average absolute value standard error of the fold change (error bar) between each mutant genotype and wild type, c all measured genes, d MapK Kegg gene list (174 genes), and e Fgf8 downstream targets (15 genes). The asterisk represents P <0.05 (bootstrap resampling) between nearest-neighbor groups (shown between the groups). The white vertical line shows an Fgf8 level of ∼40%. fh Z-transformed covariance between each embryo within a genotype on f all genes, g MapK Kegg gene list (174 genes), and h 15 known Fgf8 downstream targets (Supplementary Table 3). The asterisk represents P <0.05 (bootstrap resampling) between group and wild type
Fig. 7
Fig. 7
RT-PCR validation of correlation eight genes with Fgf8 level. Thirty-seven samples from across the genotypes were analyzed for each of the eight genes plus Fgf8 and modeled for a linear relationship. The linear relationship is shown in red (line±SE shaded). R 2 values and the adjusted P values from the linear model are shown

References

    1. Waddington CH. The canalisation of development and the inheritance of acquired characters. Nature. 1942;150:563–565. doi: 10.1038/150563a0. - DOI
    1. Waddington CH. Genetic assimilation of the bithorax phenotype. Evolution. 1956;10:1–13. doi: 10.1111/j.1558-5646.1956.tb02824.x. - DOI
    1. Waddington, C. H. The Strategy of the Genes (MacMillan Company, New York, 1957).
    1. Rendel, J. M. Canalization and Gene Control (Logos Press, London, 1967).
    1. Mather K. Genetical control of stability in development. Heredity. 1953;7:297–336. doi: 10.1038/hdy.1953.41. - DOI

Publication types

LinkOut - more resources