. 2017 Dec 6;7(1):17086.
doi: 10.1038/s41598-017-17332-y.

E-cadherin dynamics is regulated by galectin-7 at epithelial cell surface

Affiliations

E-cadherin dynamics is regulated by galectin-7 at epithelial cell surface

Tamara Advedissian et al. Sci Rep. .

Abstract

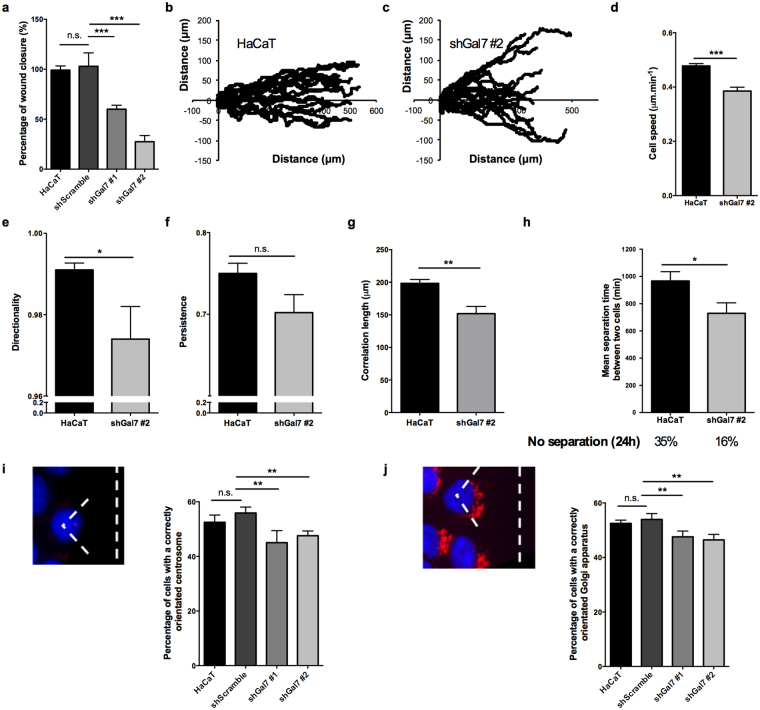
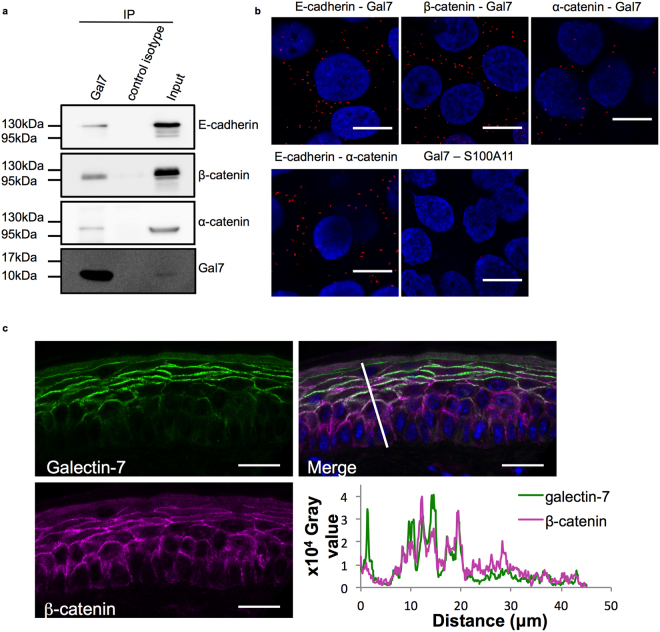
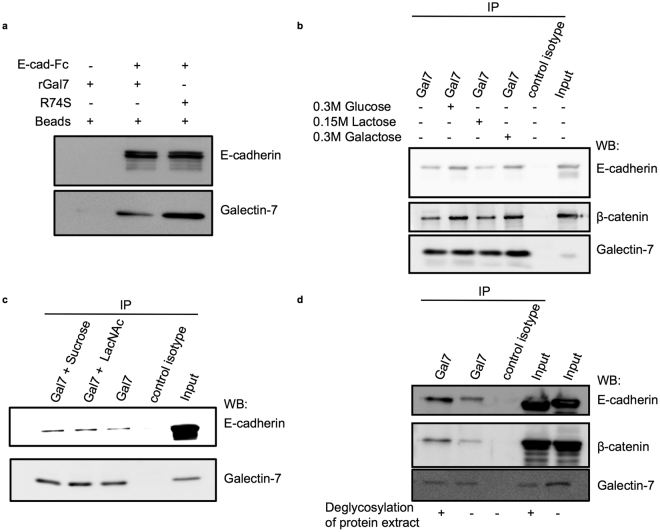
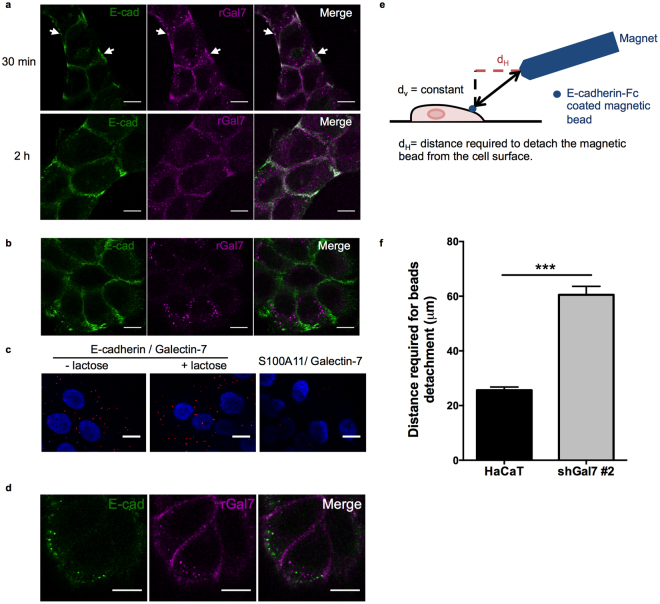
Re-epithelialisation of wounded epidermis is ensured by collective cell migration of keratinocytes. Efficient collective migration requires the maintenance of intercellular adhesion, notably through adherens junctions, to favour cell communication, support tension forces and coordinated movement . Galectin-7, a soluble lectin expressed in stratified epithelia, has been previously implicated in cell migration and intercellular adhesion. Here, we revealed a new function of galectin-7 in the control of directionality and collective behaviour in migrating keratinocytes. Consistently, we identified galectin-7 as a direct partner of E-cadherin, a key component of adherens junctions. Unexpectedly, this interaction does not require glycosylation motifs. Focusing on the underlying mechanisms, we showed that galectin-7 stabilizes E-cadherin at the plasma membrane, restraining its endocytosis. Interestingly, galectin-7 silencing decreases E-cadherin-mediated intercellular adhesion. Consequently, this study not only identifies a new stabilizer of adherens junctions but also emphasises the importance of the interplay between E-cadherin turnover and intercellular adhesion strength.


Conflict of interest statement

The authors declare that they have no competing interests.

Figures

Figure 1
Figure 1
Galectin-7 downregulation impairs collective cell migration of HaCaT keratinocytes and reduce collective behaviour. (a) Percentage of wound closure normalized to HaCaT WT cells in a inserts removals wound healing experiment. Mean ± s.e.m. are represented (n = 5). (b) Single cell tracking of collectively migrating HaCaT cells at the front of the free edge during 24 h after insert removal. (c) Mean individual cell speed was extracted from cell trajectories. Mean ± s.e.m. are represented. (d) Effect of galectin-7 downregulation on directional movement of HaCaT cells at 18 h. Mean ± s.e.m. are represented. (e) Measurement of the persistence parameter extracted from trajectory curves at 18 h. Mean ± s.e.m. are represented. P-value = 0.069. (f) Correlation length measured in collectively migrating HaCaT or shGal7 #2 clone. Mean ± s.e.m. are represented. (g) Mean separation time between two neighbouring cells analysed manually from movies of migrating cells during 24 h. The proportion of cells that did not separate during this interval is written under the graph. Mean ± s.e.m. are represented. (h) Centrosome orientation in collectively migrating HaCaT cells. The proportion of front cells with centrosome located in the 90° angle facing the wound has been quantified. (i) Golgi apparatus orientation in collectively migrating HaCaT cells. The proportion of front cells with the majority of the Golgi apparatus located in the 120° angle facing the wound has been quantified. (h,i) For each graph, 4 independent experiments, with a total of at least 100 cells per experiment have been analyzed. Results shown are mean values ± s.d. P-values obtained from unpaired t-tests with Welch’s correction are represented. ***p < 0.001; **p < 0.01; *p < 0.05.
Figure 2
Figure 2
Galectin-7 interacts and colocalizes with adherens junction components. (a) Co-immunoprecipitation experiments indicate that galectin-7 is a partner of E-cadherin, α-catenin and β-catenin. Images shown are representative images taken from distinct western blots. (b) Confocal images of Proximity Ligation Assays confirming that galectin-7 is in close proximity with distinct AJ components in the cell context. E-cadherin – α-catenin and galectin-7 – S100A11 pairs were used as respectively positive and negative controls. Gal7 = Galectin-7. Scale bars = 15 μm. (c) Representative immunostaining of galectin-7 (green) and β-catenin (magenta) in WT mice tail epidermis showing co-localisation of these two proteins. Scale bar = 20 μm. Intensity values measured along the white line were plotted in function of the distance from the base of the epidermis. Pearson’s r coefficient for galectin-7 / β-catenin staining = 0.63 ± 0.03, n = 6.
Figure 3
Figure 3
Galectin-7 directly interacts with the extracellular domain of E-cadherin independently of glycosylation motifs. (a) In vitro binding assays were performed using recombinant wild type human galectin-7 (rGal7); CRD mutated human galectin-7 (R74S) and extracellular domain of mouse E-cadherin fused to human IgG1 Fc fragment (E-cad-Fc). Both WT and mutated galectin-7 (rGal7 and R74S) were precipitated with E-cad-Fc. (b) Immunoblot showing co-immunoprecipitations of galectin-7 performed on cell lysates in the presence of high sugar concentrations. (c) As in absence of competitive carbohydrate or in the presence of 15 mM sucrose, addition of 15 mM LacNAc did not prevent galectin-7 to immunoprecipitate E-cadherin. (d) Immunoprecipitations of galectin-7 were done after deglycosylation of protein extracts in non-denaturing conditions. Representative western blot data are shown in this figure.
Figure 4
Figure 4
Galectin-7 impacts E-cadherin dynamics at the plasma membrane. (a) Total cell surface proteins were purified using labelling with biotin and pull down via avidin affinity. Immunoblots show similar levels of surface E-cadherin in HacaT cells or in shGal7 clones. Transferrin receptor was used as a loading control. (b) Quantification of internalized E-cadherin in HaCaT or shGal7 #2 cells at 15, 30, 60 or 120 min after addition of HECD-1 antibody. (c) Representative images of internalized E-cadherin after 5 min incubation with HECD-1 antibody, directed against E-cadherin ectodomain. Maximum intensity projection of Z-stacks (Z-steps = 0.21 μm) obtained with ImageJ. Scale bar = 10μm (left panels) or 5μm (zoom, right panels). (d,e) Quantification of internalized E-cadherin during 30 min at 37 °C after addition of 0 to 1 μg.ml−1 recombinant galectin-7 (rGal7) in shGal7 #2 clone (d) or control HaCaT (e). (f) Quantification of internalized E-cadherin in HaCaT or shGal7 #2 cells during 30 min at 37 °C after addition of 0 or 0.5 μg.ml−1 recombinant CRD-mutated galectin-7 (R74S). (b,d,e,f) Between 15 and 17 measures per condition were performed in n = 3 independent experiments. Mean values ± s.e.m. are represented. P-values obtained from unpaired t-tests with Welch’s correction are represented. ***p < 0.001; **p < 0.01; *p < 0.05.
Figure 5
Figure 5
Galectin-7 stabilizes E-cadherin at the plasma membrane in mature adherens junctions. (a) Mean surface fluorescence of E-cadherin measured by FACS in non-permeabilized cells. Cells were detached from the plate using trypsin and incubated for the indicated time period at 37 °C to let E-cadherin be re-addressed to the plasma membrane. Mean values ± s.d. are represented (n = 3). (b) Representative images of E-cadherin-GFP signal acquired during FRAP experiments in HaCaT cells (upper panel) and in shGal7 #2 clone (lower panel). Arrows indicate the bleach area. Scale bar = 10 μm. (c) Normalized fitted FRAP curves (dark) and mean of experimental data (red and blue) showing E-cadherin-GFP recovery after photobleaching. Mean values ± s.e.m are represented (n ≥ 39). (d,e) Graphs showing halftime recovery (t1/2) (d) and mobile fraction (e) extracted from one phase association fitting curves. Mean values ± s.e.m are represented.
Figure 6
Figure 6
Association of galectin-7 with E-cadherin at the plasma membrane influences E-cadherin mediated adhesion strength. (a) Immunofluorescence images showing accumulation of rGal7-Cy3 (magenta) at the plasma membrane with E-cadherin (green) 30 min or 2 h after addition of 0.5 mg.ml−1 rGal7. Scale bar = 20 μm. (b) rGal-Cy3 enrichment at the plasma membrane was removed by 200 mM lactose washes. Scale bar = 20 μm. (c) Washing with lactose gave similar PLA staining than no washing for E-cadherin-Galectin-7 proteins. S100A1 – Galectin-7 staining served as a negative control. Scale bar = 15 μm. (d) rGal7-Cy3 (magenta) did not show important colocalisation with endocytosed E-cadherin (green). HECD-1 antibody was incubated 30 min à 37 °C to label endocytosed E-cadherin. Scale bar = 20 μm. (e) Schematic representation of the experimental design illustrating E-cadherin coated bead bound to HaCaT cells. Rapprochement of the magnetic tweezers will cause bead detachment. (f) Measurements of the distance required to detached E-cadherin coated beads from cells. Mean values ± s.e.m are represented.

Similar articles

Cited by

References

    1. Fuchs E. Epithelial Skin Biology: Three Decades of Developmental Biology, a Hundred Questions Answered and a Thousand New Ones to Address. Curr. Top. Dev. Biol. 2016;116:357–374. doi: 10.1016/bs.ctdb.2015.11.033. - DOI - PMC - PubMed
    1. Hsu Y-C, Li L, Fuchs E. Emerging interactions between skin stem cells and their niches. Nat. Med. 2014;20:847–856. doi: 10.1038/nm.3643. - DOI - PMC - PubMed
    1. Park S, et al. Tissue-scale coordination of cellular behaviour promotes epidermal wound repair in live mice. Nat. Cell Biol. 2017;19:155–163. doi: 10.1038/ncb3472. - DOI - PMC - PubMed
    1. Mayor R, Etienne-Manneville S. The front and rear of collective cell migration. Nat. Rev. Mol. Cell Biol. 2016;17:97–109. doi: 10.1038/nrm.2015.14. - DOI - PubMed
    1. Etienne-Manneville S. Adherens junctions during cell migration. Subcell. Biochem. 2012;60:225–249. doi: 10.1007/978-94-007-4186-7_10. - DOI - PubMed

Publication types