. 2017 Dec 6;7(1):17072.
doi: 10.1038/s41598-017-16885-2.

Stimulus expectation alters decision criterion but not sensory signal in perceptual decision making

Affiliations

Stimulus expectation alters decision criterion but not sensory signal in perceptual decision making

Ji Won Bang et al. Sci Rep. .

Abstract

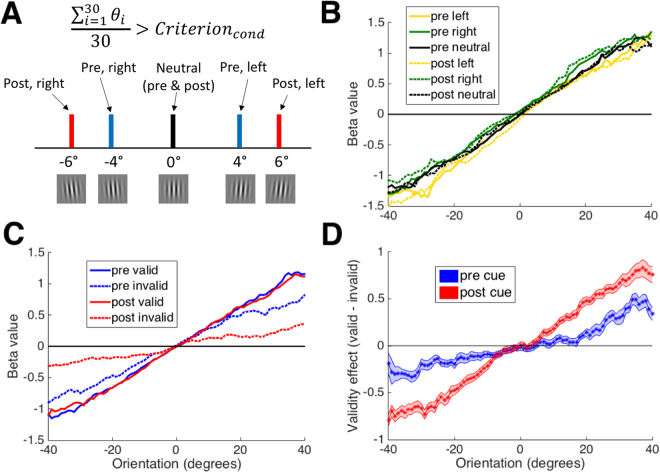
Humans are more likely to report perceiving an expected than an unexpected stimulus. Influential theories have proposed that this bias arises from expectation altering the sensory signal. However, the effects of expectation can also be due to decisional criterion shifts independent of any sensory changes. In order to adjudicate between these two possibilities, we compared the behavioral effects of pre-stimulus cues (pre cues; can influence both sensory signal and decision processes) and post-stimulus cues (post cues; can only influence decision processes). Subjects judged the average orientation of a series of Gabor patches. Surprisingly, we found that post cues had a larger effect on response bias (criterion c) than pre cues. Further, pre and post cues did not differ in their effects on stimulus sensitivity (d') or the pattern of temporal or feature processing. Indeed, reverse correlation analyses showed no difference in the temporal or feature-based use of information between pre and post cues. Overall, post cues produced all of the behavioral modulations observed as a result of pre cues. These findings show that pre and post cues affect the decision through the same mechanisms and suggest that stimulus expectation alters the decision criterion but not the sensory signal itself.


Conflict of interest statement

The authors declare that they have no competing interests.

Figures

Figure 1
Figure 1
Possible effects of stimulus expectation. (A,B) A change of the pattern of subjects’ responses can be accommodated by Signal Detection Theory as either a shift in the sensory distributions (A) or a shift in the decision criterion (B). These two options are mathematically equivalent and therefore cannot be distinguished based on the pattern of subjects’ responses alone. (CE) Depiction of putative influences of expectation on temporal and feature-based reverse correlation analyses. For temporal reverse correlations, we plot separately the information usage following predictive vs. neutral cues; for feature-based reverse correlations, we plot separately the information usage following left, right, and neutral cues. Expectation may bias the early sensory signal such that early Gabor patches (in this example, the first 6 patches) with cue-congruent orientations are over-weighted in the decision. Such an effect would lead to an L-shaped curve of temporal information usage (panel C, left), as well as strong under-weighting of cue-incongruent information (panel C, right). Alternatively, expectation may bias ambiguous sensory signal (e.g., it could bias orientations close to 0° toward the cued direction). Such an effect would lead to an overall underuse of sensory information for predictive cues (panel D, left), as well as a characteristic deflection of information usage for left and right cues around 0° (panel D, right). Finally, expectation may simply change the decision criterion, resulting in under-weighting of sensory information for predictive cues (panel E, left) and under-weighting of cue-incongruent information (panel E, right). Negative/positive orientations correspond to left/right stimuli.
Figure 2
Figure 2
Task. (A) An example trial. The stimulus was preceded by a pre cue and followed by a post cue. Fixation periods were inserted between the cues and the stimulus. In alternating blocks, either pre or post cues were relevant (the other cue consisted of an uninformative horizontal line). The relevant cues were valid with 66.67% probability. On 25% of the trials, a neutral cue (consisting of a vertical line) was presented. The example trial above is drawn from a pre cue block. (B) The stimulus consisted of 30 Gabor patches with orientations drawn from a normal distribution determined for each subject using a staircase. Each Gabor patch was presented for one frame (16.7 ms).
Figure 3
Figure 3
Behavioral effects. (A) Effect of pre and post cues on the decision criterion. Post cues had a larger effect on the criterion (larger bias away from zero) than pre cues. (B) Individual data for criterion effect. The criterion effect Δc was defined as the difference between the criterion for left and right cues. For the majority of subjects, this effect was larger for the post cues (points above the diagonal identity line). (C) Effect of pre and post cues on stimulus sensitivity d’. Pre and post cues did not differ in their effect on stimulus sensitivity. (D) Individual data for the d’ effect. As with the criterion, the d’ effect Δd’ was defined as the difference in d’ values between left and right cues. No difference in the effect was found for pre and post cues. Error bars show S.E.M. **p < 0.01, ***p < 0.001.
Figure 4
Figure 4
Temporal information usage. (A) The pattern of temporal information usage over the course of the 30 stimulus frames shows a pronounced recency effect such that the last two frames influenced the decision more. The optimal information usage is displayed for comparison. The line of optimal usage is not flat (even though optimally each frame should be weighted equally) since it was computed from noisy data. Shaded areas show S.E.M. (B) Temporal information usage for predictive and neutral cues did not differ by cue time (pre vs. post). The lines for neutral cues are noisier since they are based on fewer trials. All timecourses are smoothed for display purposes using a two-frame sliding window.
Figure 5
Figure 5
Feature-based information usage. (A) The pattern of stimulus information usage across all trials. The graph shows the strength with which each stimulus orientation predicts a “right” (i.e., clockwise) response. The line of optimal usage shows that subjects underweighted the extreme stimulus orientations. (B) Feature information usage for each cue identity (left, right, and neutral) did not differ by cue time (pre vs. post). (C) The information usage differs between valid and invalid cues. (D) The difference between valid and invalid trials is larger for post compared to pre cues. In all panels, 0° indicates vertical orientation and negative (positive) angles indicate counterclockwise (clockwise) deviations from vertical that correspond to left (right) choices. Shaded areas show S.E.M.
Figure 6
Figure 6
Modeling results. (A) Depiction of the model. The model gave responses based on how the average of the 30 Gabor orientations θi compared to condition-specific criteria. The criteria values used (+/−6° for post cues, +/−4° for pre cues, and 0° for neutral cues) are presented graphically together with a Gabor patch of that orientation. (BD) As in Fig. 5B–D, we plot feature information usage for left/right/neutral cues (B), for valid and invalid cues (C), and for the difference between valid and invalid cues (D). The model reproduces the qualitative effects from Fig. 5B–D. In all panels, 0° indicates vertical orientation and negative (positive) angles indicate counterclockwise (clockwise) deviations from vertical that correspond to left (right) choices. Shaded areas show S.E.M.

References

    1. Ackermann JF, Landy MS. Suboptimal decision criteria are predicted by subjectively weighted probabilities and rewards. Atten. Percept. Psychophys. 2015;77:638–658. doi: 10.3758/s13414-014-0779-z. - DOI - PMC - PubMed
    1. Rahnev D, Lau H, De Lange FP. Prior expectation modulates the interaction between sensory and prefrontal regions in the human brain. J. Neurosci. 2011;31:10741–10748. doi: 10.1523/JNEUROSCI.1478-11.2011. - DOI - PMC - PubMed
    1. de Lange FP, Rahnev D, Donner TH, Lau H. Prestimulus Oscillatory Activity over Motor Cortex Reflects Perceptual Expectations. J. Neurosci. 2013;33:1400–1410. doi: 10.1523/JNEUROSCI.1094-12.2013. - DOI - PMC - PubMed
    1. Summerfield C, Koechlin E. Economic value biases uncertain perceptual choices in the parietal and prefrontal cortices. Front. Hum. Neurosci. 2010;4:208. doi: 10.3389/fnhum.2010.00208. - DOI - PMC - PubMed
    1. Ulehla ZJ. Optimality of perceptual decision criteria. J. Exp. Psychol. 1966;71:564–569. doi: 10.1037/h0023007. - DOI - PubMed

Publication types

LinkOut - more resources