. 2017:2017:4297639.
doi: 10.1155/2017/4297639. Epub 2017 Oct 29.

Endometritis and In Vitro PGE2 Challenge Modify Properties of Cattle Endometrial Mesenchymal Stem Cells and Their Transcriptomic Profile

Affiliations

Endometritis and In Vitro PGE2 Challenge Modify Properties of Cattle Endometrial Mesenchymal Stem Cells and Their Transcriptomic Profile

Evelyn Lara et al. Stem Cells Int. 2017.

Abstract

Mesenchymal stem cells (MSCs) were isolated and characterized from postpartum bovine endometrium of animals with subclinical (n = 5) and clinical endometritis (n = 3) and healthy puerperal females (n = 5). Cells isolated displayed mean morphological features of MSCs and underwent osteogenic, chondrogenic, and adipogenic differentiation after induction (healthy and subclinical). Cells from cows with clinical endometritis did not undergo adipogenic differentiation. All cells expressed mRNAs for selected MSC markers. Endometrial MSCs were challenged in vitro with PGE2 at concentrations of 0, 1, 3, and 10 μM, and their global transcriptomic profile was studied. Overall, 1127 genes were differentially expressed between unchallenged cells and cells treated with PGE2 at all concentrations (763 up- and 364 downregulated, fold change > 2, and P < 0.05). The pathways affected the most by the PGE2 challenge were immune response, angiogenesis, and cell proliferation. In conclusion, we demonstrated that healthy puerperal bovine endometrium contains MSCs and that endometritis modifies and limits some functional characteristics of these cells, such as their ability to proceed to adipogenic differentiation. Also, PGE2, an inflammatory mediator of endometritis, modifies the transcriptomic profile of endometrial MSCs. A similar situation may occur during inflammation associated with endometritis, therefore affecting the main properties of endometrial MSCs.


Figures

Figure 1
Figure 1
Representative images of the morphology and in vitro colony formation of the primary cell cultures derived from bovine endometrial tissue of a healthy animal (a, d, g) with subclinical endometritis (b, e, h) or clinical endometritis (c, f, i). (a, b, c) Normal fibroblast-like appearance at 40x. (d, e, f) Giemsa stain at 40x. (g, h, i) Alkaline phosphatase activity in a colony at 100x.
Figure 2
Figure 2
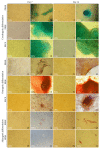
Representative images from the in vitro differentiation to chondrogenic (2, 4, 6, 8, 10, and 12), osteogenic (14, 16, 18, 20, 22, and 24), and adipogenic (26, 28, 30, and 32) lineages of cells from bovine postpartum healthy endometrium (PPHE) and subclinical (PPSE) and clinical (PPCE) endometritis at day 7 and 14. Noninduced cell controls (1, 3, 5, 7, 9, 11, 13, 15, 17, 19, 21, 23, 25, 27, 29, and 31).
Figure 3
Figure 3
Reverse transcription and real-time PCR analysis of the expression of OCT4, SOX2, CD44, and CD117 markers in tissue and cells from primary culture from bovine postpartum healthy endometrium (PPHE) with subclinical (PPSE) or clinical (PPCE) endometritis (a, b). All PCRs were normalized against ACTB. Different letters show significative differences with P < 0.05.
Figure 4
Figure 4
Expression of the OCT4 and SOX2 proteins through western blot in cells from bovine postpartum endometrial primary culture.
Figure 5
Figure 5
Volcano plot showing the distribution of differentially expressed genes in PGE2+ cells as a function of the selected P value. Left panel P < 0.05, right panel P < 0.01 (a). Details of differential response of endometrial MSCs to the challenge with PGE2 (b). Cat whiskers plot representing the distribution of normalized intensity values among the two cell lines (LLPh1 and LLPh3) and the four doses (0, 1, 3, and 10 μM of PGE2) used. The amplitude of the intensity values is wider for PGE2-treated cells when compared to control (two right columns). Upper or lower extreme red boxes represent the biggest and smallest values of the data set. Lower extreme, the lowest or smallest value in a set of data. Blue boxes represent the median distribution of intensity values (c).
Figure 6
Figure 6
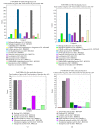
Gene ontology analysis of the main biological processes and molecular functions represented by the upregulated genes in 0 versus all doses of PGE2 (a, c) and downregulated genes in 0 versus all doses of PGE2 (b, d), respectively.
Figure 7
Figure 7
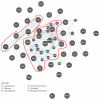
Readout of GeneMania Prediction Server showing gene interaction networks for the top 38 most differentially expressed genes. Of the top 40 differentially expressed genes, only LOC781494 and SNHG3 gene symbols were not recognized by the software. The colors of connections suggest the type of interaction as listed in the legend. (For interpretation of the references to color in this figure legend, the reader is referred to the Web version of this article.) Englobed in red are centrally located (more interacting genes) and a set of four genes peripherally located, but with a strong interaction.
Figure 8
Figure 8
Validation of the microarray using relative expression of the selected genes by quantitative real-time polymerase chain reaction (qRT-PCR). Control embryos were used as calibrator to determine the fold change in the qRT-PCR. B-actin was used as housekeeping genes in all qRT-PCRs. In the qRT-PCR, all genes had the same expression pattern as in the microarray experiment. There is a linear correlation between data from qRT-PCR and microarray (r = 0.89, P < 0.05). The three equally expressed genes mentioned in the text (BAX2, COX2, and IL-1) were not plotted in this figure.

References

    1. Arai M., Yoshioka S., Tasaki Y., Okuda K. Remodeling of bovine endometrium throughout the estrous cycle. Animal Reproduction Science. 2013;142(1-2):1–9. doi: 10.1016/j.anireprosci.2013.08.003. - DOI - PubMed
    1. Mitko K., Ulbrich S. E., Wenigerkind H., et al. Dynamic changes in messenger RNA profiles of bovine endometrium during the oestrous cycle. Reproduction. 2008;135(2):225–240. doi: 10.1530/REP-07-0415. - DOI - PubMed
    1. Chan R. W. S. Clonogenicity of human endometrial epithelial and stromal cells. Biology of Reproduction. 2004;70(6):1738–1750. doi: 10.1095/biolreprod.103.024109. - DOI - PubMed
    1. Cao M., Chan R. W., Yeung W. S. Label-retaining stromal cells in mouse endometrium awaken for expansion and repair after parturition. Stem Cells and Development. 2015;24(6):768–780. doi: 10.1089/scd.2014.0225. - DOI - PMC - PubMed
    1. Okano A., Tomizuka T. Post partum uterine involution in the cow. Theriogenology. 1996;27(2):369–376. - PubMed

LinkOut - more resources