

The TcEG1 beetle (Tribolium castaneum) cellulase produced in transgenic switchgrass is active at alkaline pH and auto-hydrolyzes biomass for increased cellobiose release
- PMID: 29213306
- PMCID: PMC5707894
- DOI: 10.1186/s13068-017-0918-6
The TcEG1 beetle (Tribolium castaneum) cellulase produced in transgenic switchgrass is active at alkaline pH and auto-hydrolyzes biomass for increased cellobiose release
Abstract
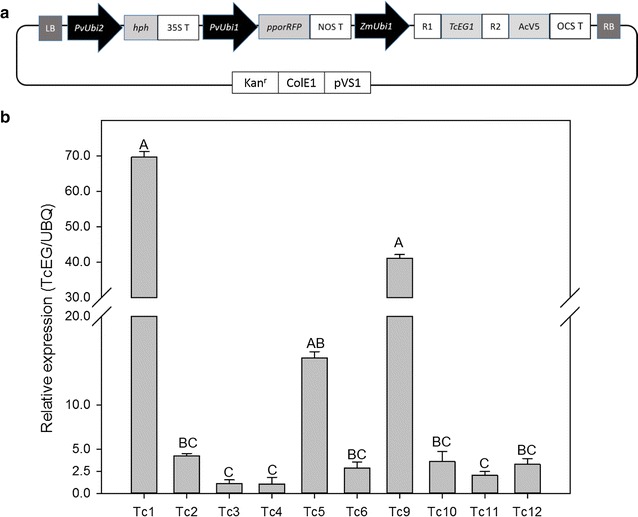
Background: Genetically engineered biofuel crops, such as switchgrass (Panicum virgatum L.), that produce their own cell wall-digesting cellulase enzymes would reduce costs of cellulosic biofuel production. To date, non-bioenergy plant models have been used in nearly all studies assessing the synthesis and activity of plant-produced fungal and bacterial cellulases. One potential source for cellulolytic enzyme genes is herbivorous insects adapted to digest plant cell walls. Here we examine the potential of transgenic switchgrass-produced TcEG1 cellulase from Tribolium castaneum (red flour beetle). This enzyme, when overproduced in Escherichia coli and Saccharomyces cerevisiae, efficiently digests cellulose at optima of 50 °C and pH 12.0.
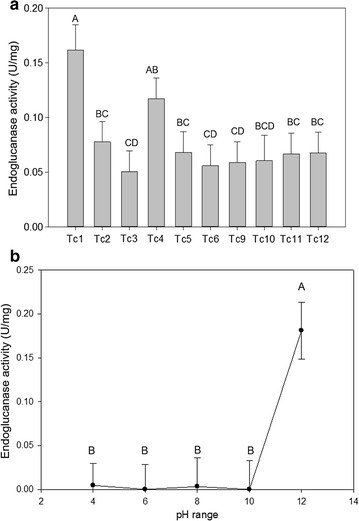
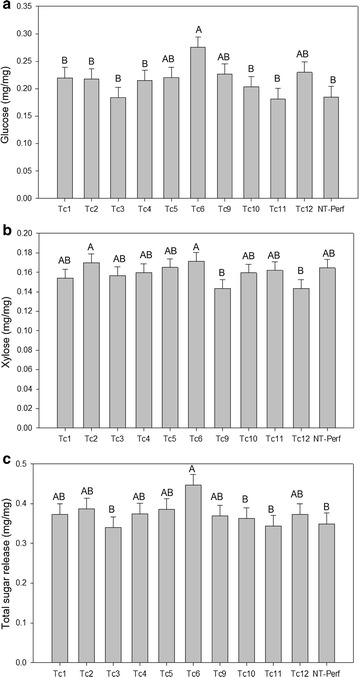
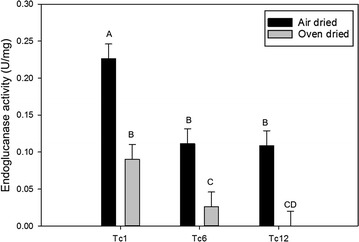
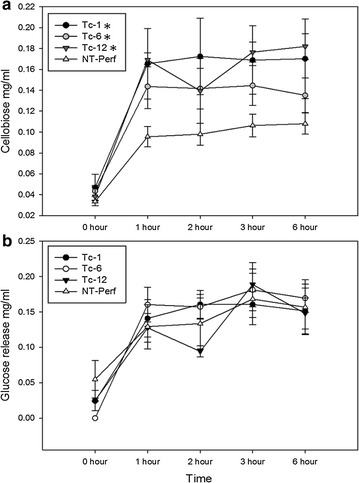
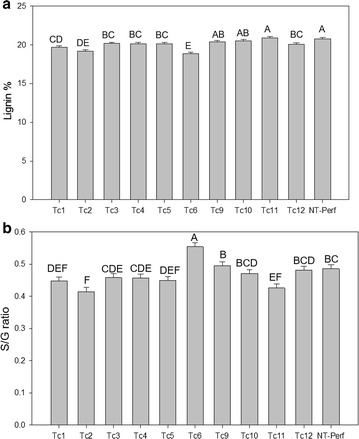
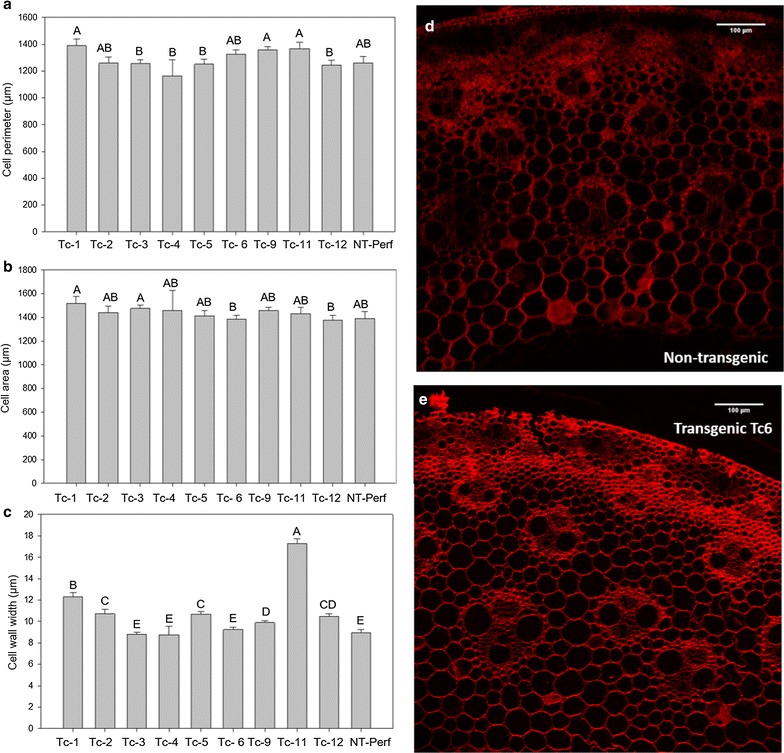
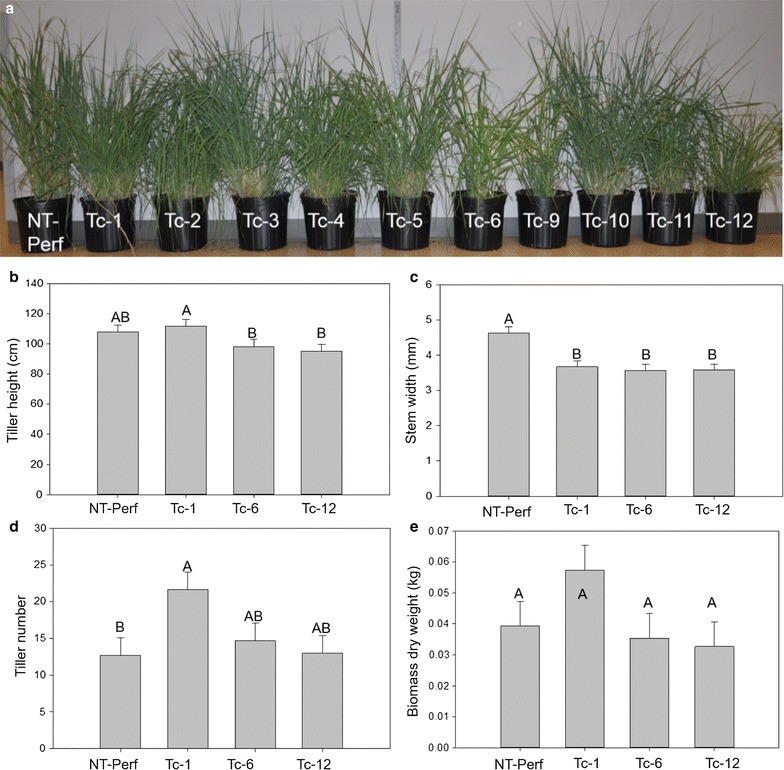
Results: TcEG1 that was produced in green transgenic switchgrass tissue had a range of endoglucanase activity of 0.16-0.05 units (µM glucose release/min/mg) at 50 °C and pH 12.0. TcEG1 activity from air-dried leaves was unchanged from that from green tissue, but when tissue was dried in a desiccant oven (46 °C), specific enzyme activity decreased by 60%. When transgenic biomass was "dropped-in" into an alkaline buffer (pH 12.0) and allowed to incubate at 50 °C, cellobiose release was increased up to 77% over non-transgenic biomass. Saccharification was increased in one transgenic event by 28%, which had a concurrent decrease in lignin content of 9%. Histological analysis revealed an increase in cell wall thickness with no change to cell area or perimeter. Transgenic plants produced more, albeit narrower, tillers with equivalent dry biomass as the control.
Conclusions: This work describes the first study in which an insect cellulase has been produced in transgenic plants; in this case, the dedicated bioenergy crop switchgrass. Switchgrass overexpressing the TcEG1 gene appeared to be morphologically similar to its non-transgenic control and produced equivalent dry biomass. Therefore, we propose TcEG1 transgenics could be bred with other transgenic germplasm (e.g., low-lignin lines) to yield new switchgrass with synergistically reduced recalcitrance to biofuel production. In addition, transgenes for other cell wall degrading enzymes may be stacked with TcEG1 in switchgrass to yield complementary cell wall digestion features and complete auto-hydrolysis.
Keywords: Auto-hydrolysis; Biofuel; Cellulase; Glycosyl hydrolase; Insect; Switchgrass; Tribolium castaneum; β-1,4-Endoglucanase.
Figures
Similar articles
-
Expression of an endoglucanase from Tribolium castaneum (TcEG1) in Saccharomyces cerevisiae.Insect Sci. 2014 Oct;21(5):609-18. doi: 10.1111/1744-7917.12069. Epub 2013 Dec 9. Insect Sci. 2014. PMID: 24318365
-
Identification, cloning, and expression of a GHF9 cellulase from Tribolium castaneum (Coleoptera: Tenebrionidae).J Insect Physiol. 2011 Feb;57(2):300-6. doi: 10.1016/j.jinsphys.2010.11.019. Epub 2010 Nov 30. J Insect Physiol. 2011. PMID: 21126522
-
Transgenic switchgrass (Panicum virgatum L.) biomass is increased by overexpression of switchgrass sucrose synthase (PvSUS1).Biotechnol J. 2015 Apr;10(4):552-63. doi: 10.1002/biot.201400499. Epub 2014 Nov 14. Biotechnol J. 2015. PMID: 25327983
-
Engineering of Bioenergy Crops: Dominant Genetic Approaches to Improve Polysaccharide Properties and Composition in Biomass.Front Plant Sci. 2020 Mar 11;11:282. doi: 10.3389/fpls.2020.00282. eCollection 2020. Front Plant Sci. 2020. PMID: 32218797 Free PMC article. Review.
-
Assessing cellulase performance on pretreated lignocellulosic biomass using saccharification and fermentation-based protocols.Methods Mol Biol. 2009;581:233-45. doi: 10.1007/978-1-60761-214-8_15. Methods Mol Biol. 2009. PMID: 19768626 Review.
Cited by
-
Expression of a hyperthermophilic endoglucanase in hybrid poplar modifies the plant cell wall and enhances digestibility.Biotechnol Biofuels. 2018 Aug 16;11:225. doi: 10.1186/s13068-018-1224-7. eCollection 2018. Biotechnol Biofuels. 2018. PMID: 30147748 Free PMC article.
-
Role of carbohydrate-active enzymes in brown planthopper virulence and adaptability.Front Plant Sci. 2025 Apr 4;16:1554498. doi: 10.3389/fpls.2025.1554498. eCollection 2025. Front Plant Sci. 2025. PMID: 40303855 Free PMC article.
-
Expression Profiling of Plant Cell Wall-Degrading Enzyme Genes in Eucryptorrhynchus scrobiculatus Midgut.Front Physiol. 2020 Sep 4;11:1111. doi: 10.3389/fphys.2020.01111. eCollection 2020. Front Physiol. 2020. PMID: 33013475 Free PMC article.
-
Current perspective on production and applications of microbial cellulases: a review.Bioresour Bioprocess. 2021 Oct 5;8(1):95. doi: 10.1186/s40643-021-00447-6. Bioresour Bioprocess. 2021. PMID: 38650192 Free PMC article. Review.
-
De novo transcriptome assembly of the bamboo snout beetle Cyrtotrachelus buqueti reveals ability to degrade lignocellulose of bamboo feedstock.Biotechnol Biofuels. 2018 Oct 27;11:292. doi: 10.1186/s13068-018-1291-9. eCollection 2018. Biotechnol Biofuels. 2018. PMID: 30386429 Free PMC article.
References
-
- Mitchell RB, Schmer MR, Anderson WF, Jin V, Balkcom KS, Kiniry J, Coffin A, White P. Dedicated energy crops and crop residues for bioenergy feedstocks in the central and eastern USA. Bioenergy Res. 2016;9(2):384–398. doi: 10.1007/s12155-016-9734-2. - DOI
-
- Wright L, Turhollow A. Switchgrass selection as a “model” bioenergy crop: a history of the process. Biomass Bioenergy. 2010;34(6):851–868. doi: 10.1016/j.biombioe.2010.01.030. - DOI
-
- Wullschleger SD, Davis EB, Borsuk ME, Gunderson CA, Lynd LR. Biomass production in switchgrass across the United States: database description and determinants of yield. Agron J. 2010;102(4):1158–1168. doi: 10.2134/agronj2010.0087. - DOI
-
- Griffith AP, Haque M, Epplin FM. Cost to produce and deliver cellulosic feedstock to a biorefinery: switchgrass and forage sorghum. Appl Energy. 2014;127(1):44–54. doi: 10.1016/j.apenergy.2014.03.068. - DOI
LinkOut - more resources
Full Text Sources
Other Literature Sources
