. 2017 Dec 7;8(1):1986.
doi: 10.1038/s41467-017-02086-y.

Allosteric pyruvate kinase-based "logic gate" synergistically senses energy and sugar levels in Mycobacterium tuberculosis

Affiliations

Allosteric pyruvate kinase-based "logic gate" synergistically senses energy and sugar levels in Mycobacterium tuberculosis

Wenhe Zhong et al. Nat Commun. .

Abstract

Pyruvate kinase (PYK) is an essential glycolytic enzyme that controls glycolytic flux and is critical for ATP production in all organisms, with tight regulation by multiple metabolites. Yet the allosteric mechanisms governing PYK activity in bacterial pathogens are poorly understood. Here we report biochemical, structural and metabolomic evidence that Mycobacterium tuberculosis (Mtb) PYK uses AMP and glucose-6-phosphate (G6P) as synergistic allosteric activators that function as a molecular "OR logic gate" to tightly regulate energy and glucose metabolism. G6P was found to bind to a previously unknown site adjacent to the canonical site for AMP. Kinetic data and structural network analysis further show that AMP and G6P work synergistically as allosteric activators. Importantly, metabolome profiling in the Mtb surrogate, Mycobacterium bovis BCG, reveals significant changes in AMP and G6P levels during nutrient deprivation, which provides insights into how a PYK OR gate would function during the stress of Mtb infection.


Conflict of interest statement

The authors declare no competing financial interests.

Figures
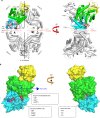
Fig. 1
Fig. 1
Structure of MtbPYK and overview of three allosteric sites of PYK. a Crystal structure of the MtbPYK-OX/AMP/G6P complex (PDB ID 5WSB) in the synergistically activated R-state. Two orthogonal views of MtbPYK-OX/AMP/G6P show the tetramer architecture, domain boundaries, active site and synergistic effector sites. The A–A (large) and C–C (small) interfaces between subunits are shown as dashed lines. Each subunit comprises three domains, and one subunit (chain A) is coloured to show the domains: A-domain in green (residues 1–70, 168–336), B-domain in yellow (residues 71–167), C-domain in cyan (residues 337–472). The N terminus and C terminus of this subunit are indicated. Polypeptide chains are shown as cartoons, while metals and ligands are represented by spheres. Mg2+ and K+ located at the active site (brown box) are coloured in green and purple, respectively. The oxalate molecule (OX) at the active site is associated with the Mg2+. The canonical allosteric site (AMP-bound) is indicated by the purple box, while the newly discovered G6P-binding site (synergistically coordinating with the AMP-binding site) is shown by the magenta box. The AMP-binding loop (AMP loop) and G6P-binding loop (G6P loop) are coloured black. The C-terminal loop (tail loop) which undergoes a conformational change in the transition of inactive- and active states is indicated. b A surface representation of the PYK monomer (A-, B- and C-domains) highlighting three allosteric effector sites: canonical allosteric site that binds AMP, F26BP or F16BP; amino-acid site found in mammalian M1/M2PYK that binds amino acids as a nutrient sensor; sugar monophosphate site that binds G6P in M. tuberculosis synergistically coordinating with the canonical site, and probably binds R5P or G3P in some organisms. The A-, B- and C domains are shown in green, yellow and cyan, respectively. Effector-site ligands are shown as spheres
Fig. 2
Fig. 2
T- to R-state transition requires the disruption of C–C interface interactions and is enhanced by effector binding. a Rigid-body rotation showing the transition between T- and R-states of MtbPYK. The C-α atoms of the AC cores (A- and C domains) of the inactive T-state tetramer (yellow) were superposed onto the active R-state tetramer (cyan). The superposed polypeptide chains are shown as cartoons, and B-domains have been removed for clarity. The T- (yellow) and R-state (cyan) transition is represented by a 9° rigid-body (AC core) rotation around the central pivot (indicated by the red circle). b Schematic representation of the rigid-body rotation of the AC cores between the T- (dashed lines) and R-states (solid lines). Ligands AMP, G6P and oxalate are shown as purple rectangle, magenta square and red trapezoid, respectively. The direction of movement is shown using arrows. The structural reshaping of the allosteric sites induced by AMP/G6P synergism is indicated in cyan. c Side view of the superposed tetramers of T-state MtbPYK and R-state MtbPYK-OX/AMP/G6P. The AC cores of two tetramers were superposed (C-α atoms fit). The polypeptide chain is shown as a cartoon while effectors are shown as sticks. The B domains have been removed for clarity. Only two subunits are shown: subunit 1 and subunit 2. The C-C interface formed between subunit 1 (T-state in yellow and R-state in cyan) and subunit 2 (T-state in salmon and R-state in blue) is indicated using a green dashed line. Interface loops are indicated and the flips of loops between T- and R-states are shown by arrows. In the R-state, AMP loops and tail loops are indicated in black and grey, respectively. d Enlargement of the C–C interface indicating the conformational changes and the rearrangement of interface interactions. The movements of loops and residues are indicated by arrows. Interactions in the T-state structure are shown as red dotted lines, while interactions in the R-state structure are shown as grey dashed lines
Fig. 3
Fig. 3
AMP and G6P bind at two distinct allosteric sites. a Close-up view of the superposed allosteric sites of T-state MtbPYK (yellow) and R-state MtbPYK-OX/AMP/G6P (cyan). The polypeptide chain is shown as a cartoon while interacting residues are shown as sticks. Allosteric effectors AMP and G6P are shown with an unbiased Fo–Fc electron-density map contoured at 3.0 σ (grey). Water molecules are shown as red spheres. Interactions between ligands and the R-state structure are indicated by dashed lines. The T-shaped stacking (or CH–π hydrogen bonding) interactions formed between the adenine ring of AMP and MtbPYK residues (Phe373, Trp398, Met425) are shown by pink dashed lines. Secondary structures that are involved in the interactions with effectors are indicated. The conformational changes of the C-terminal tail loop and the side-chain of residue Trp398 are indicated by arrows. The location of the allosteric site within a subunit is shown as a red box in the inset (i). b, Schematic drawing showing the synergistic interactions at the MtbPYK allosteric sites. Residues forming T-shaped stacking (or CH–π hydrogen bonding) interactions with the adenine ring of AMP are indicated in pink, while water molecules are shown as blue circles
Fig. 4
Fig. 4
Allosteric pathways between the catalytic site and the two allosteric sites. a The allosteric pathways of OX-AMP (green) and OX-G6P (purple) share three common residues, namely Ala217, Ala237 and Lys218 (black spheres). The shared portion of the pathway is coloured black. The protein is drawn in ribbon and coloured according to community analysis. Note that the lid B domain is not shown for clarity. b A schematic shows the two allosteric pathways and the key participating residues. The residues could be grouped in two different communities, coloured in grey and pink. c Histograms of the key residues involved in the pathways, showing the frequency at which a particular residue was identified in one of the 4000 calculated pathways. The allosteric pathways were extracted from the MD simulations using WISP dynamic network analysis
Fig. 5
Fig. 5
Local conformational rearrangements within the C domain induced by the effectors binding in a synergistic manner. Effector-site superposition of five MtbPYK structures in different ligand-bound states showing the structural rearrangements of the synergistic mechanism. The polypeptide chains are shown as cartoons, while interacting residues are shown as sticks. The carbon atoms of the effectors AMP and G6P are represented by grey sticks. The movements of α helixes (Cα1, Cα4 and Aα6′–Aα6) and the flip of the side chain of Trp398 are indicated by arrows. Interactions between MtbPYK and the effectors are shown as dashed lines, together with the corresponding distances. The relative locations of the five implicated α helixes within a subunit are shown in the inset (i) where the active site, allosteric effector-binding site and domains are indicated. The α helixes Cα3 and Aα6′–Aα6 are shown as green and red, respectively. The distance between the active site and effector is about 40 Å
Fig. 6
Fig. 6
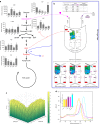
Allosteric PYK-based molecular OR logic gate synergistically regulates energy and carbon metabolism in mycobacteria. Histograms of metabolic changes at S4, S10, S22 and R6 against Log in nutrient-starvation model; abundance data were normalised to protein concentration and represent mean ± SD, n = 4; significance is indicated as *p < 0.05, **p < 0.01, ***p < 0.001 by one-way ANOVA with Dunnett post test versus Log. a Schematic illustration of glycolysis pathway and metabolic changes in M. bovis BCG during nutrient starvation. The allosteric activator of MtbPYK, glucose-6-P (G6P), is shown in magenta, while PYK substrates (ADP and PEP) and products (ATP and pyruvate) are coloured in red. b A schematic representation of the molecular OR gate. The metabolite G6P (magenta square) and the low-energy-state signal AMP (purple rectangle) are two molecular inputs into the gate which is composed of inactive MtbPYK and its substrates (red trapezoid). The enzyme MtbPYK is activated (output) by the binding of either molecule input or both molecules cooperatively at certain concentrations. The sensitivity to one input molecule is increased as the concentration of the other input molecule increases. The MtbPYK tetramers in inactive T-state, AMP-activated R-state, G6P-activated R-state and AMP/G6P-activated R-state are all shown in schematic representations. Domains are highlighted in one subunit: A domain in green, B domain in grey, C domain in blue. Secondary structures and residues, that undergoes significant movements from T-state to activated R-state, are shown as cartons and sticks. AMP loops are indicated as red lines. A logic gate table is also shown on top. High = high concentration; Low = low concentration. c A three-dimensional (3D) graph shows the relation of activator concentrations and MtbPYK activity in vitro. ‘%V max’ is expressed as the percentage of maximum velocity in the presence of saturating activators. The activities were measured in vitro using purified MtbPYK in the presence of 4 mM ADP and 0.2 mM PEP. d Thermal shift assay results for five MtbPYK complexes. All data are mean ± SEM for two independent experiments done in duplicate

Similar articles

Cited by

References

    1. World Health Organization. Global Tuberculosis Report 2015. http://www.who.int/tb/publications/global_report/gtbr15_main_text.pdf (2015).
    1. Schnappinger D, et al. Transcriptional adaptation of Mycobacterium tuberculosis within macrophages: insights into the phagosomal environment. J. Exp. Med. 2003;198:693–704. doi: 10.1084/jem.20030846. - DOI - PMC - PubMed
    1. Rhee KY, et al. Central carbon metabolism in Mycobacterium tuberculosis: an unexpected frontier. Trends Microbiol. 2011;19:307–314. doi: 10.1016/j.tim.2011.03.008. - DOI - PMC - PubMed
    1. de Carvalho LPS, et al. Metabolomics of Mycobacterium tuberculosis reveals compartmentalized co-catabolism of carbon substrates. Chem. Biol. 2010;17:1122–1131. doi: 10.1016/j.chembiol.2010.08.009. - DOI - PubMed
    1. Cumming BM, Steyn AJC. Metabolic plasticity of central carbon metabolism protects mycobacteria. Proc. Natl Acad. Sci. USA. 2015;112:13135–13136. doi: 10.1073/pnas.1518171112. - DOI - PMC - PubMed

Publication types