. 2017 Dec 7;8(1):1985.
doi: 10.1038/s41467-017-02083-1.

Malaria parasite DNA-harbouring vesicles activate cytosolic immune sensors

Affiliations

Malaria parasite DNA-harbouring vesicles activate cytosolic immune sensors

Xavier Sisquella et al. Nat Commun. .

Abstract

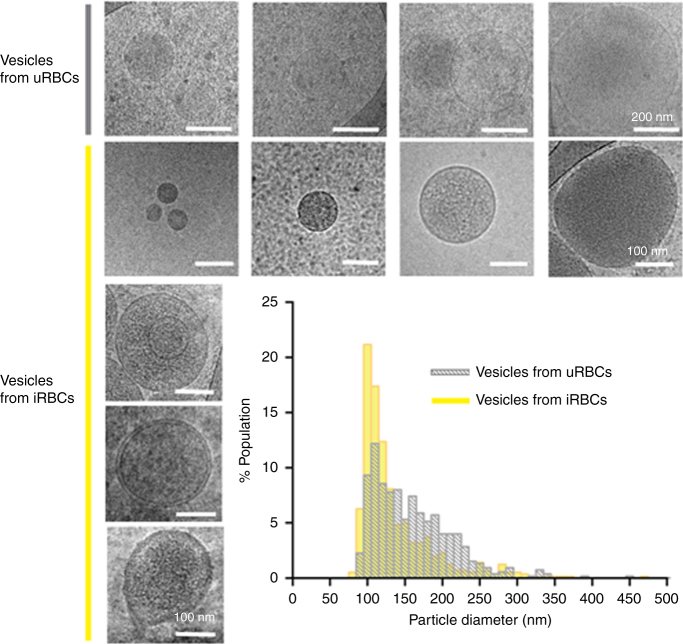
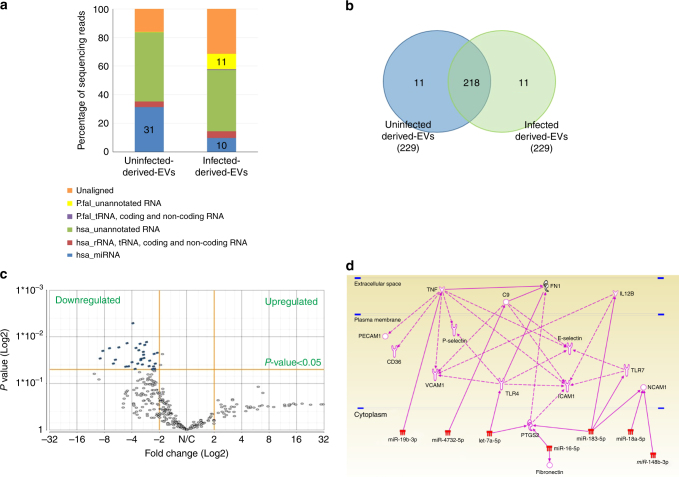
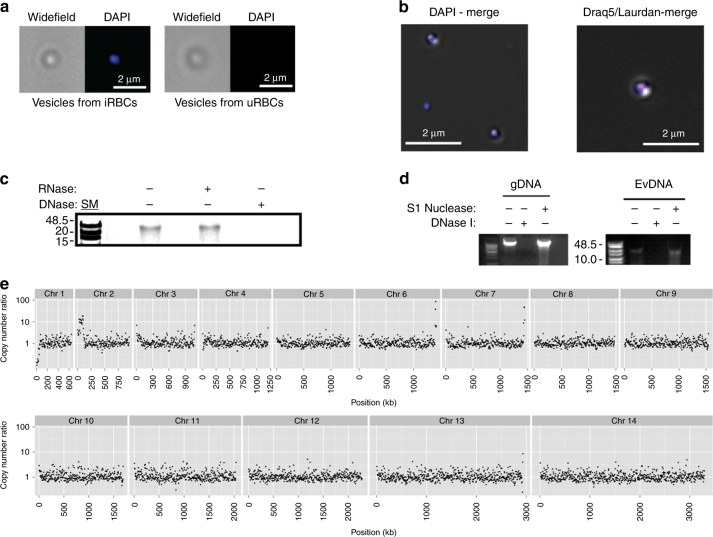
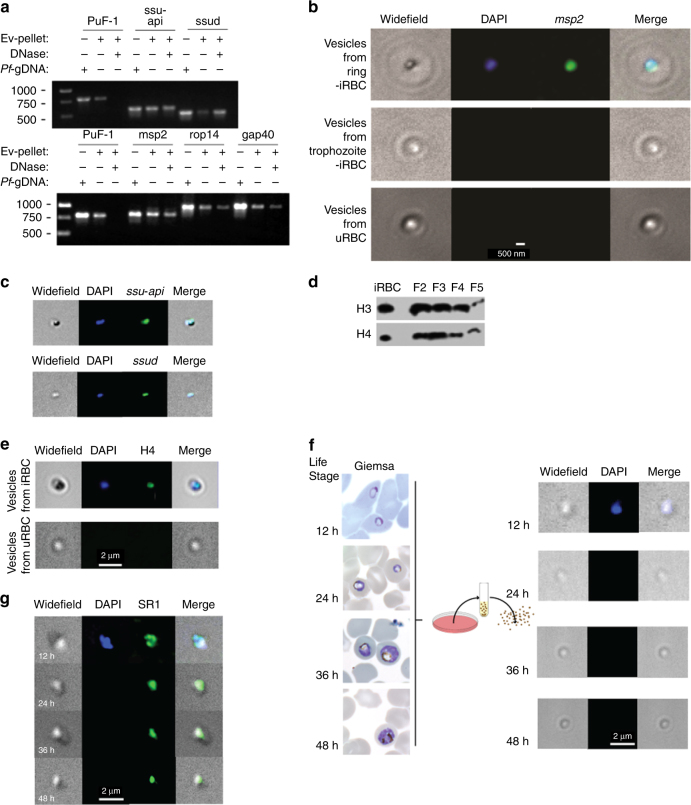
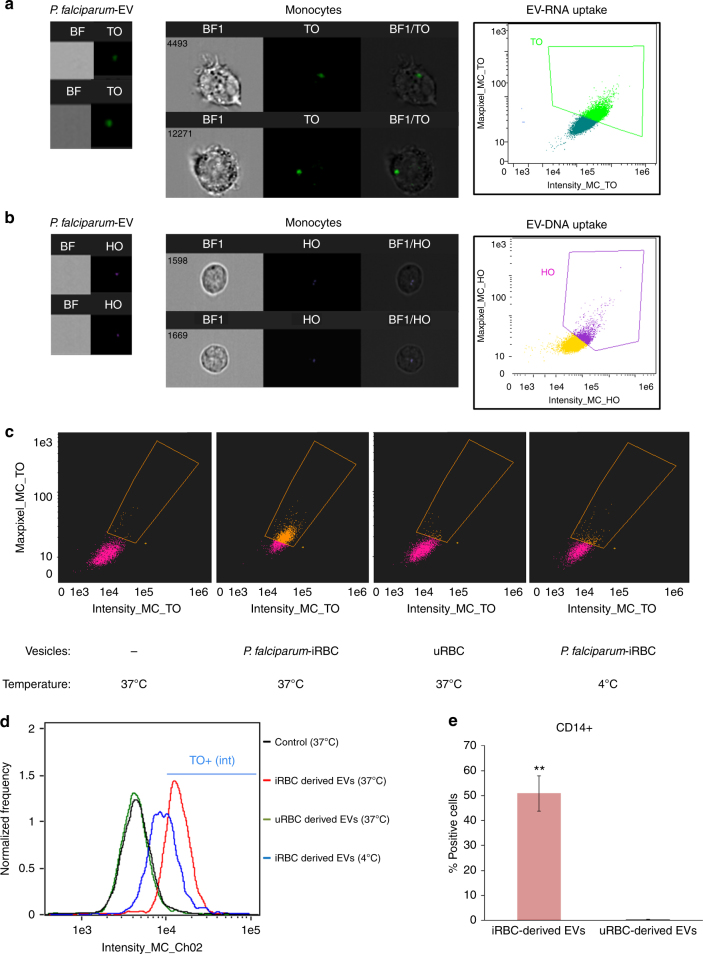
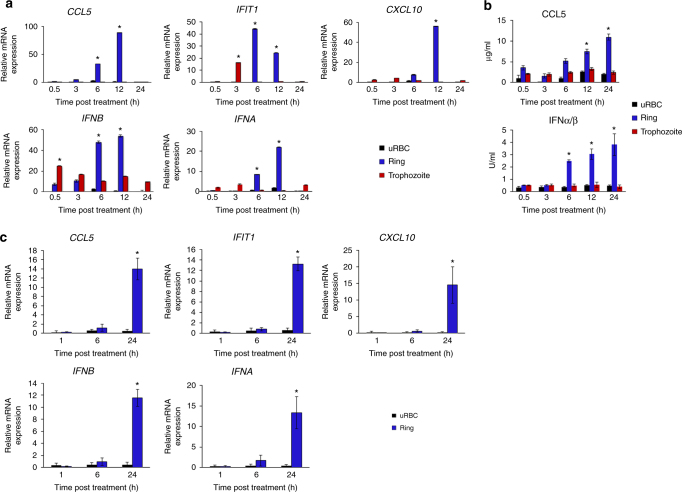
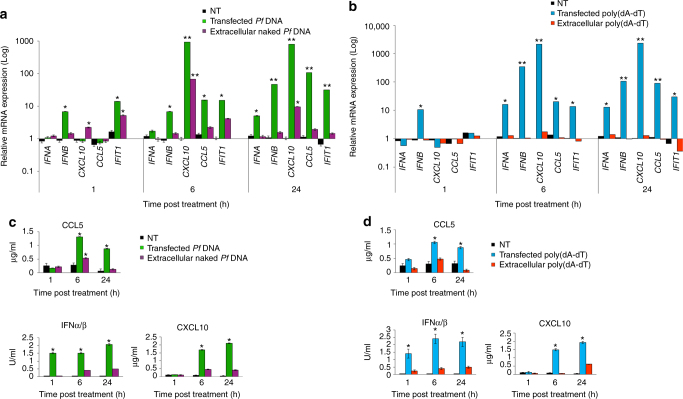
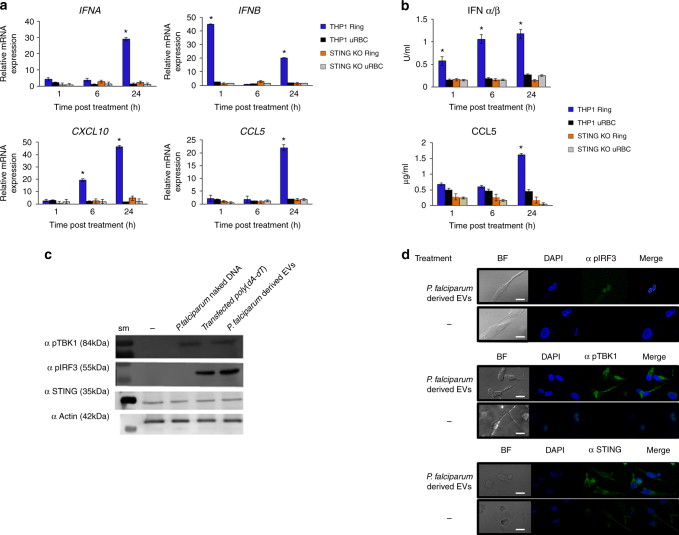
STING is an innate immune cytosolic adaptor for DNA sensors that engage malaria parasite (Plasmodium falciparum) or other pathogen DNA. As P. falciparum infects red blood cells and not leukocytes, how parasite DNA reaches such host cytosolic DNA sensors in immune cells is unclear. Here we show that malaria parasites inside red blood cells can engage host cytosolic innate immune cell receptors from a distance by secreting extracellular vesicles (EV) containing parasitic small RNA and genomic DNA. Upon internalization of DNA-harboring EVs by human monocytes, P. falciparum DNA is released within the host cell cytosol, leading to STING-dependent DNA sensing. STING subsequently activates the kinase TBK1, which phosphorylates the transcription factor IRF3, causing IRF3 to translocate to the nucleus and induce STING-dependent gene expression. This DNA-sensing pathway may be an important decoy mechanism to promote P. falciparum virulence and thereby may affect future strategies to treat malaria.


Conflict of interest statement

The authors declare no competing financial interests.

Figures

Fig. 1
Fig. 1
Characterization of vesicles released from P. falciparum-iRBCs. Cryo-EM images and size population data of vesicles from 3D7 and CS2 lines (bottom panels, scale bar 100 nm), uRBCs (top panels, scale bar 200 nm) and a small multivesicular population of EVs with a double membrane or containing one or two vesicles in the lumen (bottom left column, scale bar 100 nm). The qNano size distribution of EVs from iRBCs and vesicles from uRBCs (graph)
Fig. 2
Fig. 2
Packaging of the P. falciparum RNA species into EVs. a Bar graph of annotated and unannotated reads calculated as a percentage of total reads of each sample (Supplementary Table 1). Percentage alignment and mapping to H. sapiens (hg19; miRBase v.20, Ensembl v74 and tRNAscan-SE) and P. falciparum (ASM276v1; EnsemblProtists and tRNAscan-SE) genome and annotations from small RNA sequencing. b Venn diagram of the number of highly abundant miRNA species in iRBC-derived-EVs and uRBC vesicles. c Volcano plot of differentially expressed human miRNA in iRBC-derived EVs and uRBC-derived EVs (Supplementary Table 3). Normalized reads to RPM. ANOVA analysis, highlighted in blue: p≤0.05 (iRBC-ex vs uRBC-v) and ±2.0 fold change. d Pathway analysis of mRNA targets of miRNA differentially detected in EVs from iRBCs. Ingenuity Pathway Analysis was used to find direct and indirect relationships, with the validated human mature miRNA differently expressed in EVs from iRBCs and mRNA related to malaria. All edges are supported by at least 1 reference from the literature or from canonical information stored in the Ingenuity Pathways Knowledge Base. Downregulation or the absence of these miRNAs in vesicles would allow protein translation to occur without interference
Fig. 3
Fig. 3
Parasite EVs released during the early post-invasion stage contain gDNA. a P. falciparum-derived EVs and EVs derived from uRBCs stained with DAPI and widefield merged. b Draq5-red and Laurdan-blue stained EVs (right). c Agarose gel electrophoresis of DNase/RNase-treated or DNase/RNase-untreated Ev-DNA. d DNA extracted from EVs was digested with either S1 nuclease or dsDNase I. Digestion of parasite gDNA serves as control. e Relative copy number fold change (RCNFC) between EV and gDNA control for nuclear chromosomes
Fig. 4
Fig. 4
DNA-binding proteins and mitochondrial and apicoplast genes in EVs. a PCR for Ev-DNA markers, apicoplast (ssu-api), mitochondria (ssud) and nuclear genes (msp2, rap14, and gap40). Plasmid control PuF-1 was added externally to EVs prior to DNase I treatment. b P. falciparum msp2 gene Ev-FISH images of ring and trophozoite EVs and uRBC vesicles. c P. falciparum ssu-api and ssud genes Ev-FISH of ring EVs. d H3 and H4 protein WB analysis for 2–5 OP gradient fractions (F). e P. falciparum H4 protein IFA. f P. falciparum parasites release EVs during the early post-invasion phase. Fluorescence microscopy using DAPI in EVs produced by iRBCs across their life cycle. Images of EVs collected at 12, 24, 36 and 48 h post invasion. Giemsa stains (first column) show the state of the parasites prior to collecting EVs at each time point. g SR1 control IFA
Fig. 5
Fig. 5
P. falciparum EV intake by monocytes. a THP-1 cells were incubated with RNA (TO)-labeled vesicles derived from P. falciparum-iRBCs and imaged by IFC. Graphs show (green) TO-labeled positive cells, gated according to unlabeled cells. b THP-1 cells were incubated with DNA (HO)-labeled vesicles derived from P. falciparum-iRBCs and imaged by IFC. Graphs show (purple) HO-labeled positive cells, gated according to unlabeled cells. c THP-1 cells were incubated with RNA (TO)-labeled vesicles derived from P. falciparum-iRBCs or uRBCs or THP-1 cells were incubated with RNA (TO)-labeled P. falciparum EVs at 4 °C and imaged by IFC. Graphs show (orange) TO-labeled positive cells, gated according to unlabeled cells. d Histograms of image stream analysis data in c. e PBMCs were obtained from nine different healthy donors and were incubated with TO-(RNA)-labeled P. falciparum-derived EVs; monocytes were stained for CD14 and imaged by IFC. Graphs present the percentage of TO-labeled positive cells, gated according to unlabeled cells from three repeats. SD and T-test analysis **p ≤ 0.001. TO Thiazole Orange (for RNA staining), HO Hoechst (for DNA staining)
Fig. 6
Fig. 6
Ring stage P. falciparum-EVs activate immune gene induction in monocytes. a THP-1 cells were incubated with P. falciparum ring-stage, trophozoite-stage or uRBC-derived vesicles for 30 min, 3, 6, 12 and 24 h. RT–PCR was performed for the products of IFNA, IFNB, CXCL10, IFIT1, and CCL5. SD and T-test analysis *p ≤ 0.05. b THP-1 cells were incubated with P. falciparum ring stage, trophozoite-stage or uRBC-derived vesicles for 30 min, 3, 6, 12 and 24 h. ELISA were performed for CCL5 and HEK blue IFNα/β. SD and T-test analysis *p ≤ 0.05. c Human primary CD14+ cells were incubated with P. falciparum ring stage-derived or uRBC-derived vesicles for 1, 6, and 24 h. RT–PCR was performed for IFNA, IFNB, CXCL10, IFIT1, and CCL5. SD and T-test analysis *p ≤ 0.05
Fig. 7
Fig. 7
P. falciparum DNA stimulates innate immune gene induction in monocytes. a THP-1 cells were transfected or incubated with P. falciparum genomic DNA for 1, 6, and 24 h. RT–PCR was performed for the products IFNα, IFNB, CXCL10, IFIT1 and CCL5. SD and T-test analysis *p ≤ 0.05, **p ≤ 0.01. b THP-1 cells were transfected or incubated with poly(dA:dT) for 1, 6, and 24 h. RT–PCR was performed for IFNA, IFNB, CXCL10, IFIT1 and CCL5. SD and T-test analysis *p ≤ 0.05, **p ≤ 0.01. c THP-1 cells were transfected or incubated with P. falciparum genomic DNA for 1, 6, and 24 h. ELISA were performed for CXCL10 and CCL5 and HEK blue IFNα/β. SD and T-test analysis *p ≤ 0.05. d THP-1 cells were transfected or incubated with poly(dA:dT) for 1, 6, and 24 h. ELISA were performed for CXCL10 and CCL5 and HEK blue IFNα/β. SD and T-test analysis *p ≤ 0.05
Fig. 8
Fig. 8
P. falciparum EV-DNA activates STING-dependent signaling in monocytes. a. THP-1 or STING KO THP-1 cells were incubated with P. falciparum ring-stage-derived or uRBC-derived vesicles for 1, 6 and 24 h. RT–PCR was performed for IFNA, IFNB, CXCL10, IFIT1 and CCL5. SD and T-test analysis *p ≤ 0.05. b. THP-1 or STING KO THP-1 cells were incubated with P. falciparum ring-stage or uRBC-derived vesicles for 1, 6 and 24 h. An ELISA assay was performed for CCL5 and CXCL10. HEK blue IFNα/β was performed. SD and T-test analysis *p ≤ 0.05. c. THP-1 cells were incubated with P. falciparum ring-stage-derived vesicles, P. falciparum gDNA or transfected with poly(dA:dT) for 24 h. WB analysis was performed for STING, pIRF3, pTBK1 and α actin, sm-size marker. d. THP-1 cells were incubated with P. falciparum ring stage-derived vesicles for 24 h. Confocal microscopy images were taken for STING, pIRF3, pTBK1 (FITC), and DAPI. Scale bar 10 μm

References

    1. Gazzinelli RT, Kalantari P, Fitzgerald KA, Golenbock DT. Innate sensing of malaria parasites. Nat. Rev. Immunol. 2014;14:744–757. doi: 10.1038/nri3742. - DOI - PubMed
    1. Chen Q, Sun L, Chen ZJ. Regulation and function of the cGAS-STING pathway of cytosolic DNA sensing. Nat. Immunol. 2016;17:1142–1149. doi: 10.1038/ni.3558. - DOI - PubMed
    1. Schlee M, Hartmann G. Discriminating self from non-self in nucleic acid sensing. Nat. Rev. Immunol. 2016;16:566–580. doi: 10.1038/nri.2016.78. - DOI - PMC - PubMed
    1. Zevini, A., Olagnier, D. & Hiscott, J. Crosstalk between cytoplasmic RIG-I and STING sensing pathways. Trends Immunol., doi:10.1016/j.it.2016.12.004 (2017). - PMC - PubMed
    1. Tao J, Zhou X, Jiang Z. cGAS-cGAMP-STING: The three musketeers of cytosolic DNA sensing and signaling. IUBMB. Life. 2016;68:858–870. doi: 10.1002/iub.1566. - DOI - PubMed

Publication types

MeSH terms