. 2017 Dec 7;7(1):17141.
doi: 10.1038/s41598-017-17362-6.

A Pilot Characterization of the Human Chronobiome

Affiliations

A Pilot Characterization of the Human Chronobiome

Carsten Skarke et al. Sci Rep. .

Abstract

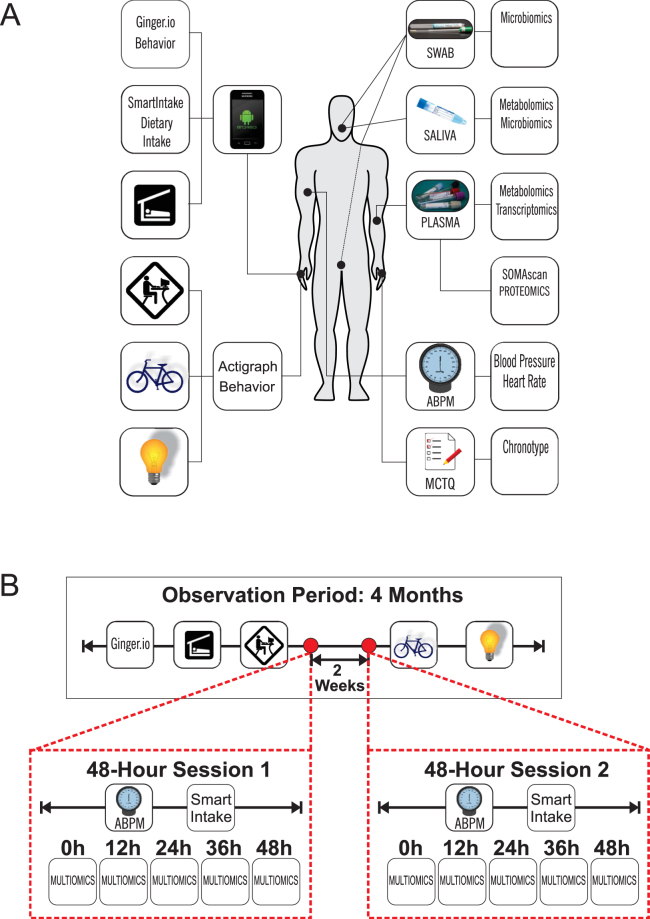
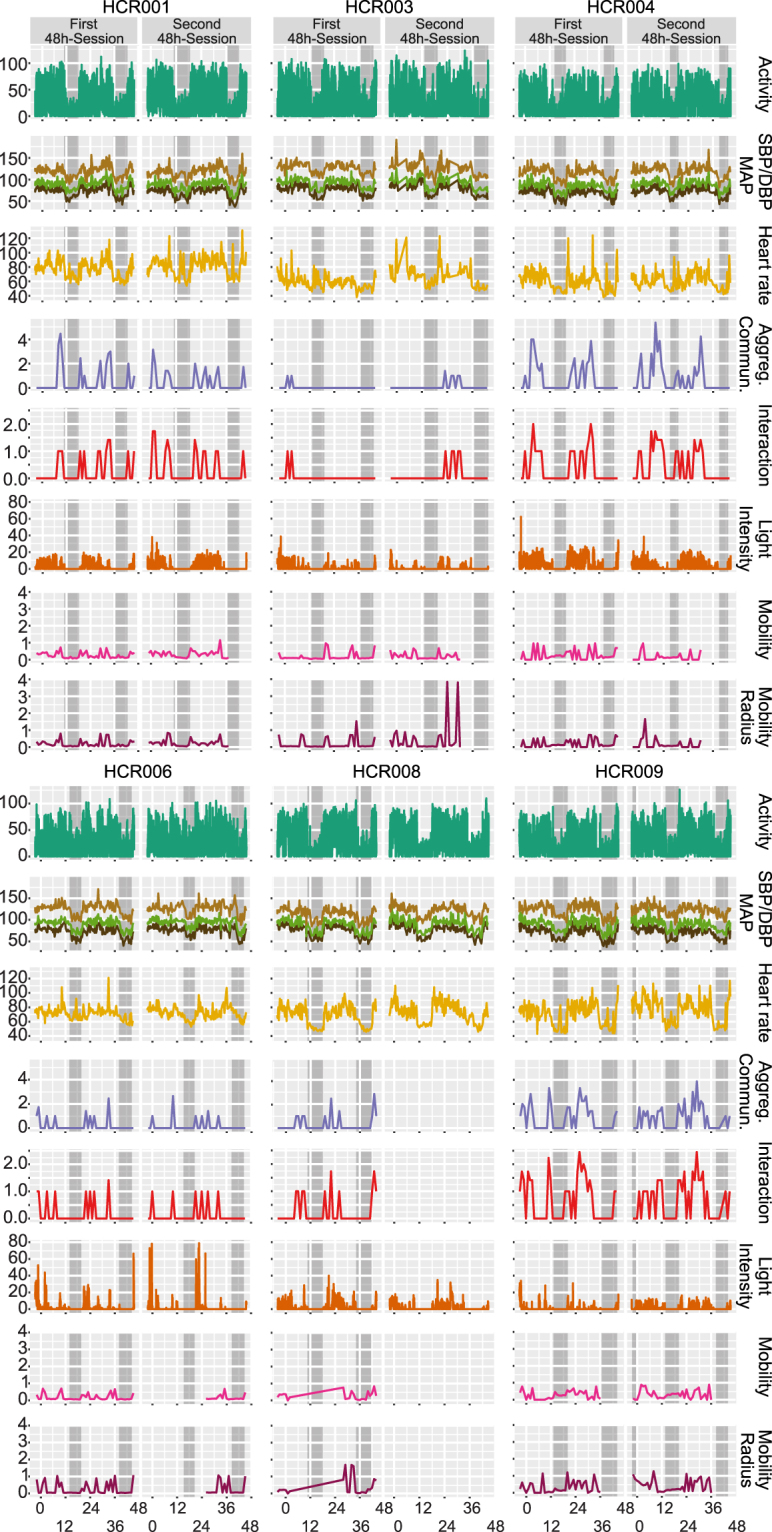
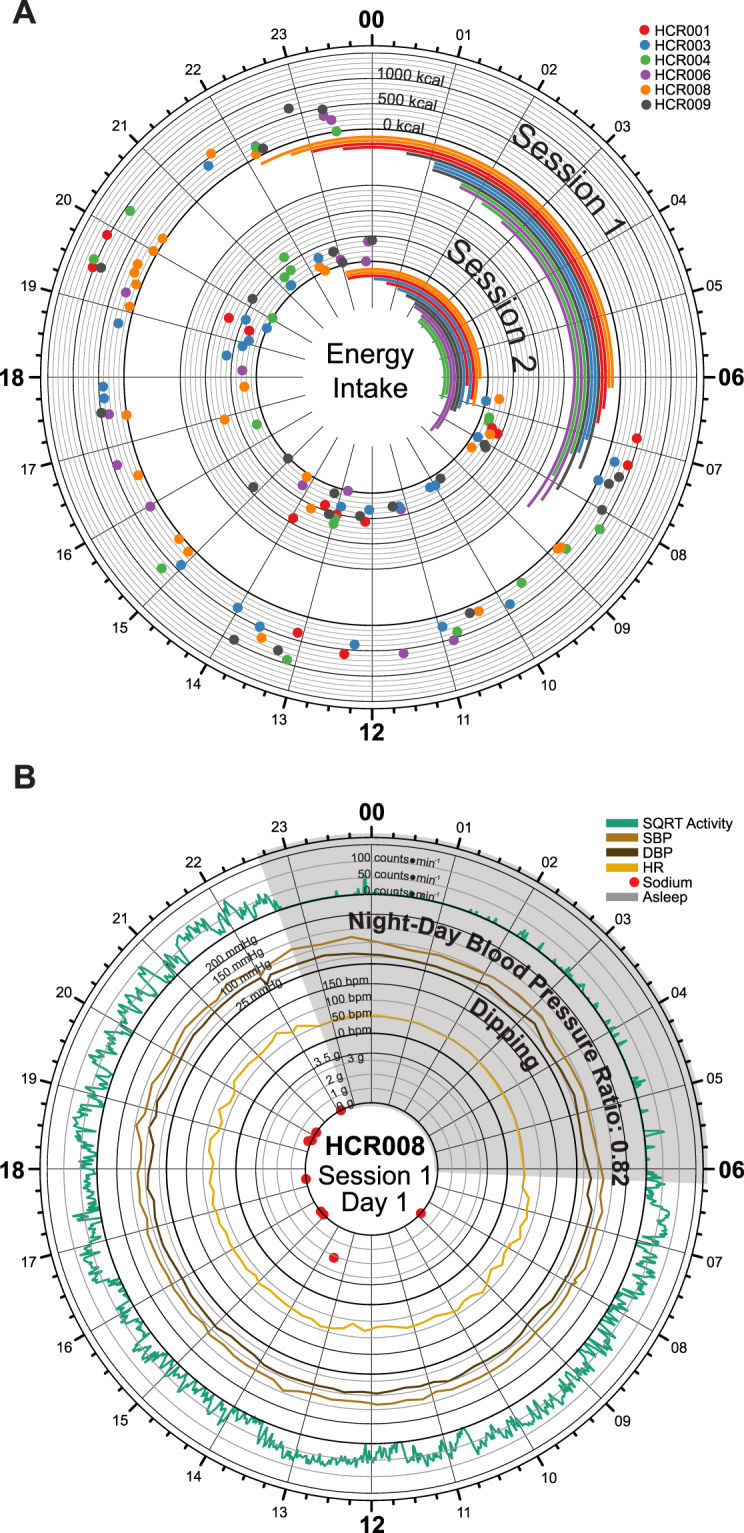
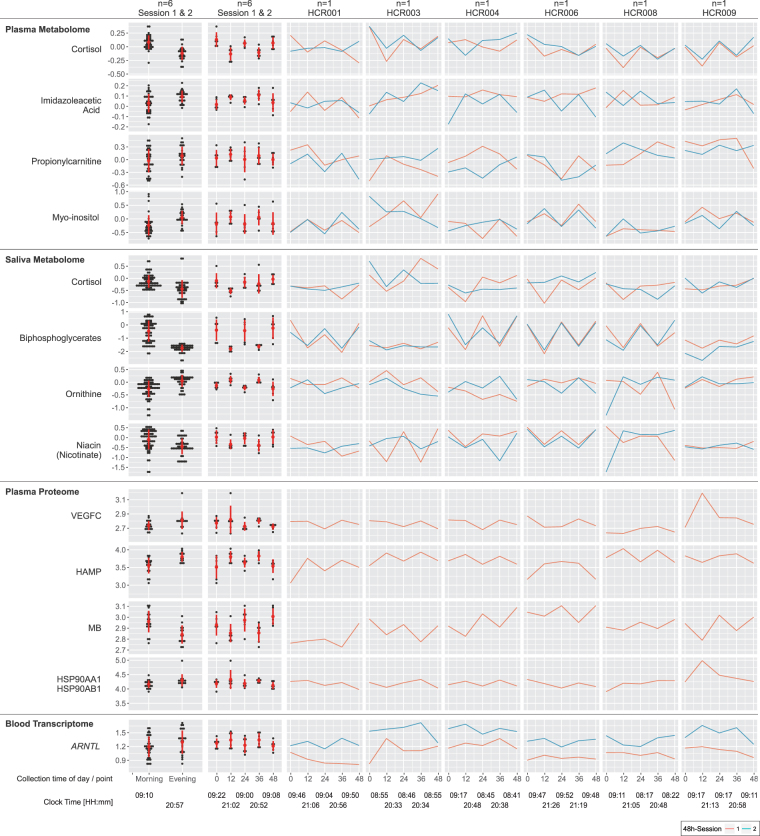
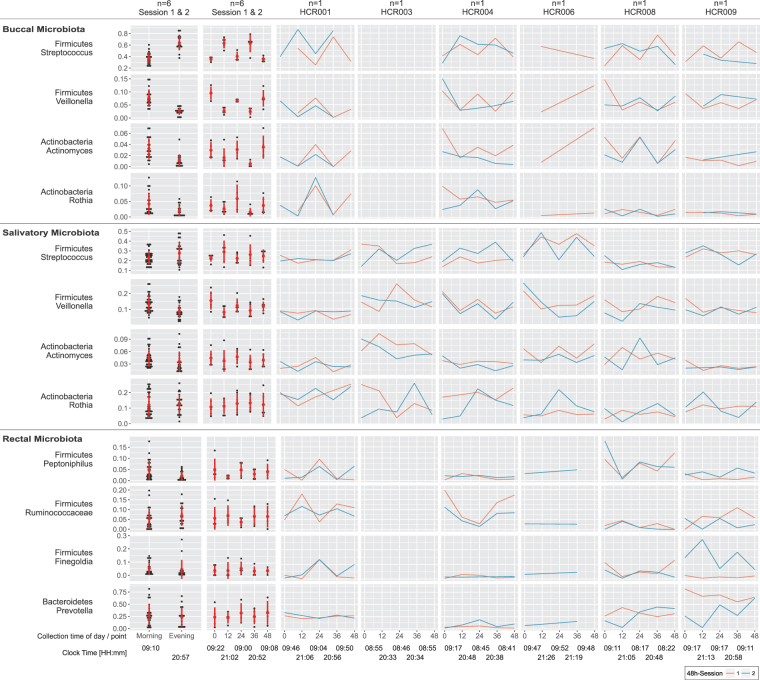
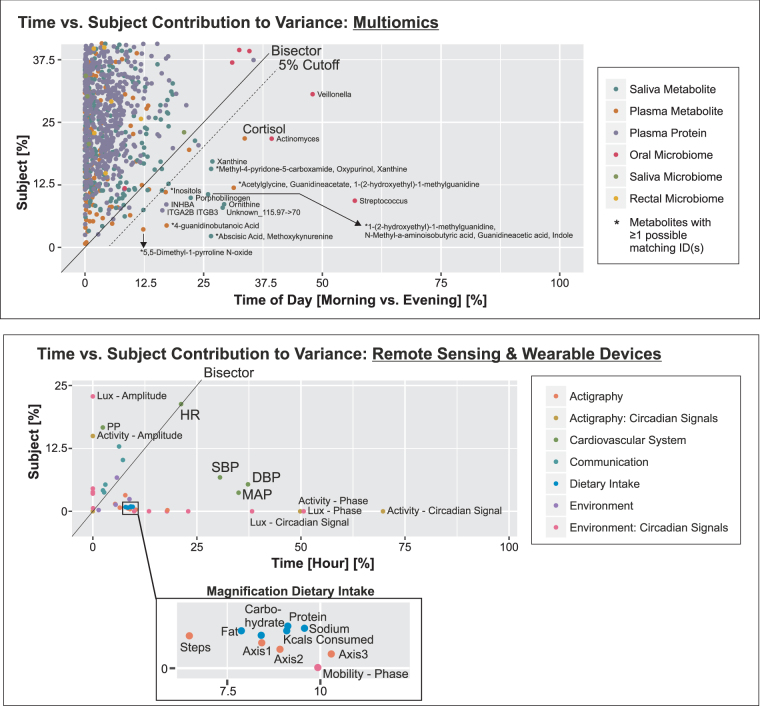
Physiological function, disease expression and drug effects vary by time-of-day. Clock disruption in mice results in cardio-metabolic, immunological and neurological dysfunction; circadian misalignment using forced desynchrony increases cardiovascular risk factors in humans. Here we integrated data from remote sensors, physiological and multi-omics analyses to assess the feasibility of detecting time dependent signals - the chronobiome - despite the "noise" attributable to the behavioral differences of free-living human volunteers. The majority (62%) of sensor readouts showed time-specific variability including the expected variation in blood pressure, heart rate, and cortisol. While variance in the multi-omics is dominated by inter-individual differences, temporal patterns are evident in the metabolome (5.4% in plasma, 5.6% in saliva) and in several genera of the oral microbiome. This demonstrates, despite a small sample size and limited sampling, the feasibility of characterizing at scale the human chronobiome "in the wild". Such reference data at scale are a prerequisite to detect and mechanistically interpret discordant data derived from patients with temporal patterns of disease expression, to develop time-specific therapeutic strategies and to refine existing treatments.


Conflict of interest statement

The authors declare that they have no competing interests.

Figures

Figure 1
Figure 1
Study Design. (A) Study participants were equipped with remote sensing devices to collect behavioral and environmental data including activity, communication, mobility, sleep-wake times, dietary intake and light exposure. Clinical assessments included ambulatory blood pressure and heart rate. (B) The observation time for the biosensor-derived data was a total of four months with two 48-hour sessions (Session 1 & 2) scheduled two weeks apart to extend the biosensor platform by ambulatory blood pressure monitoring (ABPM) and timestamped dietary intake (SmartIntake) as well as by collection of timed biospecimens for multiomics analysis at 12-hour intervals.
Figure 2
Figure 2
Remote Sensing, Blood Pressure & Heart Rate. Horizontal panels display the following data for each of the n = 6 participants: activity [square root of vector magnitude], systolic, mean arterial, and diastolic blood pressure [mmHg SBP and DBP], heart rate [bpm], aggregate communication [square root of the sum of counts of phone calls and text messages], interaction [square root of counts ∙ min−1], light intensity [square root of lux ∙ min−1], and mobility/mobility radius [square root of miles] sampled over 48 hours during the first and second sessions. Self-reported sleep times are marked as grey boxes.
Figure 3
Figure 3
Dietary Intake by Remote Food Photography. (A) Time-of-day dependent energy intake for all subjects during session 1 (outer circle) and session 2 (inner circle). The data in each session track display energy intake for two full days of each session. 24-hour clock times are listed around the edge of the plot, with “00” corresponding to midnight, and “12” corresponding to noon. Dots are color-coded by subject and indicate the energy intake (kcal) at the corresponding clock time. Dark axis lines mark 0, 500, 1000, and 1500 kcal consumed. Lighter axis lines mark energy intake in 100 kcal steps. Sleep spans are also color-coded by subject and are indicated using the bars below each of the corresponding session. (B) Time-of-day dependent fluctuations in activity (counts * min−1, green), systolic (mmHg, brown) and diastolic (mmHg, black) blood pressure, heart rate (bpm, orange) plotted with time-specific dietary intake of sodium (g, red); sleep time marked as grey wedge. As expected, a dipping phenotype in blood pressure was observed for this subject.
Figure 4
Figure 4
Metabolomics, Proteomics & Transcriptomics. Time-of-day dependent differences in metabolite/protein/gene levels are displayed selecting the top-ranked candidates per non-parametric statistical test: (i) aggregated by morning/evening for all n = 6 subjects (left column), (ii) aggregated by time point (0 h - morning, 12 h - evening, 24 h - morning, 36 h - evening, 48 h - morning) for all n = 6 subjects (second left column), and (iii) individual time series from session 1 (red) and session 2 (blue) for each subject (6 columns to the right). The red circles and bars in the two left-most columns indicate the mean and standard deviations for each aggregated dataset, respectively. Please note that data were visualized on a log10 scale.
Figure 5
Figure 5
Microbiomics, Salivatory, Buccal & Rectal. Time-of-day dependent differences in the relative fraction of bacterial genera are displayed: (i) aggregated by morning/evening for all n = 6 subjects (left column), (ii) aggregated by time point (0 h - morning, 12 h - evening, 24 h - morning, 36 h - evening, 48 h - morning) for all n = 6 subjects (second left column), and (iii) individual time series from session 1 (red) and session 2 (blue) for each subject (6 columns to the right). The red circles and bars in the two left-most columns indicate the mean and standard deviations for each aggregated dataset, respectively. Please note that data were visualized on a log10 scale.
Figure 6
Figure 6
Time-versus-Subject Contribution to Variance Analysis. (a) Percent contribution to variance by subject versus time-of-day is displayed for the multiomic, e.g. for cortisol, as expected, the time variance contribution is higher than by subject. Note that time-of-day refers to the three morning and two evening replicates within one 48 hour session. We defined a 5% cutoff (dotted line) to discern variables with a higher time-of-day from subject contribution to variance. (b) Readouts collected from remote sensors and wearable devices segregate according to the percent degree of how much variance is contributed by subject versus time, e.g. for blood pressure (SBP, DBP) the variance contribution by time is higher than by subject, thus underscoring the diurnality of this phenotype. (SBP/DBP: systolic/diastolic blood pressure; MAP: mean arterial pressure; HR: heart rate; PP: pulse pressure). (Insert) This blow up magnifies for dietary food the percent contribution to variance by subject versus time-of-day. Time-specific data was collected by the phone application SmartIntake© during the 48 hrs sessions. (Axis 1–3 refer to the Actigraph’s accelerometers).
Figure 7
Figure 7
Variance Correlation Matrix. The heatmap displays the degree of variance explained across outputs collected from n = 6 healthy volunteers during the two 48-hour sessions. The percentage of variance explained (R2) is depicted by the color scale ranging from white, i.e. regression provides a poor fit for the indicated pair of variables, to dark blue, where the regression produces a good fit between the two variables.

References

    1. Curtis AM, Fitzgerald GA. Central and peripheral clocks in cardiovascular and metabolic function. Ann Med. 2006;38:552–559. doi: 10.1080/07853890600995010. - DOI - PubMed
    1. Chang DC, Reppert SM. The circadian clocks of mice and men. Neuron. 2001;29:555–558. doi: 10.1016/S0896-6273(01)00230-6. - DOI - PubMed
    1. King DP, Takahashi JS. Molecular genetics of circadian rhythms in mammals. Annu Rev Neurosci. 2000;23:713–742. doi: 10.1146/annurev.neuro.23.1.713. - DOI - PubMed
    1. Yang G, et al. Knitting up the raveled sleave of care. Sci Transl Med. 2013;5:212rv213. - PubMed
    1. Morris CJ, Aeschbach D, Scheer FA. Circadian system, sleep and endocrinology. Mol Cell Endocrinol. 2012;349:91–104. doi: 10.1016/j.mce.2011.09.003. - DOI - PMC - PubMed

Publication types

LinkOut - more resources