. 2017 Dec 7;7(1):17124.
doi: 10.1038/s41598-017-17300-6.

Differential Raman backscattering cross sections of black carbon nanoparticles

Affiliations

Differential Raman backscattering cross sections of black carbon nanoparticles

Kim Cuong Le et al. Sci Rep. .

Abstract

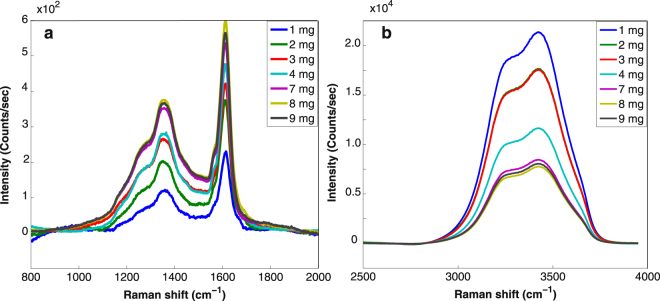
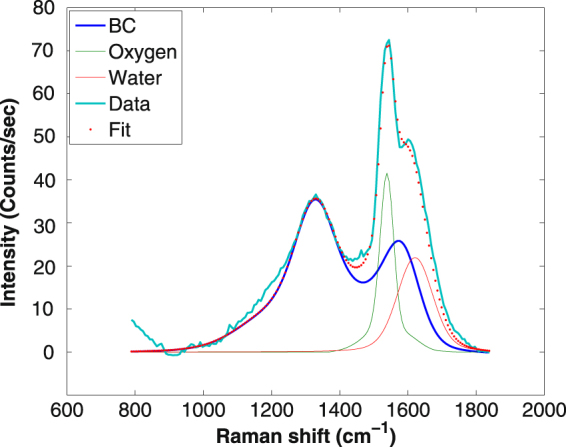
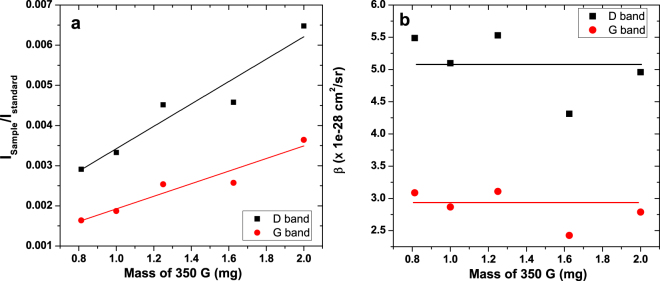
We report the measurements of the differential Raman backscattering cross sections for several carbonaceous ultrafine particles of environmental relevances. These were obtained by dispersing the target particles in liquid water which was used as the internal standard reference. The optical collection was performed in a configuration to ensure a detection as close as possible to the backward direction. These are the first cross sections on black carbon-type particles although Raman spectroscopy is widely used in Carbon science. The high values of the cross sections, few 10-28 cm2.sr-1.atom-1, reflect resonance effects that take advantages of the disordered polyaromatic structures. Because they were measured in conditions intended to mimic the aerosol phase, these measurements provide a crucial step to move toward quantitative Raman spectroscopy and enable development of dedicated teledetection of black carbon in the atmosphere and in combustion chambers.


Conflict of interest statement

The authors declare that they have no competing interests.

Figures

Figure 1
Figure 1
Spectra from the dispersion of several BC particles in liquid water, measured close to the backward direction, during illumination of the sample by a cw laser at 532 nm. Experimental conditions were similar except the concentrations. The horizontal scales are the Raman shift relatively to the incident photon energy. The concentrations are indicated. The dominant band at about 3500 cm−1 is the Raman band of liquid water involving the O-H stretching mode.
Figure 2
Figure 2
Coal particles Raman spectrum in the form of powder superimposed to that of the coal particles Raman spectrum dispersed in liquid water. The underlying continuum were subtracted by a simple linear background.
Figure 3
Figure 3
Panel (a) Evolution of the coal particles Raman bands as a function of concentration. Panel (b) Evolution of the liquid water Raman band (stretching mode) as a function of concentration. Contribution of the water bending mode was subtracted, as contrained by the pure water Raman spectrum. Background was subtracted by a simple linear shape.
Figure 4
Figure 4
Panel (a) Intensity ratios of the Raman bands as a function of the coal particles concentrations. The slopes are found to be 0.0027 and 0.0016 for the D and G bands, respectively. Panel (b) DCRS for the G (red lines and points) and D (black line and points) bands of coal particles deduced at all concentrations, together with the average value.
Figure 5
Figure 5
Deconvolution of the Raman spectrum of Ensaco 350G carbon black nanoparticles dispersed in liquid water (about 2 mg in 40 ml of water). The bright blue line is the experimentally observed Raman spectrum; The blue solid line is the Raman spectrum of the CB in form of powder; The green solid line is the scaled Raman signal of O2; The red solid line is the fitted bending Raman band of water; The red dot line is the fitted spectrum from the three components contributing to the experimental data.
Figure 6
Figure 6
Panel (a) Intensity ratios of the Raman bands as a function of the CB nanoparticles concentrations. The slopes are found to be 0.0028 and 0.0016 for the D and G bands, respectively. Panel (b) DCRS for the G (red lines and points) and D (black line and points) bands of the CB nanoparticles deduced at all concentrations, together with the average value.
Figure 7
Figure 7
Deconvolution of the Raman spectrum of 9 mg of soot SRM 2975 (NIST) in 40 ml of water. The bright blue line is the experimentally observed Raman spectrum; The blue solid line is Raman spectrum of sample in form of powder; The green solid line is Raman signal of O2 and water; the red denoted line is the sum of the 3 components.
Figure 8
Figure 8
Scheme of the experimental setup. M1 is a laser mirror at 532 nm, M2 a broadband dielectric mirror covering the visible range, L1 and L2 two focus lengths.

References

    1. Ehrenfreund P, Charnley S. Organic molecules in the interstellar medium, comets, and meteorites: A voyage from dark clouds to the early earth. Ann. Rev. Astrophys. Astron. 2000;38:427. doi: 10.1146/annurev.astro.38.1.427. - DOI
    1. Delhaes, P. Carbon-based Solids and Materials (John Wiley& Sons, Ltd, 2011).
    1. Bond TC, et al. Bounding the role of black carbon in the climate system: A scientific assessment. Journal of geophysical research. 2013;118:5380–5552.
    1. Buseck PR, Adachi K, Gelencsér A, Tompa É, Pósfai M. Ns-Soot: A Material-Based Term for Strongly Light-Absorbing Carbonaceous Particles. Aerosol Science and Technology. 2014;48:777–788. doi: 10.1080/02786826.2014.919374. - DOI
    1. Reid JS, et al. Observing and understanding the Southeast Asian aerosol system by remote sensing: An initial review and analysis for the Seven Southeast Asian Studies (7SEAS) program. Atmospheric Research. 2013;122:403–468. doi: 10.1016/j.atmosres.2012.06.005. - DOI

Publication types