

Relaxivity of Ferumoxytol at 1.5 T and 3.0 T
- PMID: 29215401
- PMCID: PMC6143390
- DOI: 10.1097/RLI.0000000000000434
Relaxivity of Ferumoxytol at 1.5 T and 3.0 T
Abstract
Objectives: The aim of this study was to determine the relaxation properties of ferumoxytol, an off-label alternative to gadolinium-based contrast agents, under physiological conditions at 1.5 T and 3.0 T.
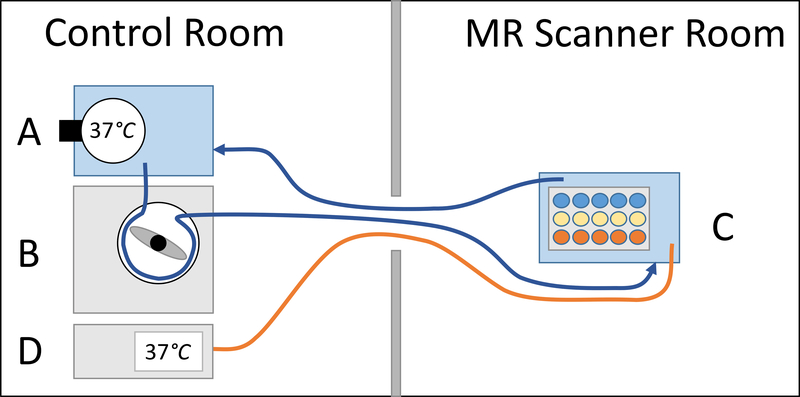
Materials and methods: Ferumoxytol was diluted in gradually increasing concentrations (0.26-4.2 mM) in saline, human plasma, and human whole blood. Magnetic resonance relaxometry was performed at 37°C at 1.5 T and 3.0 T. Longitudinal and transverse relaxation rate constants (R1, R2, R2*) were measured as a function of ferumoxytol concentration, and relaxivities (r1, r2, r2*) were calculated.
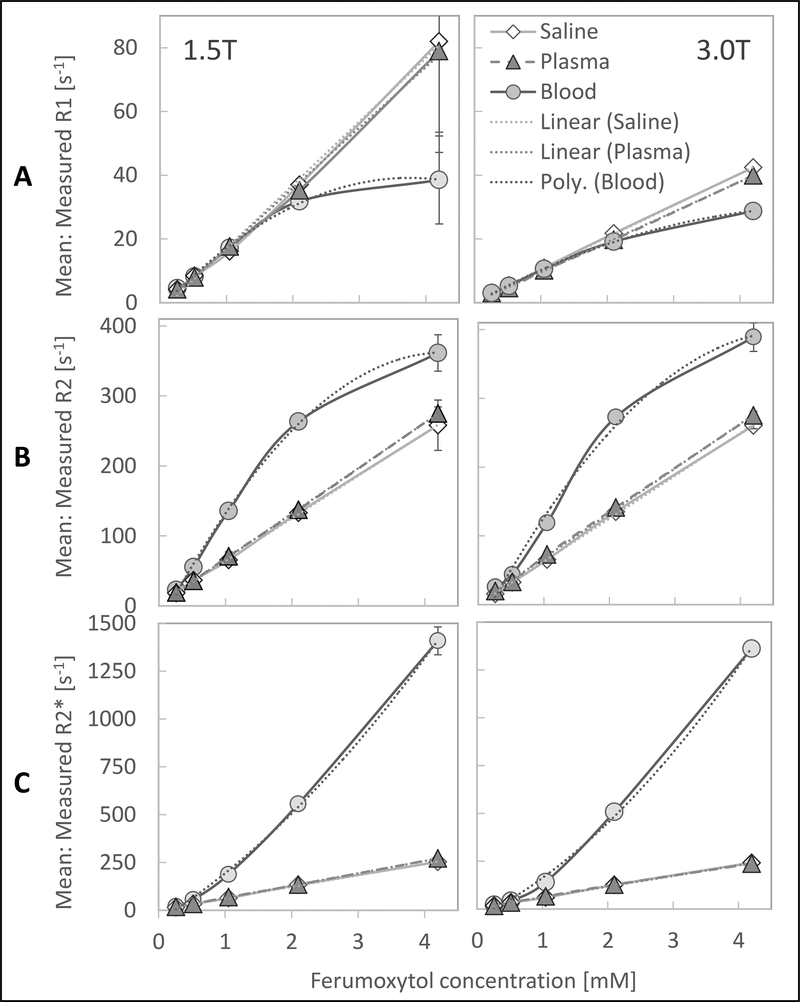
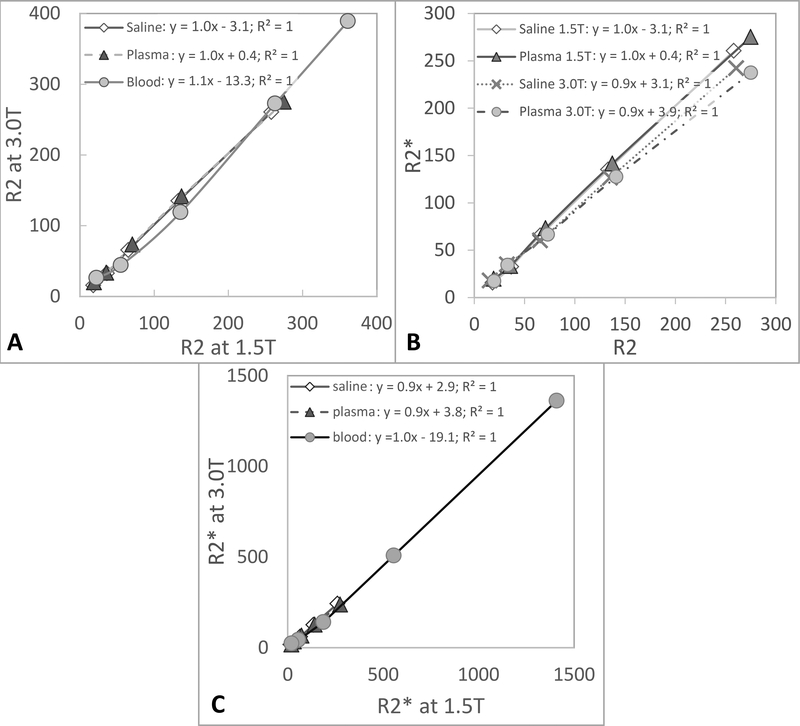
Results: A linear dependence of R1, R2, and R2* on ferumoxytol concentration was found in saline and plasma with lower R1 values at 3.0 T and similar R2 and R2* values at 1.5 T and 3.0 T (1.5 T: r1saline = 19.9 ± 2.3 smM; r1plasma = 19.0 ± 1.7 smM; r2saline = 60.8 ± 3.8 smM; r2plasma = 64.9 ± 1.8 smM; r2*saline = 60.4 ± 4.7 smM; r2*plasma = 64.4 ± 2.5 smM; 3.0 T: r1saline = 10.0 ± 0.3 smM; r1plasma = 9.5 ± 0.2 smM; r2saline = 62.3 ± 3.7 smM; r2plasma = 65.2 ± 1.8 smM; r2*saline = 57.0 ± 4.7 smM; r2*plasma = 55.7 ± 4.4 smM). The dependence of relaxation rates on concentration in blood was nonlinear. Formulas from second-order polynomial fittings of the relaxation rates were calculated to characterize the relationship between R1blood and R2 blood with ferumoxytol.
Conclusions: Ferumoxytol demonstrates strong longitudinal and transverse relaxivities. Awareness of the nonlinear relaxation behavior of ferumoxytol in blood is important for ferumoxytol-enhanced magnetic resonance imaging applications and for protocol optimization.
Figures
References
-
- Lu M, Cohen MH, Rieves D, Pazdur R. FDA report: Ferumoxytol for intravenous iron therapy in adult patients with chronic kidney disease. Am J Hematol. 2010;85(5):315–9. - PubMed
-
- Fraum TJ, Ludwig DR, Bashir MR, Fowler KJ. Gadolinium-based contrast agents: A comprehensive risk assessment. J Magn Reson Imaging. 2017;46(2):338–53. - PubMed
-
- PRAC 2017;Pages. Accessed at http://www.ema.europa.eu/docs/en_GB/document_library/Press_release/2017/... Accessed March 10, 2017.
-
- ACR 2017;Pages. Accessed at https://www.acr.org/About-Us/Media-Center/Press-Releases/2017-Press-Rele.... Accessed July 22, 2017 2017.
Publication types
MeSH terms
Substances
Grants and funding
LinkOut - more resources
Full Text Sources
Other Literature Sources
Medical
