. 2017 Dec 7;12(12):e0189130.
doi: 10.1371/journal.pone.0189130. eCollection 2017.

Phenotypic characterization of Synechocystis sp. PCC 6803 substrains reveals differences in sensitivity to abiotic stress

Affiliations

Phenotypic characterization of Synechocystis sp. PCC 6803 substrains reveals differences in sensitivity to abiotic stress

Tomáš Zavřel et al. PLoS One. .

Abstract

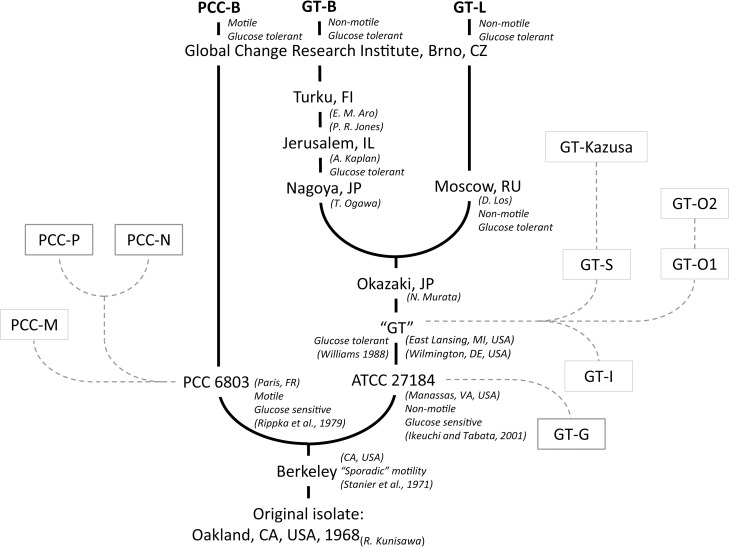
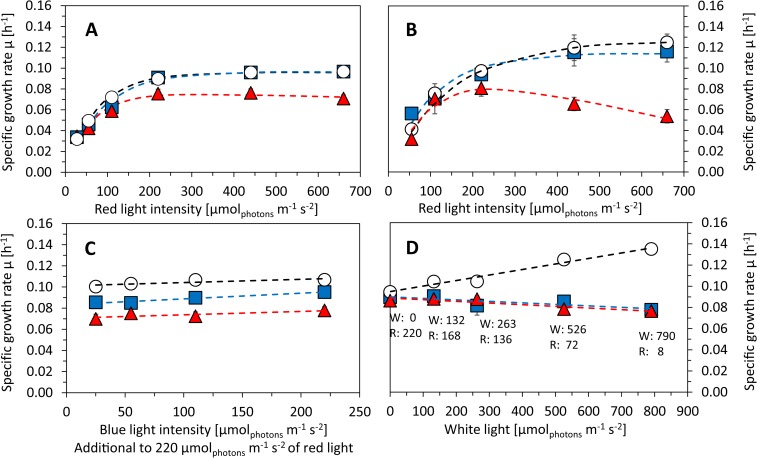
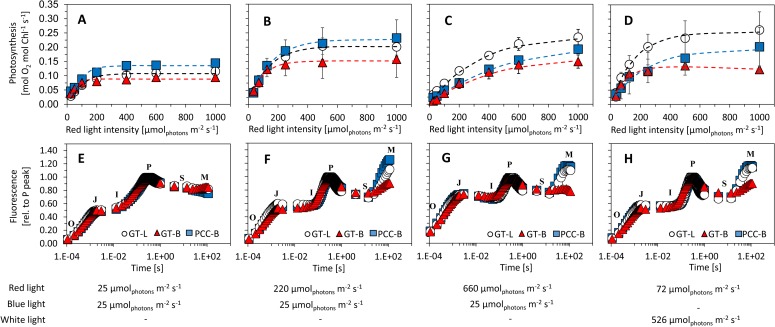
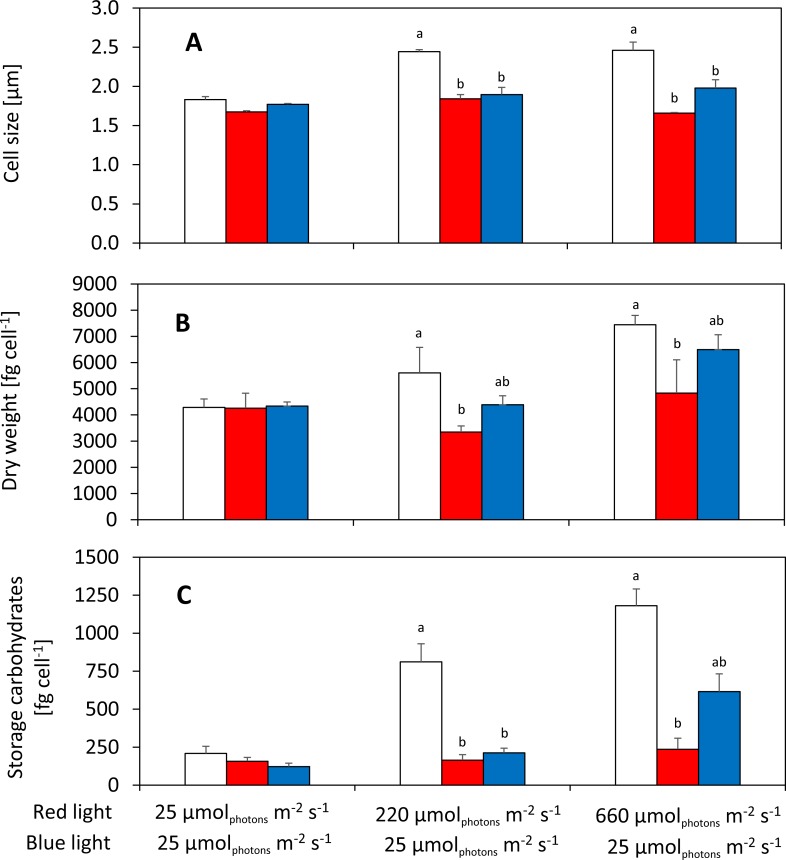
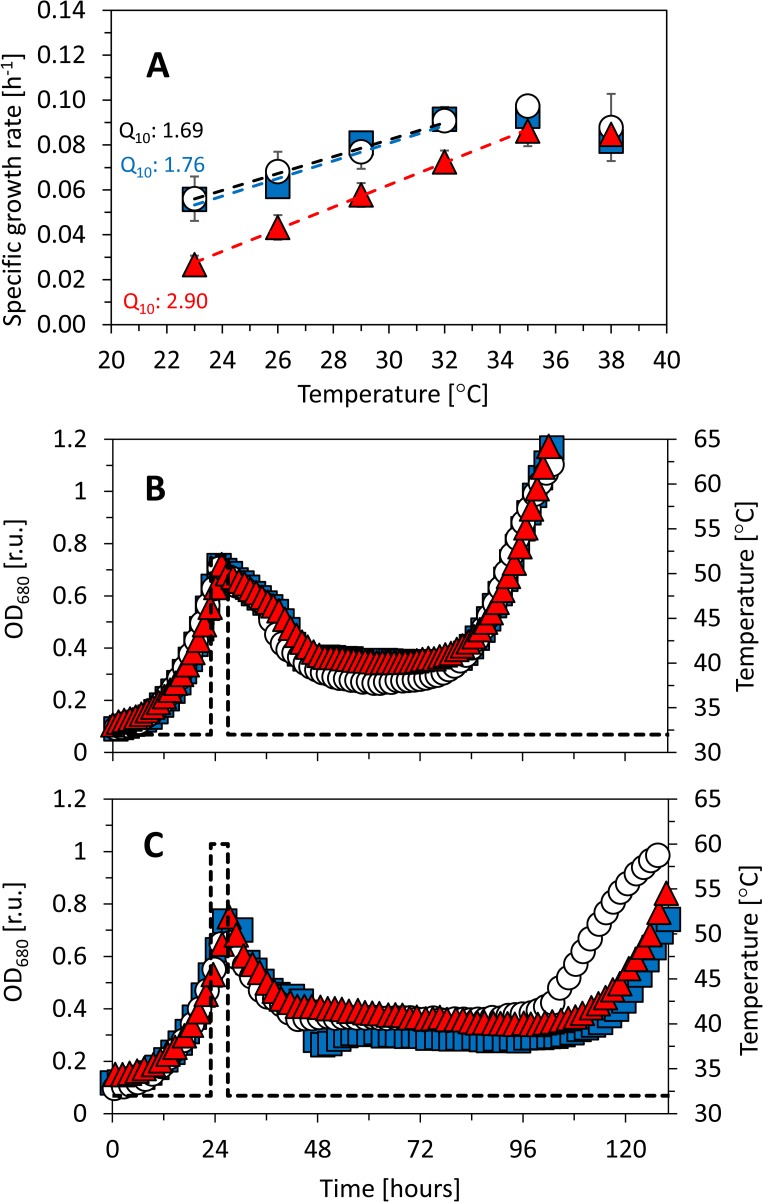
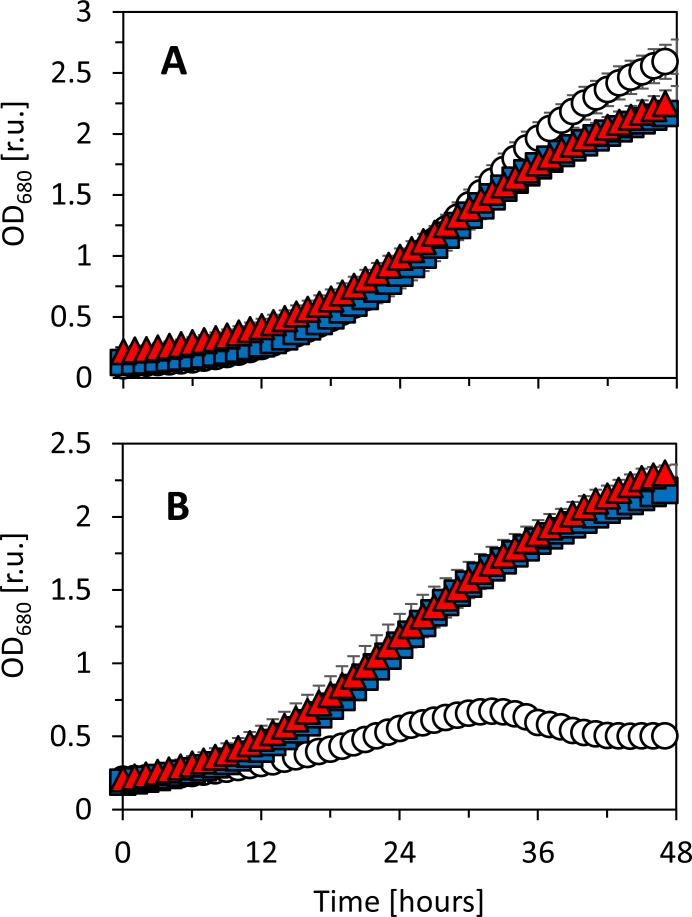
Synechocystis sp. PCC 6803 is a widely used model cyanobacterium, whose substrains can vary on both genotype and phenotype levels. Previously described phenotypic variations include ability of mixotrophic growth, ability of movement on agar plates and variations in pigments composition or cell size. In this study, we report for the first time significant variation among Synechocystis substrains in complex cellular traits such as growth rate, photosynthesis efficiency, cellular dry weight and cellular composition (including protein or carbohydrates content). We also confirmed previously reported differences in cell size. Synechocystis cultures were cultivated in controlled environment of flat panel photobioreactors under red, blue and white light of intensities up to 790 μmol(photons) m-2 s-1, temperatures 23°C-60°C, input CO2 concentrations ranging from 400 to 15 000 ppm and in BG11 cultivation medium with and without addition of NaCl. Three Synechocystis substrains were used for the comparative experiments: GT-L, GT-B (Brno, CZ) and PCC-B (Brno, CZ). Growth rates of Synechocystis GT-B were inhibited under high intensities of red light (585-670 nm), and growth rates of both substrains GT-B and PCC-B were inhibited under photons of wavelengths 485-585 nm and 670-700 nm. Synechocystis GT-B was more sensitive to low temperatures than the other two tested substrains, and Synechocystis GT-L was sensitive to the presence of NaCl in the cultivation media. The results suggest that stress sensitivity of commonly used Synechocystis substrains can strongly vary, similarly as glucose tolerance or motility as reported previously. Our study further supports the previous statement that emphasizes importance of proper Synechocystis substrains selection and awareness of phenotypical differences among Synechocystis substrains which is crucial for comparative and reproducible research. This is highly relevant for studies related to stress physiology and development of sustainable biotechnological applications.


Conflict of interest statement

Competing Interests: The authors have declared that no competing interests exist.

Figures

Fig 1
Fig 1. History of the Synechocystis sp. PCC 6803 substrains PCC-B, GT-B and GT-L as used in the current study (full lines), and their putative relation to Synechocystis substrains that have identified genome sequences (dashed lines, according to Ding et al. (2015) [13]).
The phenotypic properties of individual Synechocystis substrains are listed in accordance with Ikeuchi and Tabata (2001), Rippka et al. (1979), and Williams (1988) [7,16,50], as well as in accordance to personal communication with members of laboratories in Jerusalem and in Moscow.
Fig 2
Fig 2. Growth rates of Synechocystis sp. PCC 6803 substrains GT-L (white circles), GT-B (red triangles) and PCC-B (blue squares) under increasing red, blue and white light.
A, B–Red light was set to intensities of 25–660 μmol(photons) m-2 s-1 and it was supplemented with 25 μmol(photons) m-2 s-1 of blue light. The experiments were performed at 32°C (A) and 35°C (B). C–Red light of 220 μmol(photons) m-2 s-1 was supplemented with 25–220 μmol(photons) m-2 s-1 of blue light under 32°C. D–Red light of 220–8 μmol(photons) m-2 s-1 was supplemented with white light of 0–790 μmol(photons) m-2 s-1 (at 32°C) in order to keep the red photons (as a combination of red light and part of the white spectra) constant at 220 μmol(photons) m-2 s-1 (according to [19]). All experiments were carried out in a quasi-continuous regime as described in the main text under growth saturating CO2 concentration of 5 000 ppm. Each point represents average of at least four independent experiments, error bars represent standard errors. The dashed lines in panels A and B represent fitting of the data points by the function derived by Platt et al. (1980) [51]. The dashed lines in panels C and D represent linear fitting of the data points by the least squares method. Legend in panel D represents particular combinations of white light (W) and red light (R) in units of μmol(photons) m-2 s-1.g.
Fig 3
Fig 3
Photosynthesis performance of Synechocystis substrains GT-L (white circles), GT-B (red triangles) and PCC-B (blue squares) evaluated by measurement of oxygen evolution (A, B, C, D) and fast pigment fluorescence kinetics (O-J-I-P-S-M; E, F, G, H). The cultures were adapted to 25 μmol(photons) m-2 s-1 of red and blue light (A, E), 220 μmolphotons m-2 s-1 of red light complemented with 25 μmol(photons) m-2 s-1 of blue light (B, F), 660 μmol(photons) m-2 s-1 of red complemented with 25 μmol(photons) m-2 s-1 of blue light (C, G) and 72 μmolphotons m-2 s-1 of red light complemented with 526 μmol(photons) m-2 s-1 of white light (D, H). The cells were cultivated at 32°C under input CO2 concentration of 5 000 ppm in a quasi-continuous regime as described in the main text. The cells were darkened for 15 minutes prior to fluorescence measurement. Each point represents average from at least four independent experiments, the error bars represent standard errors. The pigment fluorescence curves are visualized without error bars for better clarity. The dashed lines in panels A–D represent fitting of the data points by the function derived by Platt et al. (1980) [51].
Fig 4
Fig 4
Cell size (A), dry weight (B), and glycogen content (C) of Synechocystis substrains GT-L (white bars), GT-B (red bars) and PCC-B (blue bars) under 25, 220 and 660 μmol(photons) m-2 s-1 of red light complemented with 25 μmol(photons) m-2 s-1 of blue light. The cells were cultivated at 32°C under input CO2 concentration of 5 000 ppm in a quasi-continuous regime as described in the main text. Each value represents average from at least three independent experiments, error bars represent standard errors. Differences in cell size, dry weight and glycogen content among Synechocystis substrains are marked by letters above the particular columns (Tukey’s HSD post-hoc test following one-way ANOVA: p<0.05).
Fig 5
Fig 5
Growth rates of Synechocystis sp. PCC 6803 substrains GT-L (white circles), GT-B (red triangles) and PCC-B (blue squares) under temperatures 23°C—38°C during cultivation in a quasi-continuous regime (A) and after introduction of heat shock of 52°C (B) and 60°C (C) during the batch growth. A–The Q10 coefficient was calculated according to [19], the dashed lines represent linear fitting of the data points by the least squares method in the temperature range 23°C—32°C (23°C—35°C in case of the substrain GT-B). Each point represents average of at least four independent experiments, error bars represent standard errors. B, C—Batch growth was performed at 32°C and the heat shock was introduced by increasing temperature for four hours after the cultures reached OD680 0.7 (the temperature record is marked by dashed line). The batch experiments were performed at least in three biological replicates with quantitatively similar results, data from one representative experiment are shown.
Fig 6
Fig 6
Batch growth of Synechocystis sp. PCC 6803 substrains GT-L (white circles), GT-B (red triangles) and PCC-B (blue squares) in BG11 medium (A) and BG11 medium supplemented with 0.5 M NaCl at the beginning of the batch cultivation (B). The plotted values represent averages of at least three independent experiments, the error bars represent standard errors.

References

    1. Sarsekeyeva F, Zayadan BK, Usserbaeva A, Bedbenov VS, Sinetova MA, Los DA. Cyanofuels: Biofuels from cyanobacteria. Reality and perspectives. Photosynth Res. Springer Netherlands; 2015;125: 329–340. doi: 10.1007/s11120-015-0103-3 - DOI - PubMed
    1. Wijffels RH, Kruse O, Hellingwerf KJ. Potential of industrial biotechnology with cyanobacteria and eukaryotic microalgae. Curr Opin Biotechnol. 2013;24: 405–13. doi: 10.1016/j.copbio.2013.04.004 - DOI - PubMed
    1. Kaneko T, Tanaka a, Sato S, Kotani H, Sazuka T, Miyajima N, et al. Sequence analysis of the genome of the unicellular cyanobacterium Synechocystis sp. strain PCC6803. I. Sequence features in the 1 Mb region from map positions 64% to 92% of the genome. DNA Res. 1995;2: 153–166, 191–198. doi: 10.1093/dnares/2.4.153 - DOI - PubMed
    1. Kaneko T, Sato S, Kotani H, Tanaka A, Asamizu E, Nakamura Y, et al. Sequence analysis of the genome of the unicellular cyanobacterium Synechocystis sp. strain PCC6803. II. Sequence determination of the entire genome and assignment of potential protein-coding regions. DNA Res. 1996;3: 109–136. doi: 10.1093/dnares/3.3.109 - DOI - PubMed
    1. Grigorieva G, Shestakov S. Transformation in the cyanobacterium Synechocystis sp. 6803. FEMS Microbiol Lett. 1982;13: 367–370. Available: http://onlinelibrary.wiley.com/doi/10.1111/j.1574-6968.1982.tb08289.x/full - DOI