. 2018 Jan 25;46(2):558-567.
doi: 10.1093/nar/gkx1220.

Energetic funnel facilitates facilitated diffusion

Affiliations

Energetic funnel facilitates facilitated diffusion

Massimo Cencini et al. Nucleic Acids Res. .

Abstract

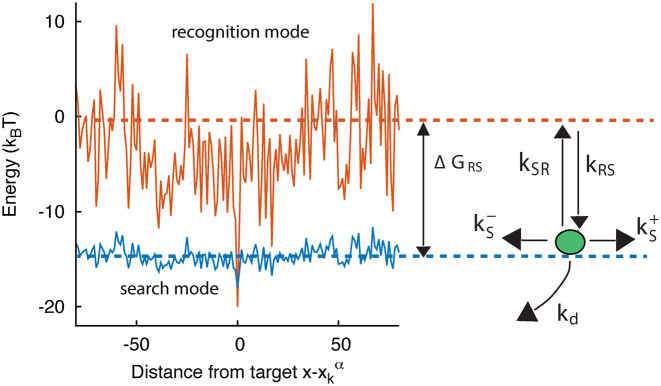
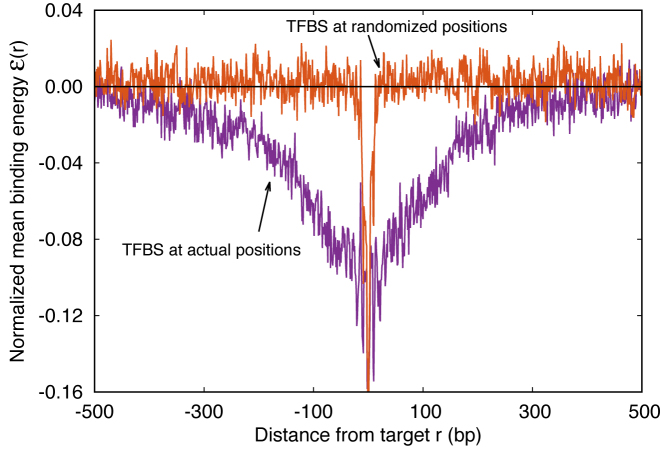
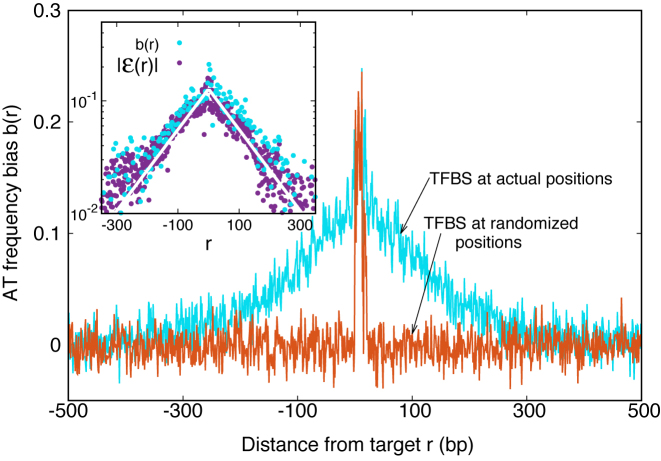
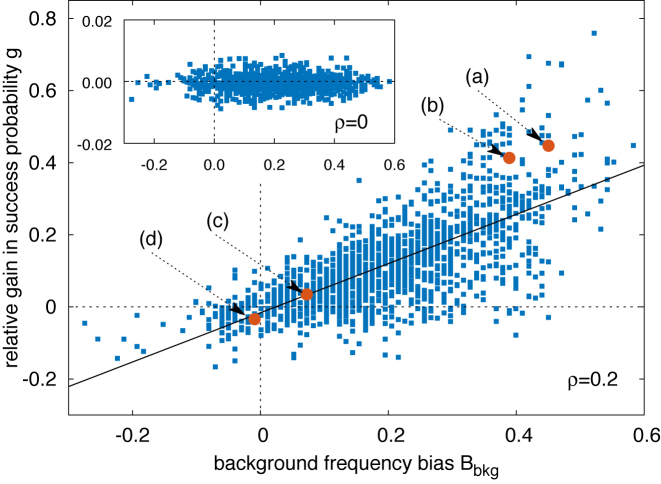
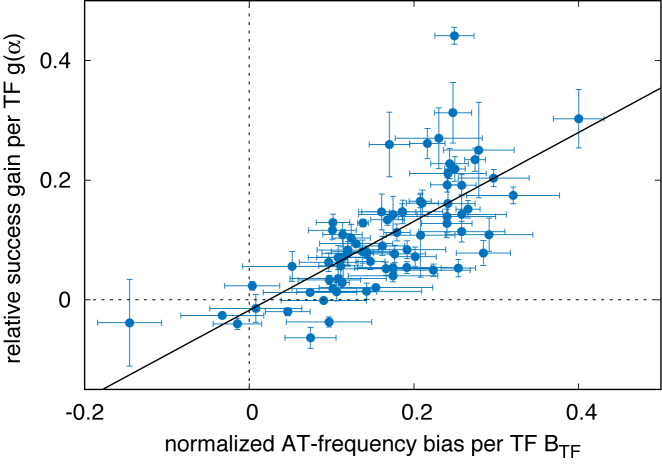
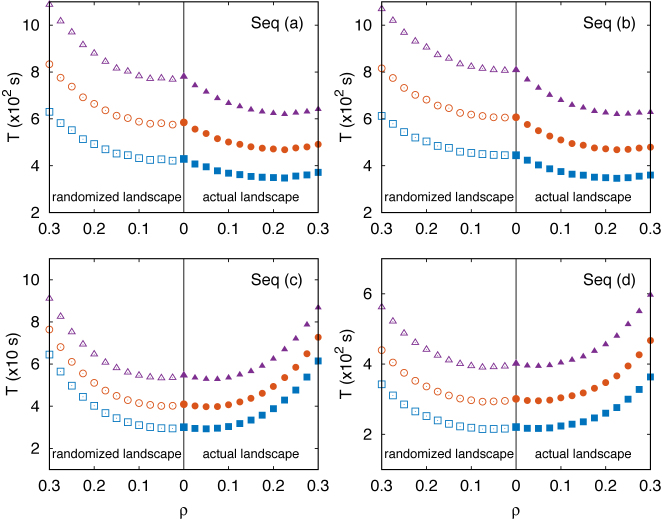
Transcription factors (TFs) are able to associate to their binding sites on DNA faster than the physical limit posed by diffusion. Such high association rates can be achieved by alternating between three-dimensional diffusion and one-dimensional sliding along the DNA chain, a mechanism-dubbed facilitated diffusion. By studying a collection of TF binding sites of Escherichia coli from the RegulonDB database and of Bacillus subtilis from DBTBS, we reveal a funnel in the binding energy landscape around the target sequences. We show that such a funnel is linked to the presence of gradients of AT in the base composition of the DNA region around the binding sites. An extensive computational study of the stochastic sliding process along the energetic landscapes obtained from the database shows that the funnel can significantly enhance the probability of TFs to find their target sequences when sliding in their proximity. We demonstrate that this enhancement leads to a speed-up of the association process.


Figures

Figure 1.
Figure 1.
Graphical representation of the two-state model. The two continuous curves represent the energy levels of the two modes of a TF, equal to Eα(x) (recognition mode, top curve) and formula image (search mode, bottom curve). The dashed lines denote the average energy in the two modes. The arrows represent the transitions in the stochastic model, characterized by the rates in Equation (3).
Figure 2.
Figure 2.
Average normalized binding energy formula image (4) as a function of the distance r from the target. The curve labeled TFBS at actual position displays formula image computed over the whole set of 1544 unique target sequences in the DB (see ‘Materials and Methods’ section). The other curve represents the formula image computed with TFBS at randomized positions (as labeled) on the DNA. The randomized coordinates are drawn with uniform probability on the DNA, with the only constraint of being at least 1000 bp away from any other target sequence in the DB.
Figure 3.
Figure 3.
AT frequency bias b(r) (5) as a function of distance r from the target. The curve labeled TFBS at actual position displays b(r) computed over the whole set of 1544 unique target sequences in the DB (see ‘Materials and Methods’ section). The other curve represents the same quantity computed with TFBS at randomized positions (as labeled) on the DNA. The randomized computation is performed as in Figure 2. Inset: comparison between formula image and b(r), as in the legend, in linear-log scale. The white thick lines are an exponential fit aexp ( − |r|/ℓf), yielding ℓf ≈ 120 bp and a ≈ 0.128.
Figure 4.
Figure 4.
Scatter plot of the relative success-probability gain g(α, k) [Equation (7)] to find the target versus the background frequency bias Bbkg(α, k) [Equation (6)]. The success probabilities for each TFBS and its randomized counterparts have been estimated by averaging over 106 realizations of the stochastic model, with the TF initialized as described in ‘Materials and Methods’ section. ρ = 0.2 and the other parameters are fixed as in ‘Materials and Methods’ section. The black solid line is the result of a linear regression giving g = 0.68 Bbkg − 0.016 with Pearson correlation coefficient r = 0.72. Filled circles labeled as (a–d) correspond to the specific sequences analyzed in Figure 6: (a) TATTGCTCCACTGTTTA for PhoP; (b) GTAAAAATATATAAA for CpxR; (c) AAGCAAAGCGCAG for Ada; (d) TGCGTGAAAAACTGTC for PhoB. Inset: same scatter plot as in the main figure but with ρ = 0, i.e. without specificity in the S state. In this case, no gain in success probability is observed (notice the scale on the y axis).
Figure 5.
Figure 5.
Classification of TFs according to their AT frequency bias and target finding success. Relative gain in probability of success per TF (averaged over their target sequences), g(α), as a function of the AT relative frequency bias per TF, BTF(α), see Equation (8). The error bars represent the standard error over the sample of Mα TFBS of TF α. The line is the linear regression g = 0.74BTF − 0.018 with Pearson correlation coefficient r ≈ 0.71.
Figure 6.
Figure 6.
Total search time T, computed as in Equation (10), versus ρ for four target sequences of four different TFs as labeled in Figure 4. In each panel, the three curves correspond to different assumptions for the average duration of a 3D diffusion round t3D = νt1D(ρ = 0): (boxes) ν = 0.1, (circles) ν = 0.5 (triangles) ν = 1. Filled symbols (on the right of the vertical solid line) refer to computation of the success probability Ps(α, k) performed with the target sequences at their actual positions. Empty symbols on the left correspond to the computation performed by randomizing the positions of the TFBSs. Each symbol is obtained by an average over 106 realizations. The average sliding time t1D is estimated by simulating 106 sliding events at random locations far from the target sequence.

References

    1. Alberts B., Johnson A., Lewis J., Raff M., Roberts K., Walter P.. Molecular Biology of the Cell, Garland Science. 2007; 5th edn, NY: Taylor & Francis Group.
    1. Berg O., Winter R., von Hippel P.H.. Diffusion-driven mechanisms of protein translocation on nucleic acids. 1. Models and theory. Biochem. 1981; 20:6929–6948. - PubMed
    1. Berg O.G., Winter R.B., von Hippel P.H.. How do genome-regulatory proteins locate their DNA target sites?. Trends Biochem. Sci. 1982; 7:52–55.
    1. von Hippel P.H., Berg O.. Facilitated target location in biological systems. J. Biol. Chem. 1989; 264:675–678. - PubMed
    1. Adam G., Delbrück M.. Rich A, Davidson N. Reduction of dimensionality in biological diffusion processes. Structural Chemistry and Molecular Biology. 1968; 198:San Francisco: Freeman; 198–215.

Publication types