. 2018 Apr 1;162(2):509-534.
doi: 10.1093/toxsci/kfx274.

High-Throughput H295R Steroidogenesis Assay: Utility as an Alternative and a Statistical Approach to Characterize Effects on Steroidogenesis

Affiliations

High-Throughput H295R Steroidogenesis Assay: Utility as an Alternative and a Statistical Approach to Characterize Effects on Steroidogenesis

Derik E Haggard et al. Toxicol Sci. .

Erratum in

Abstract

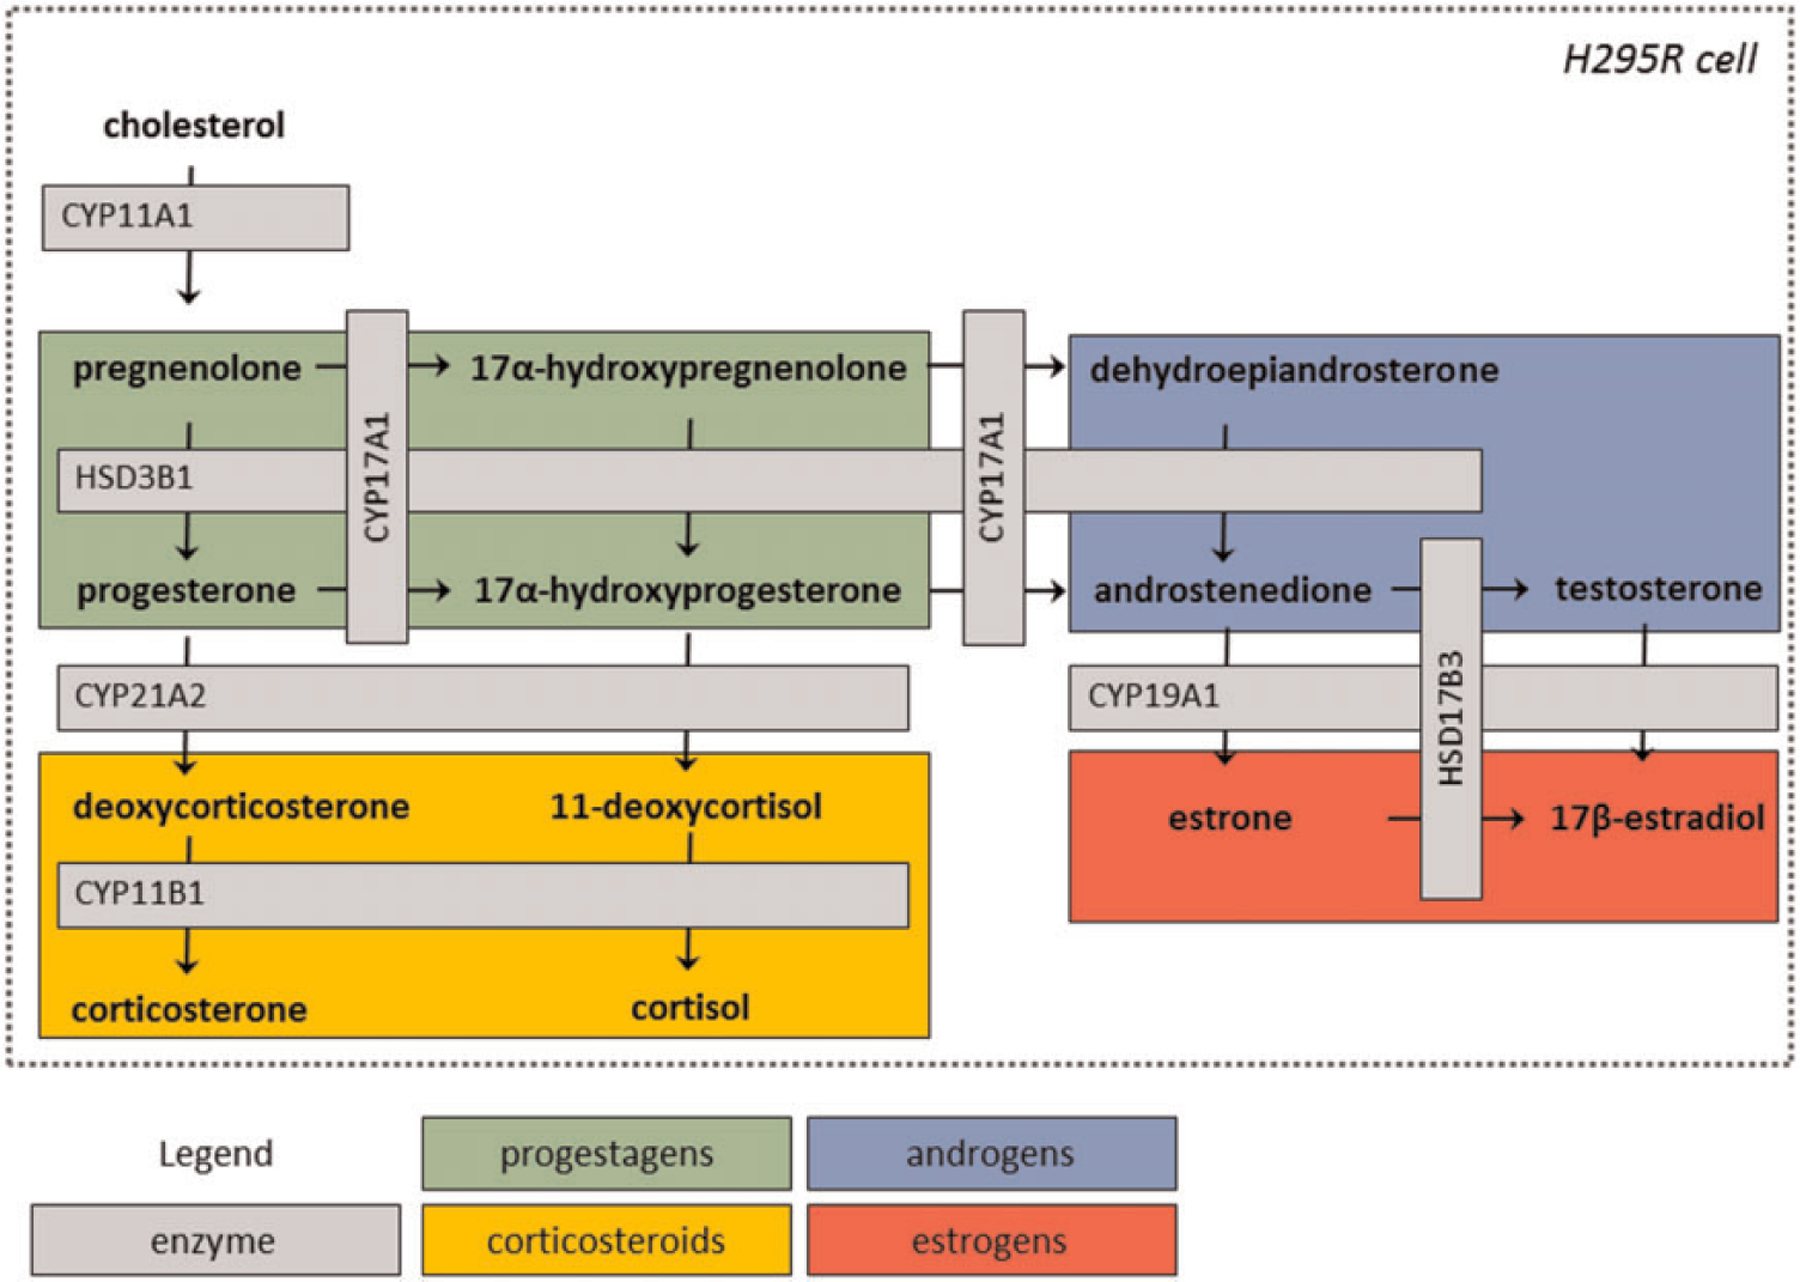
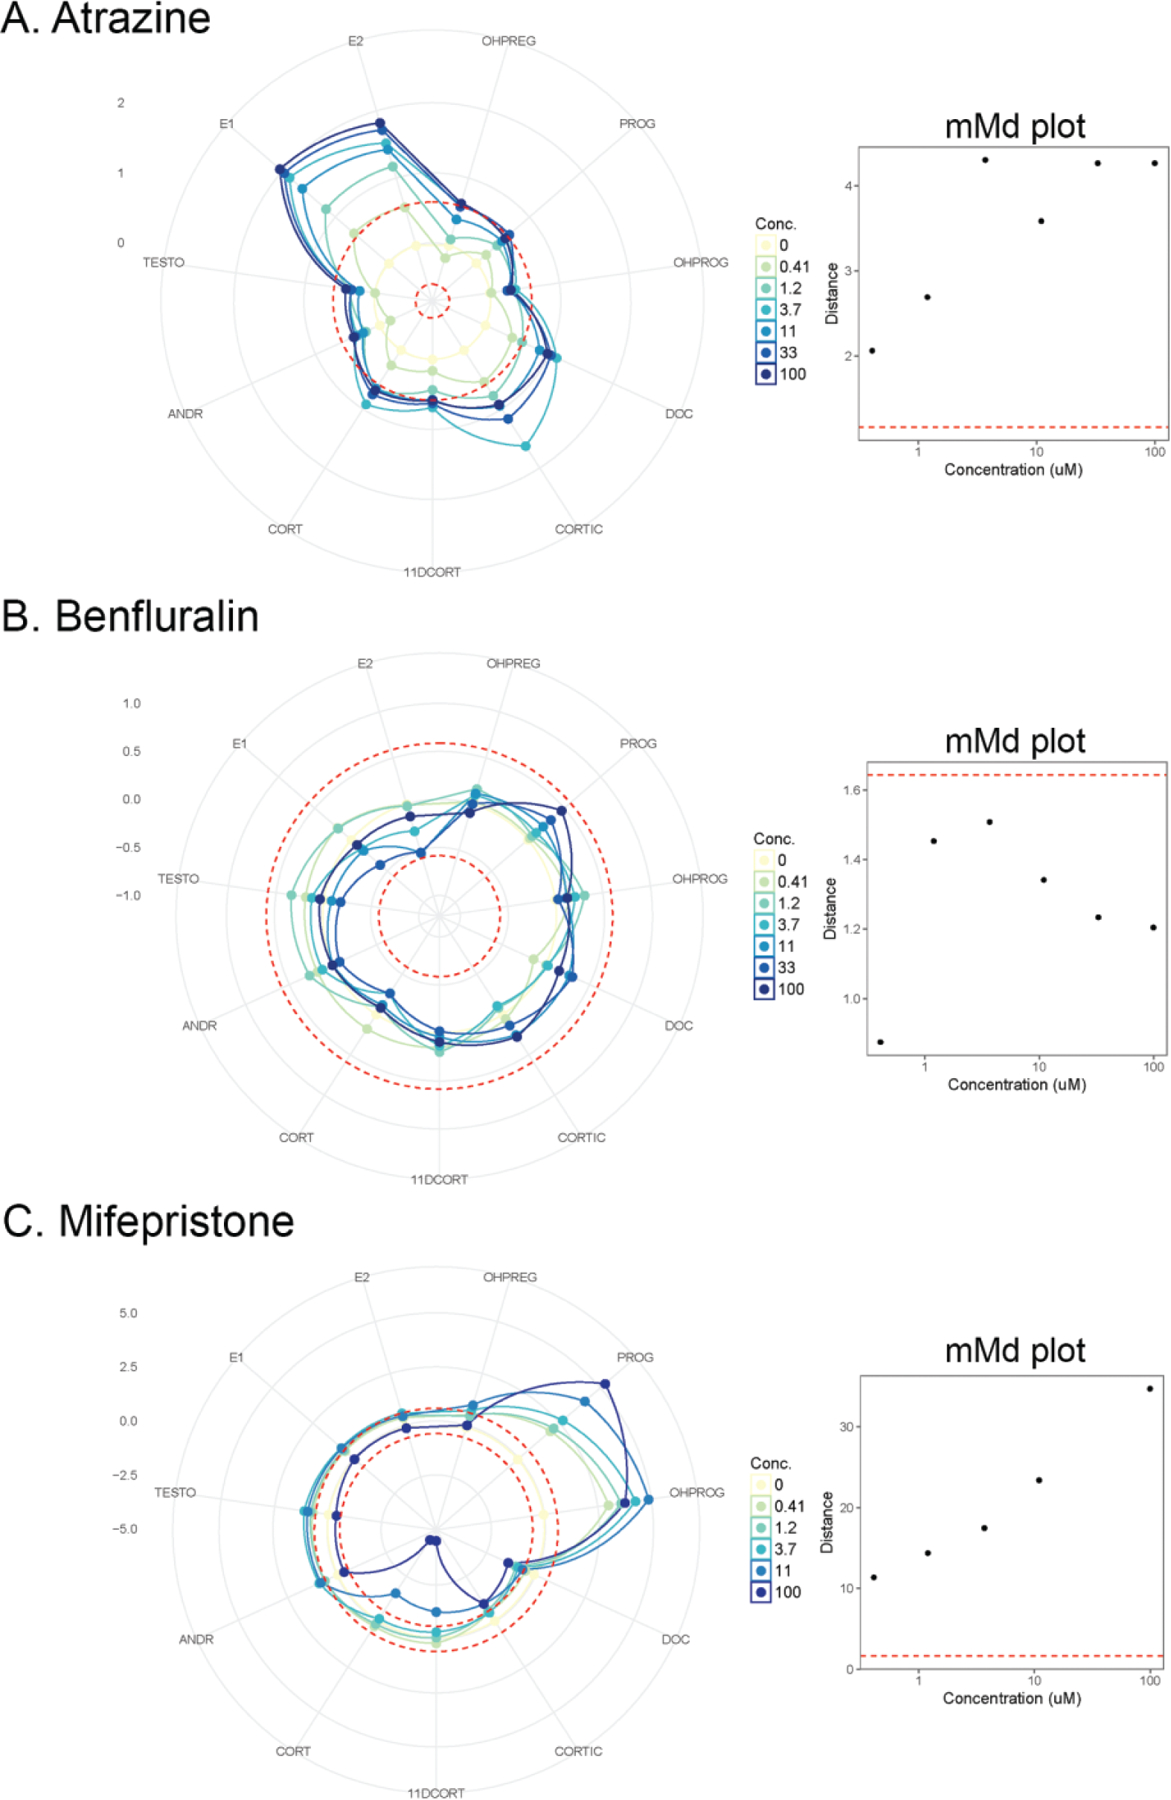
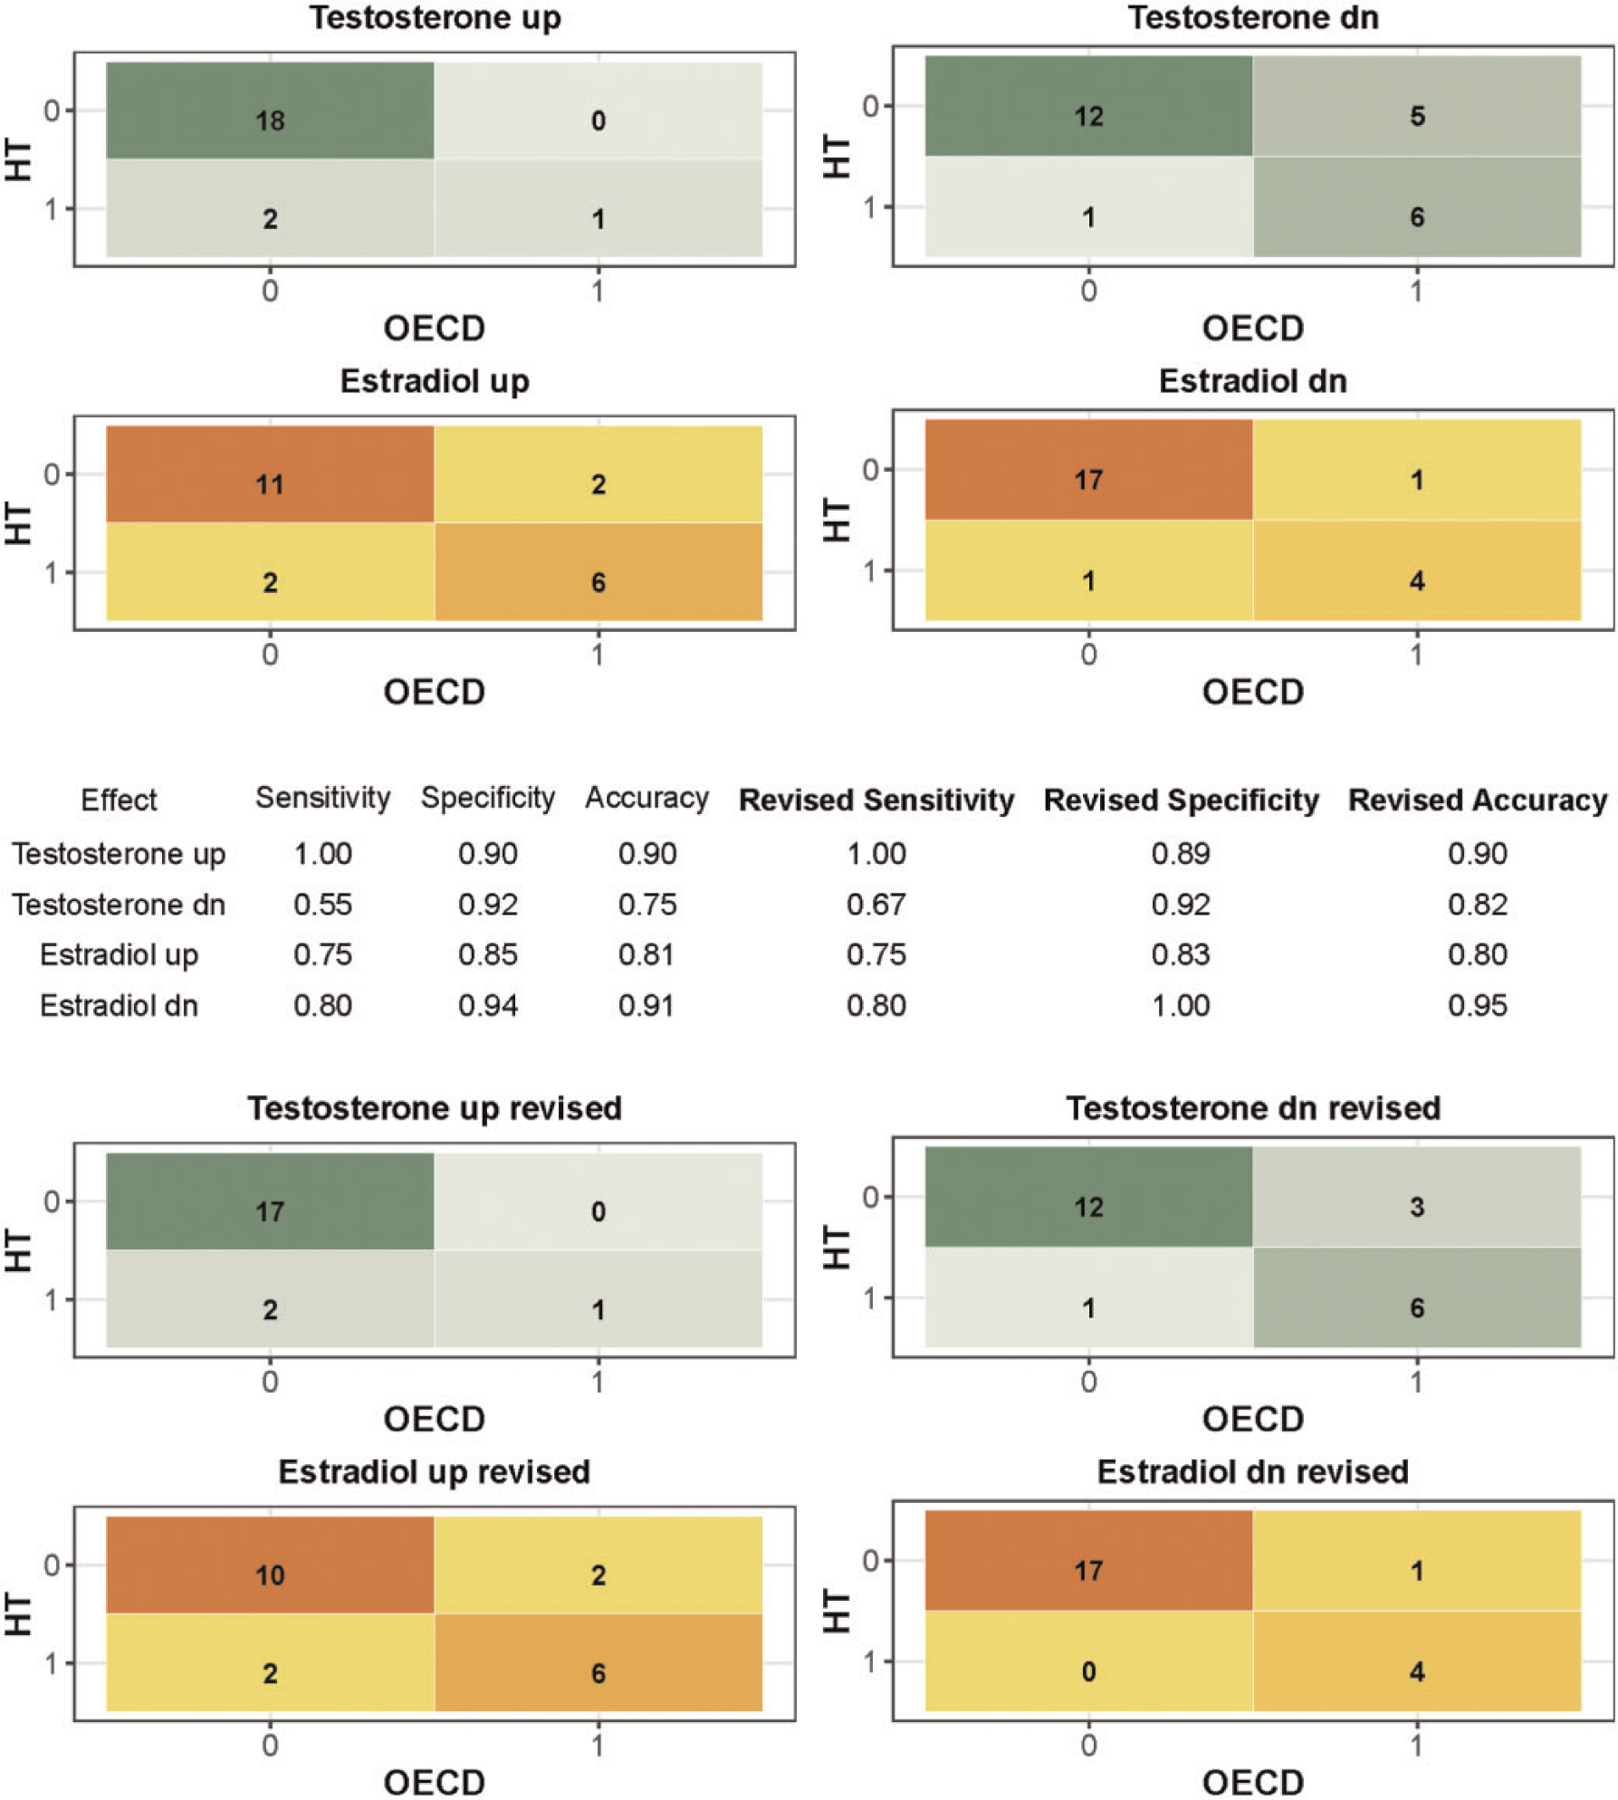
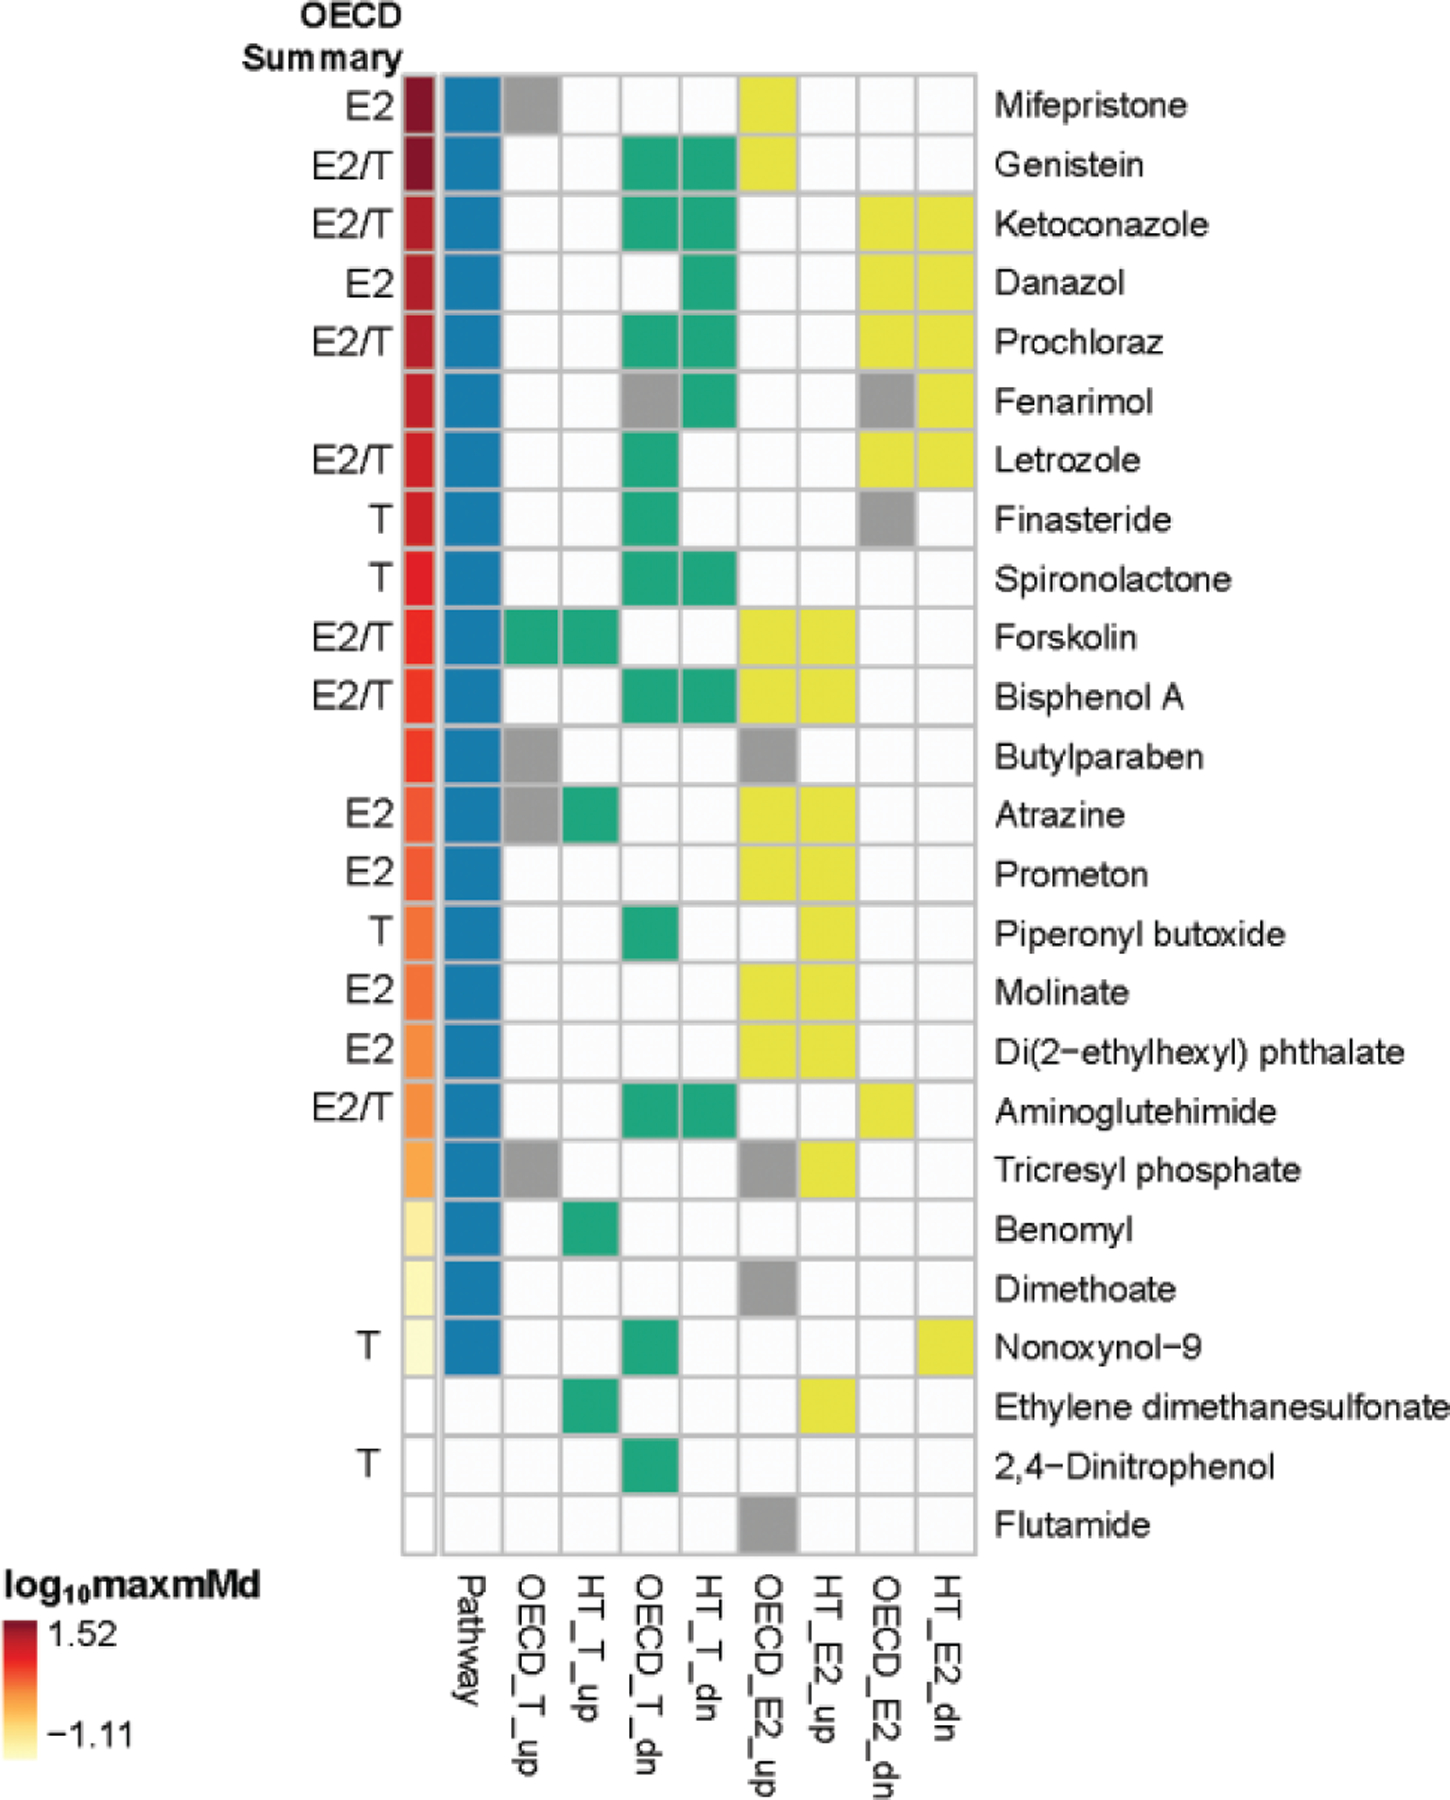
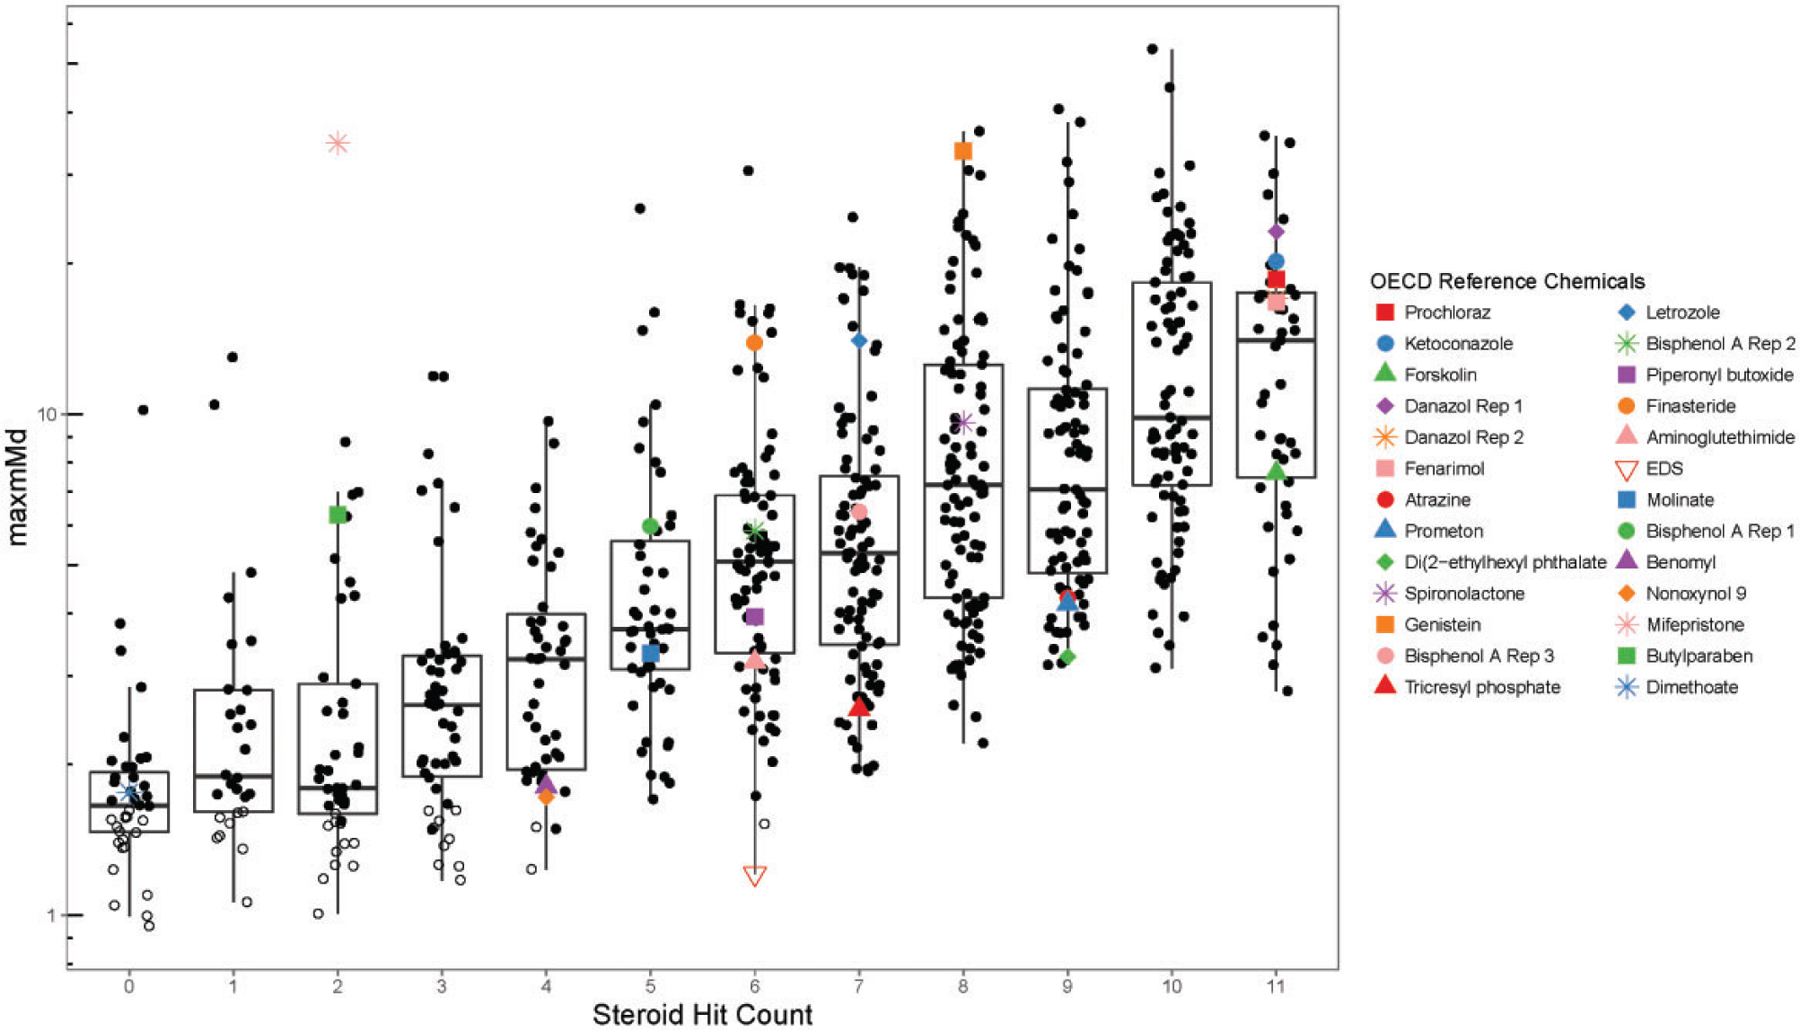
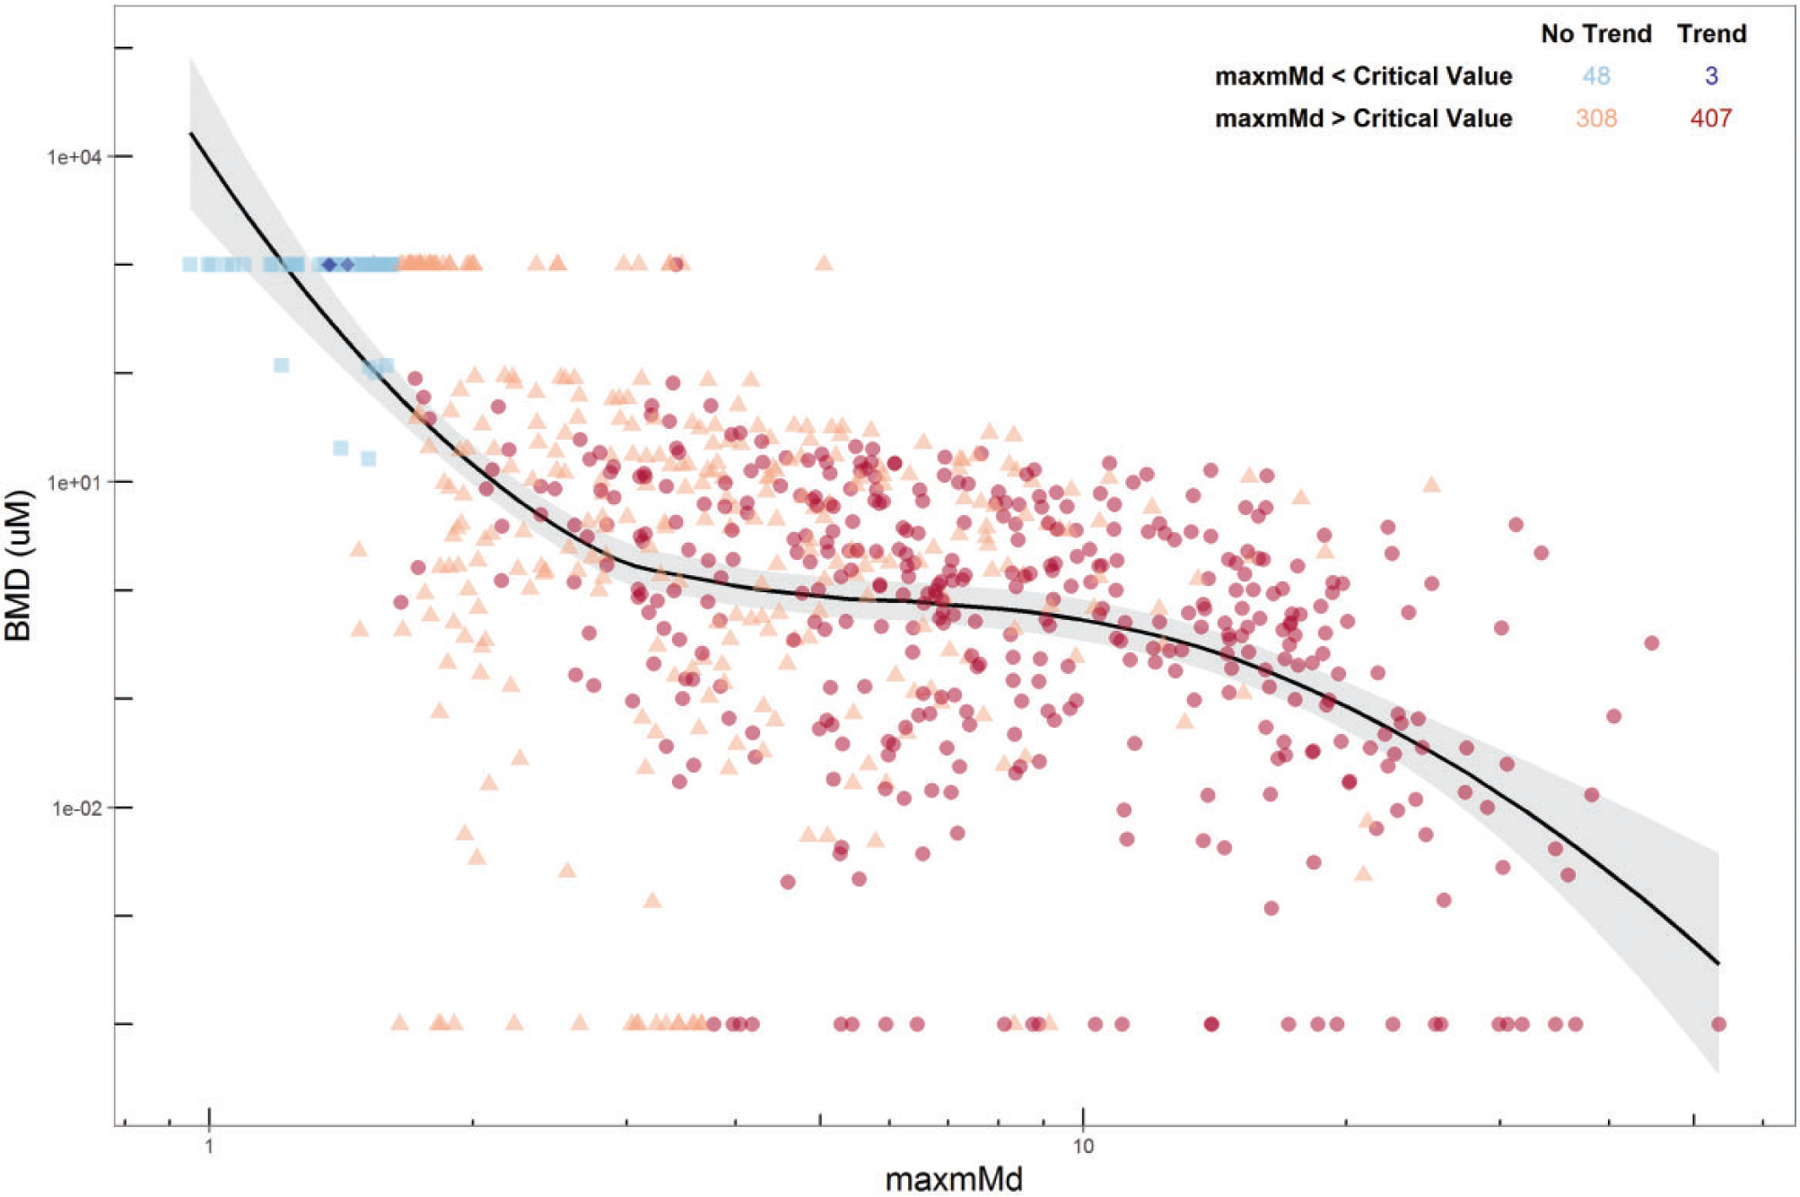
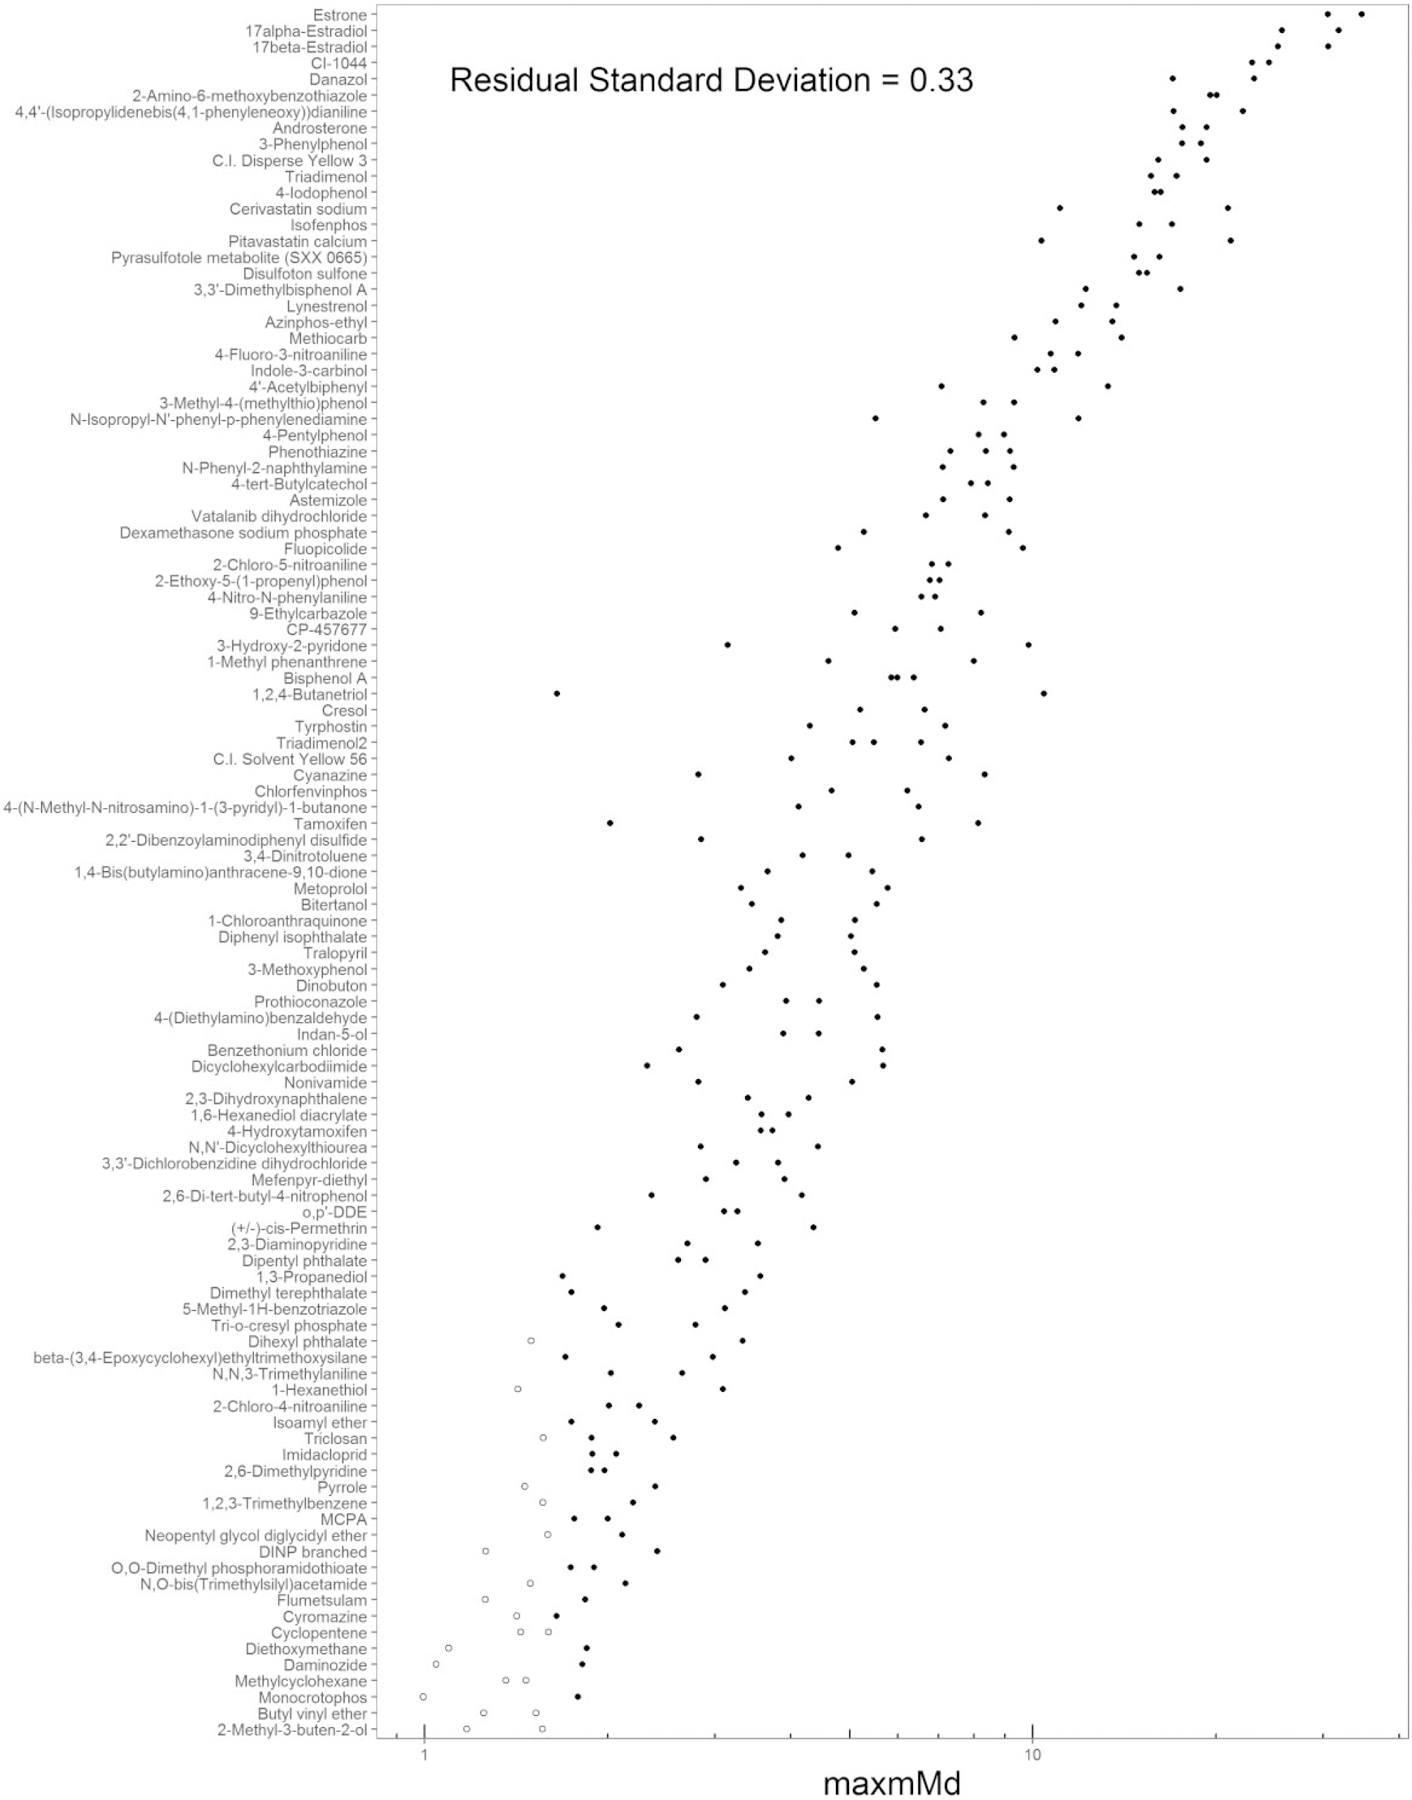
The U.S. Environmental Protection Agency Endocrine Disruptor Screening Program and the Organization for Economic Co-operation and Development (OECD) have used the human adrenocarcinoma (H295R) cell-based assay to predict chemical perturbation of androgen and estrogen production. Recently, a high-throughput H295R (HT-H295R) assay was developed as part of the ToxCast program that includes measurement of 11 hormones, including progestagens, corticosteroids, androgens, and estrogens. To date, 2012 chemicals have been screened at 1 concentration; of these, 656 chemicals have been screened in concentration-response. The objectives of this work were to: (1) develop an integrated analysis of chemical-mediated effects on steroidogenesis in the HT-H295R assay and (2) evaluate whether the HT-H295R assay predicts estrogen and androgen production specifically via comparison with the OECD-validated H295R assay. To support application of HT-H295R assay data to weight-of-evidence and prioritization tasks, a single numeric value based on Mahalanobis distances was computed for 654 chemicals to indicate the magnitude of effects on the synthesis of 11 hormones. The maximum mean Mahalanobis distance (maxmMd) values were high for strong modulators (prochloraz, mifepristone) and lower for moderate modulators (atrazine, molinate). Twenty-five of 28 reference chemicals used for OECD validation were screened in the HT-H295R assay, and produced qualitatively similar results, with accuracies of 0.90/0.75 and 0.81/0.91 for increased/decreased testosterone and estradiol production, respectively. The HT-H295R assay provides robust information regarding estrogen and androgen production, as well as additional hormones. The maxmMd from this integrated analysis may provide a data-driven approach to prioritizing lists of chemicals for putative effects on steroidogenesis.


Figures

Figure 1.
Figure 1.
Representation of the steroid biosynthesis pathway expressed in H295R cells.
Figure 2.
Figure 2.
Example visualization of the ANOVA results for prochloraz. Replicates and the mean response values are denoted as filled circles and plus signs, respectively. Open circles indicate data points that were significantly different from control (p < .05). Dashed horizontal lines indicate 61.5-fold versus DMSO control to give additional context for low magnitude, but positive, responses. Data are plotted as concentration (μM) of prochloraz versus the measured steroid hormone analyte concentration (μM).
Figure 3.
Figure 3.
Venn diagram of ANOVA results for effects on steroid hormone synthesis, grouped by steroid class. The number of chemicals with positive results for progestagens (OH-pregnenolone, progesterone, OH-progesterone), corticosteroids (DOC, Corticosterone, 11-deoxycortisol, Cortisol), androgens (androstenedione, T), and estrogens (estrone, E2) are shown. A total of 629 chemical samples are represented in the Venn diagram (25 chemicals tested in concentration-response with data available for analysis failed to produce positive ANOVA results for any hormone class).
Figure 4.
Figure 4.
Hierarchically clustered heatmap summarizing correlation of the covariance of steroid hormone analytes. The correlation coefficients for each steroid hormone pair are provided.
Figure 5.
Figure 5.
Example radar plots of the 11-dimensional dataset used to derive a mean Mahalanobis distance (mMd) for each concentration assayed. The 11 steroid hormone analytes are represented as the “spokes” of the radar plot, and each concentration of the chemical is annotated by a different color. The dotted, concentric circles denote ±1.5-fold control as threshold to contextualize the responses, as the y-axes vary by chemical to allow for visualization of the relative magnitude of effects. The numbers on the left of each radar plot denotes the fold change values of the major gridlines of the plots. Next to each radar plot is a plot of mMd by concentration, with the critical value for the mMd annotated using a horizontal dashed red line. A, atrazine (CASRN 1912-24-9); B, benfluralin (CASRN 1861-40-1); C, mifepristone (CASRN 84371-65-3). Radar plots and mMd plots are supplied for all chemicals in Supplemental File 10.
Figure 6.
Figure 6.
Confusion matrices for effects on T and E2. The OECD interlaboratory validation study results (Hecker et al., 2011) were interpreted as true outcomes, and the HT-H295R results analyzed by ANOVA with a post hoc Dunnett’s test were interpreted as predicted outcomes. Four effect types were considered: increased (up) and decreased (dn) testosterone (T) and estradiol (E2). The number of chemicals included for each effect type varied because chemicals with equivocal results for the effect type (4 for T up, 1 for T down, 4 for E2 up, 2 for E2 down) were removed. Revised confusion matrices present the comparison without nonoxynol-9 and omitting letrozole from testosterone dn.
Figure 7.
Figure 7.
Geometric tiling to compare the OECD validation and HT-H295R results. For each chemical in the core and supplemental OECD chemical reference sets, a binary comparison of the OECD interlaboratory validation result (OECD_) and the HT-H295R results (HT_) is presented. Positive E2 responses are blocked as yellow, positive T responses are blocked as green, equivocal responses in the OECD interlaboratory validation are blocked as gray, and negatives are blocked as white. Blue blocks denote positive pathway responses (defined as the maxmMd exceeding the critical value for a chemical), and the annotation bar ranks all of the chemicals in the set by their log10 maxmMd from high (red) to low (yellow), white blocks indicating negative pathway results. “OECD Summary” is a text annotation to indicate whether an effect (up or dn) was observed for E2 or T in the OECD interlaboratory validation.
Figure 8.
Figure 8.
Boxplot of adjusted maxmMd values versus sum of steroid hormone positive responses. The maxmMd values for all 654 chemicals were binned by steroid hit count (ranging from 0 to 11 steroid hormones, as analyzed by the ANOVA-based logic employed herein), with the y-axis is log10-scaled. OECD reference chemicals are annotated within the plot. Closed symbols for all chemicals, including OECD reference chemicals, indicate positive maxmMd values that exceeded the critical value; open symbols for all chemicals, including OECD reference chemicals, indicate negative maxmMd values.
Figure 9.
Figure 9.
Estimate of potency versus the maxmMd. An estimate of potency, or benchmark dose (BMD) is compared to the maxmMd value. The BMD (μM) is the concentration at which the Hill fit of the mMd data intersects with the critical value for a given chemical. A loess smooth regression line demonstrates a general relationship between BMD and maxmMd. A table summarizing the effects of a Spearman-based trend analysis versus negative and positive maxmMd values is provided in the upper right. Light blue squares = negative maxmMd response and no trend (48 chemical samples); dark blue diamonds = negative maxmMd response and trend (3 chemical samples); orange triangles = positive maxmMd value and no trend (308 chemical samples); red circles = positive maxmMd value and trend (407 chemical samples).
Figure 10.
Figure 10.
Reproducibility of the maxmMd values. A 107 chemical subset was screened in multiple experimental block replicates, enabling an evaluation of reproducibility. The residual standard deviation of the natural log-transformed maxmMd values was determined and annotated in the plot (0.33). Open symbols indicate negative maxmMd values (failed to exceed the critical value).

References

    1. Abdel-Khalik J, Bjorklund E, and Hansen M (2013). Development of a solid phase extraction method for the simultaneous determination of steroid hormones in H295R cell line using liquid chromatography-tandem mass spectrometry. J. Chromatog.r B Analyt. Technol. Biomed. Life Sci 935, 61–69. - PubMed
    1. Ankley GT, and Jensen KM (2014). A novel framework for interpretation of data from the fish short-term reproduction assay (FSTRA) for the detection of endocrine-disrupting chemicals. Environ. Toxicol. Chem 33, 2529–2540. - PubMed
    1. Asser L, Hescot S, Viengchareun S, Delemer B, Trabado S, and Lombes M (2014). Autocrine positive regulatory feedback of glucocorticoid secretion: Glucocorticoid receptor directly impacts H295R human adrenocortical cell function. Mol. Cell. Endocrinol 395, 1–9. - PubMed
    1. Blystone CR, Lambright CS, Howdeshell KL, Furr J, Sternberg RM, Butterworth BC, Durhan EJ, Makynen EA, Ankley GT, Wilson VS, et al. (2007). Sensitivity of fetal rat testicular steroidogenesis to maternal prochloraz exposure and the underlying mechanism of inhibition. Toxicol. Sci 97, 512–519. - PubMed
    1. Breen M, Villeneuve DL, Ankley GT, Bencic DC, Breen MS, Watanabe KH, Lloyd AL, and Conolly RB (2013). Developing predictive approaches to characterize adaptive responses of the reproductive endocrine axis to aromatase inhibition: II. Computational modeling. Toxicol. Sci 133, 234–247. - PubMed

Publication types

MeSH terms