. 2017 Dec 6;96(5):1013-1023.e4.
doi: 10.1016/j.neuron.2017.11.014.

Age-Dependent Effects of apoE Reduction Using Antisense Oligonucleotides in a Model of β-amyloidosis

Affiliations

Age-Dependent Effects of apoE Reduction Using Antisense Oligonucleotides in a Model of β-amyloidosis

Tien-Phat V Huynh et al. Neuron. .

Abstract

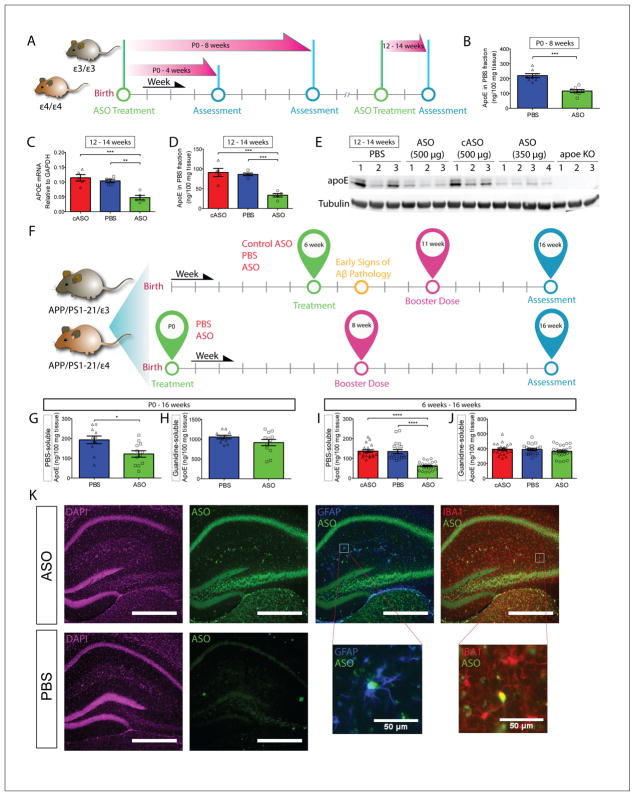
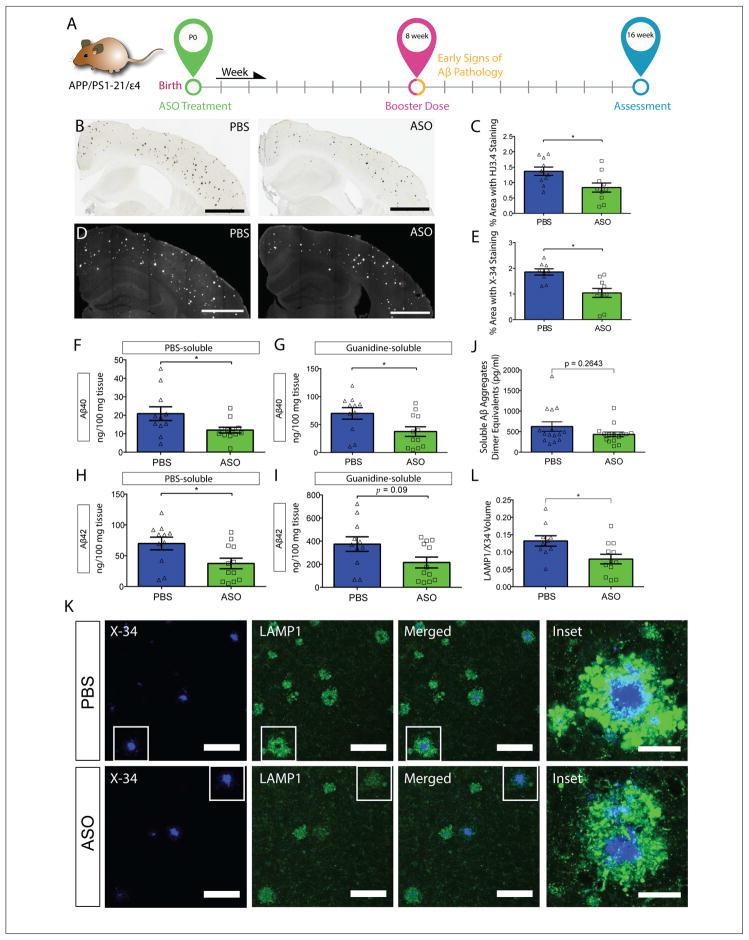
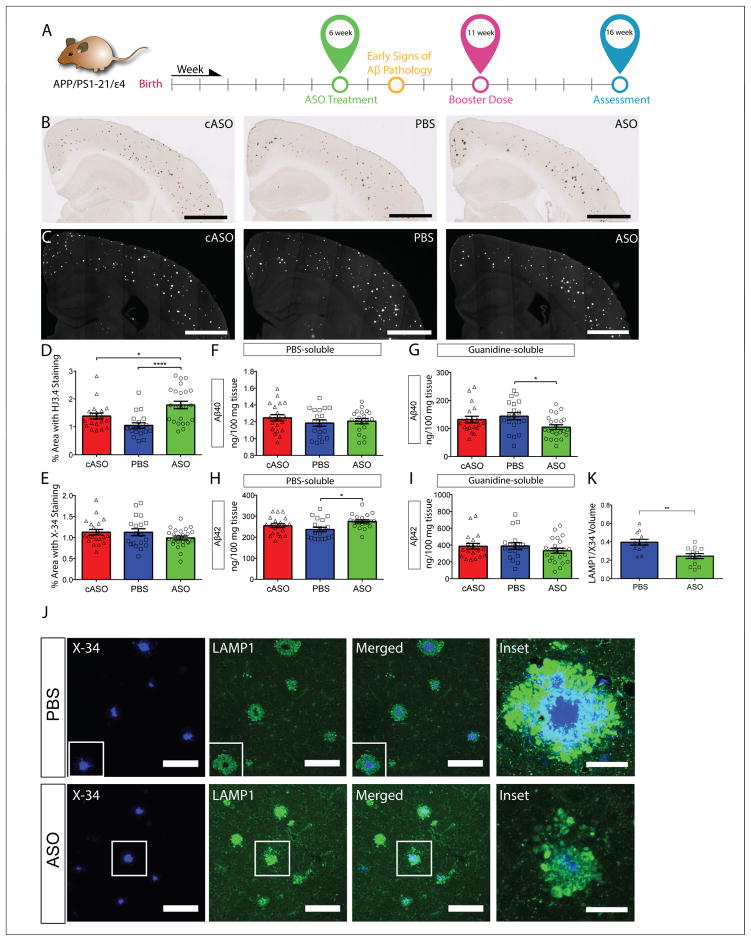
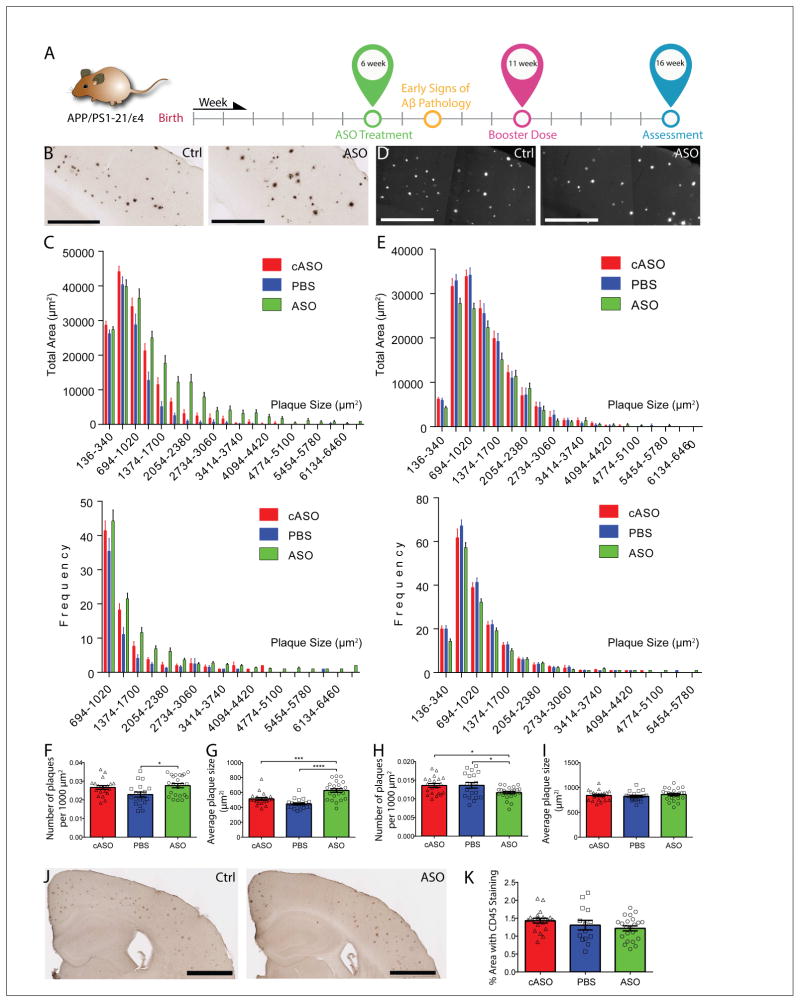
The apolipoprotein E (APOE) gene is the strongest genetic risk factor for late-onset Alzheimer disease. Previous studies suggest that reduction of apoE levels through genetic manipulation can reduce Aβ pathology. However, it is not clear how reduction of apoE levels after birth would affect amyloid deposition. We utilize an antisense oligonucleotide (ASO) to reduce apoE expression in the brains of APP/PS1-21 mice homozygous for the APOE-ε4 or APOE-ε3 allele. ASO treatment starting after birth led to a significant decrease in Aβ pathology when assessed at 4 months. Interestingly, ASO treatment starting at the onset of amyloid deposition led to an increase in Aβ plaque size and a reduction in plaque-associated neuritic dystrophy with no change in overall plaque load. These results suggest that lowering apoE levels prior to plaque deposition can strongly affect the initiation of Aβ pathology while lowering apoE after Aβ seeding modulates plaque size and toxicity.

Keywords: APOE; ASO; Alzheimer disease; Aβ; amyloid-β; antisense oligonucleotides; apolipoprotein E.


Figures

Figure 1
Figure 1. ASO Treatment reduces apoE mRNA and protein levels in APPE4 mice
A, Timeline of various experimental approaches to test for efficacy and optimal dosing of the ASO. B, E4KI mice were treated with a single bolus of ASO or PBS at P0, and the PBS-soluble apoE levels in the ipsilateral cortex were assessed at 8 weeks (n = 7 – 8 per group, p = 0.0003). C, 3 – 4 mo E4KI mice were treated with cASO, PBS or ASOs (n = 5 per group) and apoE mRNA level in the ipsilateral posterior cortex was analyzed 2 weeks later (p = 0.0002, F = 18.56). D, PBS-soluble apoE levels were measured in brain lysates from the same cohort (p < 0.0001, F = 22.38). E, Western blot for apoE from the same cohort using anti-apoE antibody HJ15.7. F, Experimental timelines for APPE4 and APPE3 cohorts. G, PBS-soluble apoE levels in the contralateral cortex of P0 APPE4 mice were assessed at 4 mo (n = 9 – 12 per group, p = 0.0129). H, Guanidine-soluble apoE levels in the contralateral cortex were assessed from the same cohort (p = 0.2844). I, ApoE protein levels in the contralateral cortex from 6wk APPE4 mice were measured via ELISA (n = 20 – 25 per group, p < 0.0001, F = 35.64). J, Guanidine-soluble ApoE protein levels were measured from the same set of brain homogenates (p = 0.4316, F = 0.8524). K, Immunofluorescent staining of ASO- and PBS-treated brains from APPE4 mice. ASOs (green) are taken up by both astrocytes (blue) and microglia (red), as indicated by co-localization with GFAP and Iba1, respectively. Scale bars = 500 μm, unless otherwise noted. *p < 0.05, **p < 0.01, ***p < 0.001, ****p < 0.0001. All values are reported as mean ± SEM. See also figure S1.
Figure 2
Figure 2. ASO treatment at P0 significantly reduces Aβ plaque pathology in APPE4 mice
A, Experimental timeline for P0 cohort. B, Brain sections from P0 APPE4 mice treated at P0 were immunostained with anti-Aβ antibody and the extent of Aβ deposition was quantified from the ipsilateral cortex (C) (Scale bar = 1mm). D, Brain sections from the same cohort were stained with X-34 dye and the fibrillar plaque load was quantified from the cortex (E) (Scale bar = 1 mm). PBS-soluble Aβ40 (F) and Aβ42 levels (H) were measured from the contralateral posterior cortex (p = 0.0373 and 0.0129, respectively). Guanidine-soluble Aβ40 (G) and Aβ42 levels (I) were measured from the same cohort (n = 9 – 10 per group, p = 0.0188 and 0.0903, respectively). J, Oligomeric Aβ levels were measured from PBS-soluble brain lysates (n = 15 per group, p = 0.2643). K, Representative images of brain sections from P0-treated APPE4 mice co-stained with X-34 and LAMP1. Scale bars = 100 μm. Inset: 60X magnification view of two plaques of similar sizes (one from each treatment group). Scale bars = 25 μm. L, The volume of LAMP1 staining within 15 μm of an X-34 positive plaque was quantified (n = 10 – 13 per group, p = 0.0196,). *p < 0.05. All values are reported as mean ± SEM. See also figure S2.
Figure 3
Figure 3. Reduction of apoE expression starting at 6 weeks of age did not significantly alter total Aβ levels in APPE4 mice
A, Experimental timeline for 6wk cohort of APPE4 mice. B, Brain sections from 6wk APPE4 mice were immunostained with an anti-Aβ antibody and the extent of Aβ deposition was quantified from the ipsilateral cortex (D) (p = 0.0002, F = 10.21). C. Brain sections from the same cohort were stained with X-34 dye and the fibrillar plaque load was quantified from the ipsilateral cortex (E) (p = 0.2095, F = 1.604). Scale bars = 1 mm. PBS-soluble Aβ40 (F) and Aβ42 levels (H) were measured in the contralateral posterior cortex from 4-mo APPE4 mice following 10-weeks treatment (started at 6 weeks of age) with ASO or controls (p = 0.4673, F = 0.7711 and p = 0.0171, F = 4.379, respectively). Guanidine-soluble Aβ40 (G) and Aβ42 levels (I) in the contralateral posterior cortex were measured from the same cohort (p = 0.0326, F = 3.635 and p = 0.2568, F = 1.391, respectively). N = 20 – 25 per group. J, Representative images of brain sections from P0-treated APPE4 mice co-stained with X-34 and LAMP1. Scale bars = 100 μm. Inset: 60X magnification view of two plaques of similar sizes (one from each treatment group). K, The volume of LAMP1 staining within 15 μm of X-34 positive plaques was quantified and normalized to the corresponding X-34 volume (n = 13 per group, p = 0.0019,). *p < 0.05, ****p < 0.0001. Scale bars = 100 μm. All values are reported as mean ± SEM. See also figure S3.
Figure 4
Figure 4. ASO treatment alters plaque size distribution in APPE4 mice
A, Experimental timeline for 6wk cohort. B, Brain sections from APPE4 mice treated with either ASO or cASO stained with anti-Aβ antibody HJ3.4 are shown (Scale bars = 500 μm). Due to space constraints, only the representative images of cASO and ASO were shown. C, Analysis of the plaque distribution was done by stratifying total plaque coverage based on size, and either the total area covered by plaques of each group (top panel) or the frequency of occurrence (bottom panel) was plotted on the Y-axis. Only plaques larger than 694 μm2 are shown in bottom panel for clarity. A two-sample K-S test found significant differences in cumulative distribution between cASO and ASO groups (p = 1.39888E-14), as well as between PBS and ASO groups (p = 3.08816E-07). D, Brain sections from the same cohort stained with X-34 were shown (Scale bars = 500 μm). E, Analysis of the plaque size distribution based on X-34 staining was done using a similar approach as in (C), and the total area covered by plaques of each group (top panel) or the frequency of occurrence (bottom panel) was plotted on the Y-axis. No significant differences in the cumulative distribution of plaques were detected between the groups by the K-S test. The density of Aβ antibody-stained plaques (F) and average plaque size (G) was analyzed in the same cohort (n = 20 – 25 per group, p = 0.0144, F = 4.563 and p < 0.0001, F = 19.80, respectively). The density of X-34-stained plaques (H) and average plaque size (I) was analyzed in the same cohort (p = 0.0173, F = 4.351 and p = 0.5839, F = 0.5429, respectively). J, Brain sections from 4-mo APPE4 mice were immunostained with an antibody against activated microglia, CD45 (Scale bars = 1 mm). K, The CD45+ area was quantified from the cortex of APPE4 mice (n = 20 – 25 per group, p = 0.1764, F = 1.793). All values are reported as mean ± SEM. See also figures S4.

Comment in

References

    1. Bennett CF, Swayze EE. RNA targeting therapeutics: molecular mechanisms of antisense oligonucleotides as a therapeutic platform. Annual review of pharmacology and toxicology. 2010;50:259–293. - PubMed
    1. Bero AW, Bauer AQ, Stewart FR, White BR, Cirrito JR, Raichle ME, Culver JP, Holtzman DM. Bidirectional relationship between functional connectivity and amyloid-beta deposition in mouse brain. The Journal of neuroscience: the official journal of the Society for Neuroscience. 2012;32:4334–4340. - PMC - PubMed
    1. Bero AW, Yan P, Roh JH, Cirrito JR, Stewart FR, Raichle ME, Lee JM, Holtzman DM. Neuronal activity regulates the regional vulnerability to amyloid-beta deposition. Nature neuroscience. 2011;14:750–756. - PMC - PubMed
    1. Bertram L, McQueen MB, Mullin K, Blacker D, Tanzi RE. Systematic meta-analyses of Alzheimer disease genetic association studies: the AlzGene database. Nature genetics. 2007;39:17–23. - PubMed
    1. Bien-Ly N, Gillespie AK, Walker D, Yoon SY, Huang Y. Reducing human apolipoprotein E levels attenuates age-dependent Abeta accumulation in mutant human amyloid precursor protein transgenic mice. The Journal of neuroscience: the official journal of the Society for Neuroscience. 2012;32:4803–4811. - PMC - PubMed

MeSH terms