. 2018 Mar;93(3):589-598.
doi: 10.1016/j.kint.2017.09.015. Epub 2017 Dec 6.

Haploinsufficiency for the Six2 gene increases nephron progenitor proliferation promoting branching and nephron number

Affiliations

Haploinsufficiency for the Six2 gene increases nephron progenitor proliferation promoting branching and nephron number

Alexander N Combes et al. Kidney Int. 2018 Mar.

Abstract

The regulation of final nephron number in the kidney is poorly understood. Cessation of nephron formation occurs when the self-renewing nephron progenitor population commits to differentiation. Transcription factors within this progenitor population, such as SIX2, are assumed to control expression of genes promoting self-renewal such that homozygous Six2 deletion results in premature commitment and an early halt to kidney development. In contrast, Six2 heterozygotes were assumed to be unaffected. Using quantitative morphometry, we found a paradoxical 18% increase in ureteric branching and final nephron number in Six2 heterozygotes, despite evidence for reduced levels of SIX2 protein and transcript. This was accompanied by a clear shift in nephron progenitor identity with a distinct subset of downregulated progenitor genes such as Cited1 and Meox1 while other genes were unaffected. The net result was an increase in nephron progenitor proliferation, as assessed by elevated EdU (5-ethynyl-2'-deoxyuridine) labeling, an increase in MYC protein, and transcriptional upregulation of MYC target genes. Heterozygosity for Six2 on an Fgf20-/- background resulted in premature differentiation of the progenitor population, confirming that progenitor regulation is compromised in Six2 heterozygotes. Overall, our studies reveal a unique dose response of nephron progenitors to the level of SIX2 protein in which the role of SIX2 in progenitor proliferation versus self-renewal is separable.

Keywords: genetics; imaging; kidney development; transcription regulation.


Figures

Figure 1)
Figure 1). Validation of haploinsufficiency and compromised progenitor state
A) Six2 mRNA is reduced by 50% in Six2GCE/+ compared to Six2+/+ at 15.5 dpc. Data is the average of three biological replicates from each genotype, p=0.0003. mRNA levels expressed relative to Six2+/+. B) Western blot bands for SIX2, GAPDH, and PAX2 at 15.5 dpc with four biological replicates per genotype. See Supplementary Figure 1 for full gels. C) Densitometry analysis showing reduced SIX2 relative to GAPDH (p=0.014), no change in PAX2 relative to GAPDH (p=0.256), reduced SIX2 relative to PAX2 (p=0.049). Data represents the average of 4 biological replicates. D&E) Pseudocoloured map of SIX2 intensity in representative Six2+/+ and Six2GCE/+ samples imaged and displayed on the same settings. Colour scale indicates fluorescence intensity units. Scale bar 100μm. F) Box and whisker plot of mean SIX2 intensity per cap cluster for Six2+/+ (n=104) vs Six2GCE/+ (n=55), two sample t-test with welch’s correction p=6.4e-10. G) Cited1 mRNA levels are dramatically reduced in the Six2GCE/+ compared to Six2+/+ (p=0.00005). Error bars on all graphs represent SEM, p values from two-tailed t-tests with Welch’s correction.
Figure 2)
Figure 2). Increased branching, tip proliferation, and nephron endowment in Six2GCE/+.
A) Whole organ OPT of SIX2-antibody stained Six2+/+ and Six2GCE/+ kidneys at 15.5 dpc, 19.5 dpc, and P2. Scale 300μm for all. Exposures were optimised for each sample hence signal intensity should not be compared between images. B) Niche counts from OPT data for 15.5 dpc (n = 9 Six2+/+, 8 Six2GCE/+), 19.5 dpc (n = 8 Six2+/+, 8 Six2GCE/+), and P2 (n = 8 Six2+/+, 9 Six2GCE/+). C) Max. intensity projection confocal data from 15.5 dpc and 19.5 dpc Six2+/+ and Six2GCE/+ kidneys stained with SIX2 (red) and CYTOK (white). Scale bars 30μm. Exposures were optimised for each sample hence signal intensity should not be compared between images. D) Tip and cap cell number at 15.5 dpc. Each data point represents average cell number per niche in an individual sample; Sample numbers = 9 Six2+/+, 8 Six2GCE/+. E) Tip and cap cell number at 19.5 dpc. Points as per D, n= 9 Six2+/+, 8 Six2GCE/+. F) % EdU incorporation for tip and cap cell populations at 13.5 dpc, 30 minutes after exposure to EdU. Each data point represents % incorporation per sample, data derives from three replicate experiments; n = 8 Six2+/+, 9 Six2GCE/+. G) Comparison of estimated glomerular number between P21 (adult) Six2+/+ and Six2GCE/+ by stereology; n= 10 Six2+/+, 12 Six2GCE/+. Error bars in all graphs represent SEM, p values determined by 1-tailed t-test with Welch’s correction.
Figure 3)
Figure 3). Gene expression changes in the Six2GCE/+ kidney.
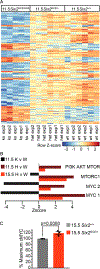
A) Genes differentially expressed (DE) at ≤−0.4 or ≥0.4 LogFC of Six2+/+ values at 15.5dpc in Six2GCE/+ and ≤−1 or ≥1 LogFC of wildtype in 11.5 dpc Six2GCE/GCE; adjusted p<0.05 for all. Key indicates fold change in expression compared to wildtype for all panels. For all panels, W= wildtype/Six2+/+; H= heterozygous/Six2GCE+; K= knockout/Six2GCE/GCE. B) Genes expressed at ≤−0.4 or ≥0.4 LogFC of wildtype values at 11.5dpc in Six2GCE/+ and ≤−1 or ≥1 LogFC of wildtype in Six2GCE/GCE adjusted p<0.05. C) Examples of gene expression for some established SIX2 targets and branching genes in Six2GCE/+ and Six2GCE/GCE; Aside from Six2, none of these changes were statistically significant in the Six2GCE/+.
Figure 4)
Figure 4). Analysis of transcriptional changes
A) Unsupervised clustering of the top 250 differentially expressed genes between 11.5 dpc Six2GCE/GCE and Six2+/+. Each row represents a gene, each column an independent sample. Colour indicates normalised expression (Z-score) blue is low, red high. B) Gene set testing reveals an upregulation of pathways associated with growth (MYC targets V1 and V2), progenitor maintenance (mTOR, mTORC1 signalling), and differentiation (PI3K signalling) in Six2GCE/+. The pathways associated with MYC and mTORC1 are downregulated in Six2GCE/GCE. D) MYC protein levels are significantly increased in the Six2GCE/+. Points represent average values from three independent litters. Unpaired t test.
Figure 5)
Figure 5). Cap mesenchyme lacking one copy of Six2 undergoes premature differentiation in the absence of Fgf20.
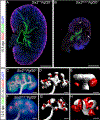
A) Staining of the CM (SIX2, red), ureteric tree (ECAD, green), and nuclei (DAPI, blue) in a 15.5 dpc Six2+/+Fgf20−/− kidney. Scale 200μm. B) Nephron progenitors exhaust before 15.5 dpc in Six2GCE/+Fgf20−/− kidneys. Dilated nephrons are observed (arrows) and the ureteric tree is underdeveloped. Staining and scale as per A. C) Maximum intensity projection of the CM (SIX2, green), tree (ECAD, grey), renal vesicles (JAG1, red), and nuclei (DAPI, blue) in a 12.5 dpc Six2+/+Fgf20+/− kidney, scale 50μm. D) Rendering of the tree (grey) and renal vesicles (red) from C, scale 50μm. E) Zoom of boxed region in E shows t-stage tip with two renal vesicles attached on medullary side, scale 20μm. F) 12.5 dpc Six2GCE/+Fgf20−/− kidney as per C, scale 50μm. G) Rendering from F, scale 50μm. H) Zoom of region in G showing t-stage tip with 5 renal vesicles, 2 in ectopic positions, scale 20μm.

References

    1. Hoy WE, Hughson MD, Bertram JF, et al. Nephron number, hypertension, renal disease, and renal failure. Journal of the American Society of Nephrology : JASN 2005; 16: 2557–2564. - PubMed
    1. Kopan R, Chen S, Little M. Nephron progenitor cells: shifting the balance of self-renewal and differentiation. Current topics in developmental biology 2014; 107: 293–331. - PubMed
    1. Barak H, Huh SH, Chen S, et al. FGF9 and FGF20 maintain the stemness of nephron progenitors in mice and man. Developmental cell 2012; 22: 1191–1207. - PMC - PubMed
    1. Cebrian C, Asai N, D’Agati V, et al. The number of fetal nephron progenitor cells limits ureteric branching and adult nephron endowment. Cell reports 2014; 7: 127–137. - PMC - PubMed
    1. Brown AC, Muthukrishnan SD, Oxburgh L. A synthetic niche for nephron progenitor cells. Developmental cell 2015; 34: 229–241. - PMC - PubMed

Publication types

MeSH terms

LinkOut - more resources