. 2017 Dec 8;358(6368):1318-1323.
doi: 10.1126/science.aap8809.

Spatiotemporal gene expression trajectories reveal developmental hierarchies of the human cortex

Affiliations

Spatiotemporal gene expression trajectories reveal developmental hierarchies of the human cortex

Tomasz J Nowakowski et al. Science. .

Abstract

Systematic analyses of spatiotemporal gene expression trajectories during organogenesis have been challenging because diverse cell types at different stages of maturation and differentiation coexist in the emerging tissues. We identified discrete cell types as well as temporally and spatially restricted trajectories of radial glia maturation and neurogenesis in developing human telencephalon. These lineage-specific trajectories reveal the expression of neurogenic transcription factors in early radial glia and enriched activation of mammalian target of rapamycin signaling in outer radial glia. Across cortical areas, modest transcriptional differences among radial glia cascade into robust typological distinctions among maturing neurons. Together, our results support a mixed model of topographical, typological, and temporal hierarchies governing cell-type diversity in the developing human telencephalon, including distinct excitatory lineages emerging in rostral and caudal cerebral cortex.


Figures

Fig. 1
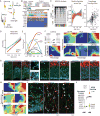
Fig. 1. Diverse cell types in human telencephalon development
(A) Schematic illustrating sample collection over time, region, and lamina. (B to D) Scatterplot of 4261 cells after principal components analysis and t-stochastic neighbor embedding (tSNE), colored by (B) cluster, (C) cortical lamina source, and (D) maker gene expression. (E) Similarity matrix representing pairwise Pearson correlations between clusters across principal components. (F) Metadata describing each cluster. VZ, ventricular zone; OSVZ, outer subventricular zone; GZ, germinal zone; CP, cortical plate; V1, primary visual cortex; PFC, prefrontal cortex; MGE, medial ganglionic eminence; LGE, lateral ganglionic eminence; M1, primary motor cortex.
Fig. 2
Fig. 2. Maturation of radial glia across germinal zones
(A) Schematic of early radial glia patterning. (B) Heatmap of gene expression in radial glia sampled from human telencephalon, organized according to cluster. (C) WGCNA reveals age-correlated modules combined into a pseudoage score. pcw, post-conception weeks. (D) PFC and V1 radial glia show a systematic difference in maturation. (E) Trajectories of gene expression across cortical radial glia pseudoage. (F) Landscapes of inferred gene expression along pseudolamina from VZ to SVZ (y axis) and pseudoage (x axis) for genes with conserved and zone-specific trajectories. (G) Immunohistochemistry for NEUROD1 in primary tissue sections. (H) Landscape plots of mTOR modulators. (I) Detection of mTOR effector pS6 in oRG cells. (J) Model for bifurcation of radial glia subtypes during maturation.
Fig. 3
Fig. 3. Landscapes of neuronal differentiation
(A) tSNE plots colored by module eigengene expression for topographically conserved neuronal differentiation modules. (B) Scatterplot of all genes for correlation with conserved differentiation network across MGE lineage (y axis) and cortical lineage (x axis) and expression of lineage-specific modules. (C) Scatterplot of excitatory lineage cells along axes of differentiation and maturation. Labeling cells by metadata reveals undifferentiated cell enriched for GZ origin, differentiated cells enriched for CP origin, and the expected age distribution. (D) Landscapes of inferred gene expression and schematic illustrate temporally conserved and temporally restricted trajectories of neuronal differentiation.
Fig. 4
Fig. 4. Emergence of area-specific neuronal cell clusters
(A to C) tSNE plot highlighting excitatory neurons, colored by (A) cluster, (B) area of origin, and (C) sample age. (D) Frequency of cells from each cluster and expressing common layer markers plotted over pseudoage. (E) Collection from PFC and V1, including 13 paired samples, and example genes with area-specific expression. Cells are colored by area of origin. (F) Validation of area specificity. (G and H) Examples and overall number of differentially expressed genes across cell types. (I) Genes plotted by correlation with neuronal differentiation versus area. (J) Area-specific subtypes emerge as neurons mature. (K) Density plot of cells colored based on coexpression of SATB2 and BCL11B in PFC, but not V1. (L) Narrow transition zone marks shift to rostral coexpression.

Comment in

  • A mixed model of neuronal diversity.
    Telley L, Jabaudon D. Telley L, et al. Nature. 2018 Mar 22;555(7697):452-454. doi: 10.1038/d41586-018-02539-4. Nature. 2018. PMID: 29565398 No abstract available.

References

    1. Mountcastle VB. J. R. Soc. Med. 1978;71:14–28. - PMC - PubMed
    1. Creutzfeldt OD. Naturwissenschaften. 1977;64:507–517. - PubMed
    1. O’Leary DD. Trends Neurosci. 1989;12:400–406. - PubMed
    1. Conel JLR. The Postnatal Development of the Human Cerebral Cortex. vol. 1. The Cortex of the Newborn. Harvard Univ. Press; 1939.
    1. Rakic P. Science. 1988;241:170–176. - PubMed

Publication types

MeSH terms