

Topologically associating domains and chromatin loops depend on cohesin and are regulated by CTCF, WAPL, and PDS5 proteins
- PMID: 29217591
- PMCID: PMC5730888
- DOI: 10.15252/embj.201798004
Topologically associating domains and chromatin loops depend on cohesin and are regulated by CTCF, WAPL, and PDS5 proteins
Abstract
Mammalian genomes are spatially organized into compartments, topologically associating domains (TADs), and loops to facilitate gene regulation and other chromosomal functions. How compartments, TADs, and loops are generated is unknown. It has been proposed that cohesin forms TADs and loops by extruding chromatin loops until it encounters CTCF, but direct evidence for this hypothesis is missing. Here, we show that cohesin suppresses compartments but is required for TADs and loops, that CTCF defines their boundaries, and that the cohesin unloading factor WAPL and its PDS5 binding partners control the length of loops. In the absence of WAPL and PDS5 proteins, cohesin forms extended loops, presumably by passing CTCF sites, accumulates in axial chromosomal positions (vermicelli), and condenses chromosomes. Unexpectedly, PDS5 proteins are also required for boundary function. These results show that cohesin has an essential genome-wide function in mediating long-range chromatin interactions and support the hypothesis that cohesin creates these by loop extrusion, until it is delayed by CTCF in a manner dependent on PDS5 proteins, or until it is released from DNA by WAPL.
Keywords: chromatin condensation; chromatin structure; genome organization; loop extrusion; vermicelli.
© 2017 The Authors.
Figures
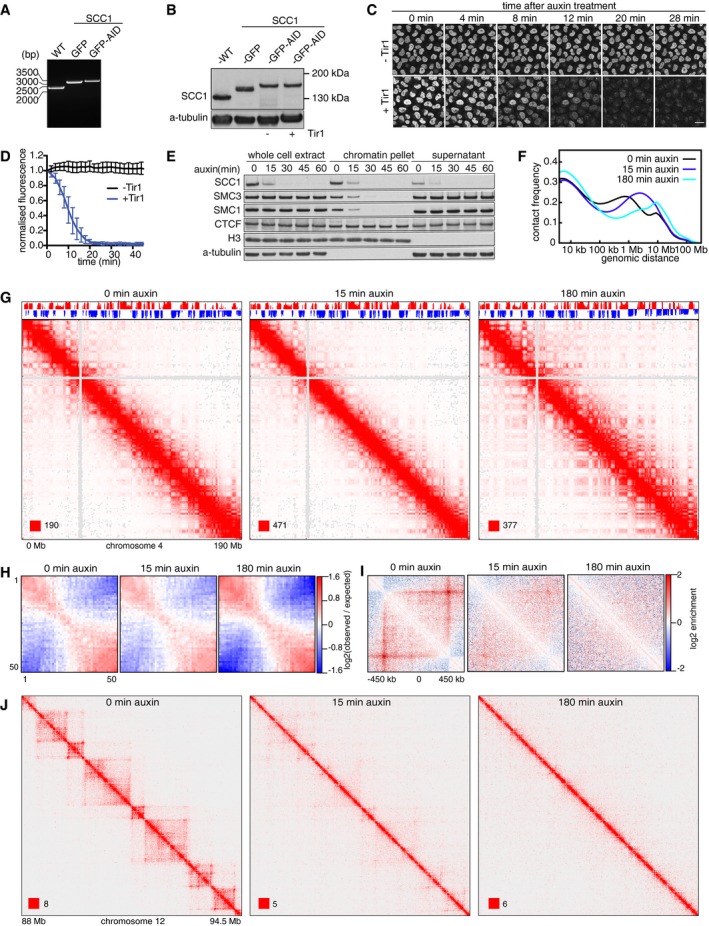
Genotype analysis of parental HeLa cells (WT), homozygous SCC1‐mEGFP cells (GFP), and homozygous SCC1‐mEGFP‐AID cells (GFP‐AID). Genomic PCR products were generated with the primers that are designed external to the homology arm which was used for inserting mEGFP or mEGFP‐AID encoding sequences downstream of the SCC1 gene. This resulted in fusion proteins with mEGFP or mEGFP‐AID tags C‐terminal to the SCC1 gene.
Immunoblotting analysis of whole‐cell extracts from parental HeLa WT cells, SCC1‐mEGFP cells, SCC1‐mEGFP‐AID (−) cells (i.e., not expressing Tir1), and SCC1‐mEGFP‐AID cells expressing Tir1 (+). α‐Tubulin: loading control.
Time course live‐cell imaging of SCC1‐mEGFP‐AID cells after auxin treatment. SCC1‐mEGFP‐AID cells with (+) or without (−) Tir1 were imaged after addition of auxin. Scale bar indicates 20 μm.
Quantification of nuclear GFP signal over time after auxin addition to SCC1‐mEGFP‐AID cells with (+) or without (−) Tir1. Normalized nuclear GFP signals are plotted over time after addition of Auxin into −Tir1 and +Tir1 cells (mean ± SD). n = 9 cells per condition.
Chromatin fractionation and immunoblot analysis of auxin‐treated SCC1‐mEGFP‐AID cells expressing Tir1. At the indicated time points after auxin addition, whole‐cell extracts, the chromatin pellet fraction, and the supernatant fraction were analyzed by immunoblotting, using antibodies against the proteins indicated on the left.
Intra‐chromosomal contact frequency distribution as a function of genomic distance, at 0 (black), 15 (blue), and 180 min (cyan) after auxin addition to SCC1‐mEGFP‐AID cells expressing Tir1.
Coverage‐corrected Hi‐C contact matrices of chromosome 4, at 0 (left), 15 (center), and 180 min (right) after auxin addition to SCC1‐mEGFP‐AID cells expressing Tir1. The corresponding compartment signal tracks at 250 kb bin resolution are shown above the matrices. The matrices were plotted using Juicebox.
Long‐range (> 2 Mb) intra‐chromosomal contact enrichment between bins with varying compartment signal strength from most B‐like (1) to most A‐like (50).
Average contact enrichment around loops after auxin addition to SCC1‐mEGFP‐AID cells expressing Tir1, for the 82 × 600 kb long loops identified in G1 control HeLa cells. The matrices are centered (0) around the halfway point of the loop anchor coordinates.
For the same conditions as in (G–I), coverage‐corrected Hi‐C contact matrices in the 88–94.5 Mb region of chromosome 12, plotted using Juicebox.
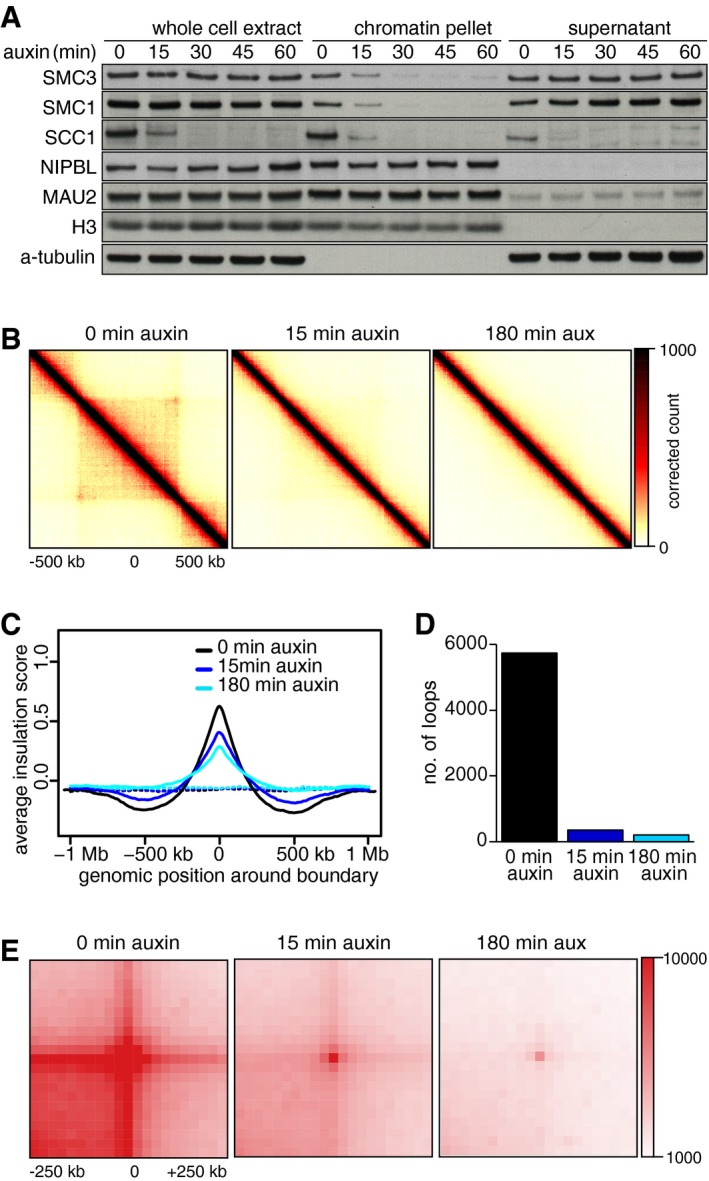
Same chromatin fractionation experiment as shown in Fig 1E. Note that the amount of cohesin loading complex, NIPBL, and MAU2, on chromatin were largely unchanged after SCC1 degradation.
Aggregate TAD analysis for SCC1‐mEGFP‐AID cells expressing Tir1, at 0 (left), 15 (center), and 180 min (right) after auxin addition. Average coverage‐corrected Hi‐C contact matrices are shown centered around the 166 × 500–550 kb long TADs identified in the control‐depleted G1 cells.
Average insulation score around TAD boundaries identified for the control‐depleted G1 cells, at 0 (black), 15 (blue), and 180 min (cyan) after auxin addition. Dashed lines show the average insulation score around the +1 Mb shifted boundaries as control.
Number of loops identified by HiCCUPS, at 0, 15, and 180 min after auxin addition. Colors are the same as in (C).
Total contact counts around loops after auxin addition, for all 750 kb–6 Mb long loops identified by HiCCUPS in G1 control.
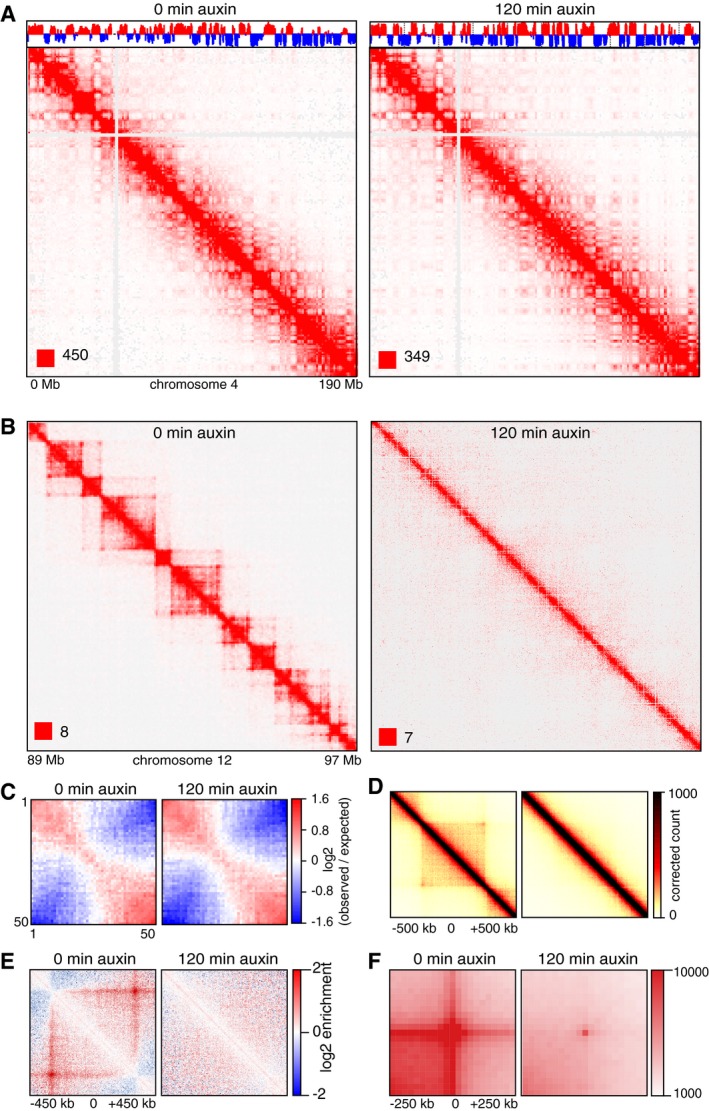
Coverage‐corrected Hi‐C contact matrices of chromosome 4, at 0 and 120 min after auxin addition in SCC1‐mEGFP‐AID cells. The corresponding compartment signal tracks at 250 kb bin resolution are shown above the matrices. The matrices were plotted using Juicebox.
For the same conditions, coverage‐corrected Hi‐C contact matrices in the 89–97‐Mb region of chromosome 12, plotted by using Juicebox.
Inter‐chromosomal contact enrichment between 250 kb bins with varying compartment strength from most B‐like (1) to most A‐like (50), in SCC1‐mEGFP‐AID control cells in a replicate experiment, at 0 and 120 min after auxin addition.
Aggregate TAD analysis for CTCF‐mEGFP‐AID cells expressing Tir1, 0 (left) and 120 min (right) after auxin addition. Average coverage‐corrected Hi‐C contact matrices are shown centered around the 166 × 500–550 kb long TADs identified in the control‐depleted HeLa cells.
Average contact enrichment around loops after auxin addition in SCC1‐mEGFP‐AID cells, for the 82 × 600 kb long loops identified by HiCCUPS in G1 control. The matrices are centered (0) around the halfway point of the loop anchor coordinates.
Total contact counts around loops after auxin addition in SCC1‐mEGFP‐AID cells, for all 750 kb–6 Mb long loops identified by HiCCUPS in G1 control.
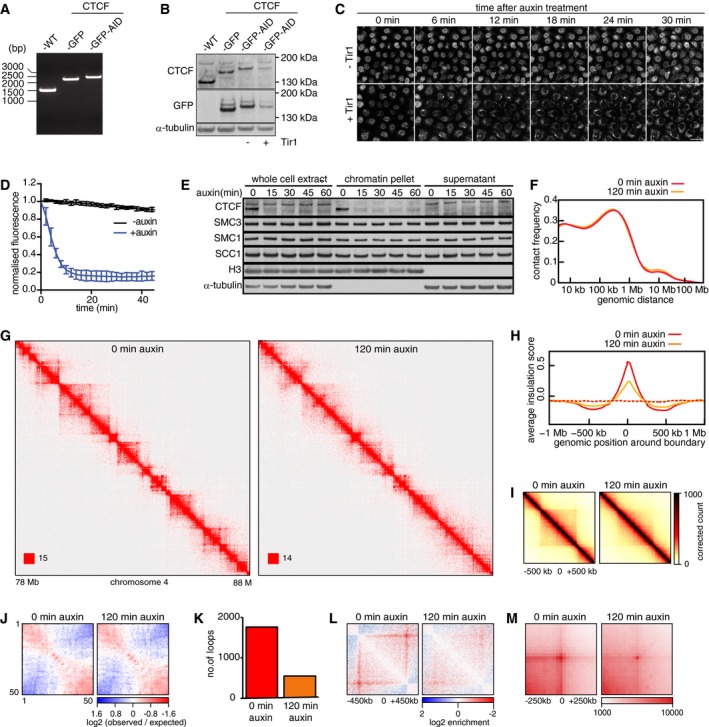
Genotype analysis of parental HeLa cells (WT), homozygous CTCF‐mEGFP cells (GFP), and homozygous CTCF‐mEGFP‐AID cells (GFP‐AID). Genomic PCR products were generated with the primers that are designed external to the homology arm which was used for inserting mEGFP or mEGFP‐AID encoding sequences downstream of the CTCF gene. This resulted in fusion proteins with mEGFP or mEGFP‐AID tags C‐terminal to the CTCF gene.
Immunoblotting analysis of whole‐cell extracts from parental HeLa WT cells, CTCF‐mEGFP cells, CTCF‐mEGFP‐AID (−) cells (i.e., not expressing Tir1), and CTCF‐mEGFP‐AID cells expressing Tir1 (+). α‐Tubulin: loading control.
Time course live‐cell imaging of CTCF‐mEGFP‐AID cells after auxin treatment. CTCF‐mEGFP‐AID cells with (+) or without (−) Tir1 were imaged after addition of auxin. Scale bar indicates 20 μm.
Quantification of nuclear GFP signal over time after auxin addition to CTCF‐mEGFP‐AID cells with (+) or without (−) Tir1. Normalized nuclear GFP signals are plotted over time after addition of Auxin into −Tir1 and +Tir1 cells (mean ± SD). n = 9 cells per condition.
Chromatin fractionation and immunoblot analysis of auxin‐treated CTCF‐mEGFP‐AID cells expressing Tir1. At the indicated time points after auxin addition, whole‐cell extracts, the chromatin pellet fraction, and the supernatant fraction were analyzed by immunoblotting, using antibodies against the proteins indicated on the left.
Intra‐chromosomal contact frequency distribution as a function of genomic distance, 0 (red) and 120 min (yellow) after auxin addition to CTCF‐mEGFP‐AID cells expressing Tir1.
Coverage‐corrected Hi‐C contact matrices of chromosome 4 (78–88 Mb), 0 (left), and 120 min (right) after auxin addition to CTCF‐mEGFP‐AID cells expressing Tir1. The matrices were plotted using Juicebox.
Average insulation score around TAD boundaries identified in control‐depleted G1 cells, for samples at 0 (red) and 120 min (yellow) after auxin addition to CTCF‐mEGFP‐AID cells expressing Tir1. Dashed lines show the average insulation score around the +1 Mb shifted boundaries as control.
Aggregate TAD analysis for CTCF‐mEGFP‐AID cells expressing Tir1, 0 (left) and 120 min (right) after auxin addition. Average coverage‐corrected Hi‐C contact matrices are shown centered around the 166 × 500–550 kb long TADs identified in the control‐depleted HeLa cells.
Long‐range (> 2 Mb) intra‐chromosomal contact enrichment between bins with varying compartment signal strength from most B‐like (1) to most A‐like (50), in the same conditions as (F).
Number of loops identified by HiCCUPS, in the same conditions as (F–H).
Average contact enrichment around loops after auxin addition to CTCF‐mEGFP‐AID cells expressing Tir1, for the 82 × 600 kb long loops identified by HiCCUPS in control‐depleted G1 cells. The matrices are centered (0) around the halfway point of the loop anchor coordinates.
Total contact counts around loops after auxin addition, for all 750 kb–6 Mb long loops identified by HiCCUPS in G1 control. The vertical and horizontal axes of the matrices were centered around the upstream and the downstream loop anchors, respectively.
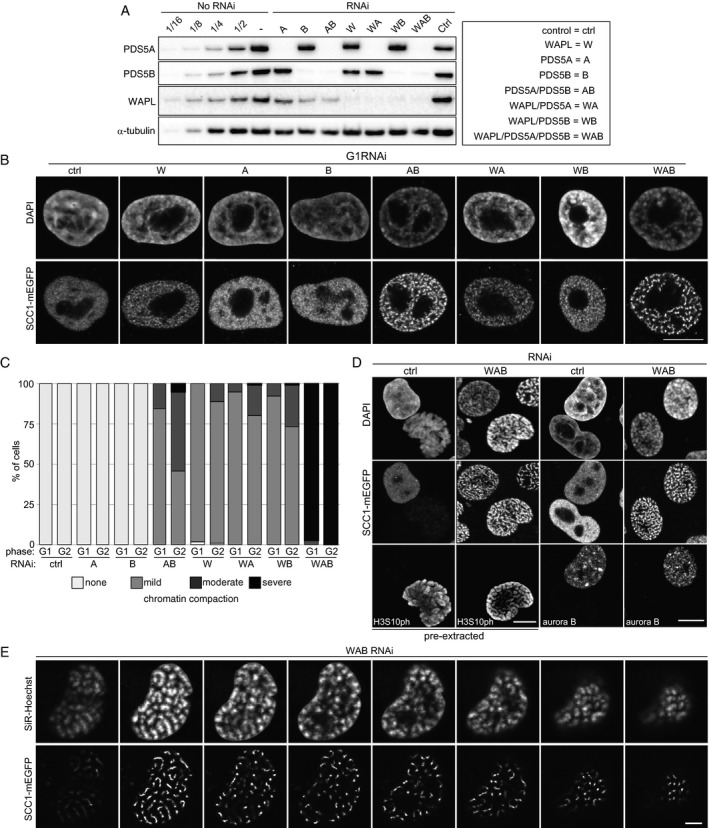
Immunoblotting analysis of SCC1‐mEGFP cells treated with indicated single siRNAs or their combinations.
Representative immunofluorescence images of SCC1‐mEGFP cells shown in (A) stained for GFP at G1‐phase. DNA was counterstained with DAPI. Scale bar indicates 10 μm.
Phenotypic classification of chromatin compaction in G1‐ and G2‐phase in (B) and Appendix Fig S2, n > 100 cells per condition.
Immunofluorescence microscopy of SCC1‐mEGFP cells depleted for WAB or control‐depleted (ctrl). Fixed cells with or without pre‐extraction were stained for GFP and DAPI in combination with either phospho‐H3 Ser10 (H3S10ph) or aurora B staining. Scale bar indicates 10 μm.
Live‐cell imaging of SCC1‐mEGFP cells depleted for WAB. Individual confocal sections from Appendix Fig S2D are shown, using 0.4 μm confocal distance between original sections. DNA was counterstained with SiR‐DNA. Scale bar indicates 5 μm.
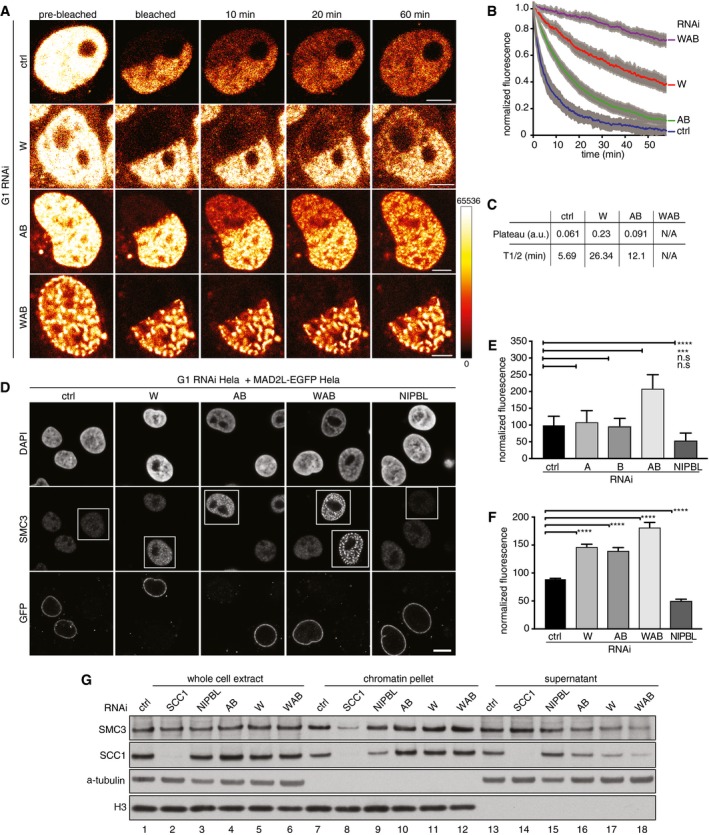
Representative images of an inverse fluorescence recovery after photobleaching (iFRAP) experiment using SCC1‐mEGFP cell lines in G1‐phase that were control‐depleted (ctrl) or depleted for WAPL (W), PDS5A/B (AB), WAPL/PDS5A/B (WAB). Fluorescence intensities are false‐colored as indicated. Scale bar indicates 5 μm.
Normalized signal intensities after photobleaching, for the iFRAP experiment shown in (A). Error bars denote standard error of the mean (s.e.m.), n > 8 cells per condition.
Quantification of the plateau and half‐life of recovery for the curves in (B). a.u. indicates arbitrary unit.
Immunofluorescence staining of chromatin‐bound SMC3 in HeLa cells. HeLa cells were control‐depleted (ctrl) or depleted for WAPL (W), PDS5A/B (AB), WAPL/PDS5A/B (WAB), or NIPBL, mixed and seeded with HeLa cells expressing MAD2L‐EGFP. RNAi treated cells are entangled. These cells were pre‐extracted prior to fixation and stained for DAPI, SMC3, and GFP. Scale bar indicates 10 μm.
Quantification of SMC3 fluorescence intensities obtained in the experiments shown in (D). SMC3 fluorescence intensities were normalized to those of neighboring RNAi‐untreated cells expressing MAD2L‐EGFP. The asterisk denotes a significant difference according to a Dunn's‐corrected Kruskal–Wallis test (n > 90, ****P‐value ≤ 0.0001, ***P‐value ≤ 0.001, N.S. = P‐value > 0.05). Error bars denote standard error of the mean (s.e.m.).
Same as panel (E) except for using PDS5A‐mEGFP cell lines as RNAi‐untreated cells. The asterisk denotes a significant difference according to a Dunn's‐corrected Kruskal–Wallis test (n > 30, ****P‐value ≤ 0.0001). Error bars denote standard error of the mean (s.e.m.).
Immunoblotting analysis of the whole‐cell extract, the chromatin pellet fraction and the supernatant fraction from HeLa cells treated with siRNAs indicated on the left.
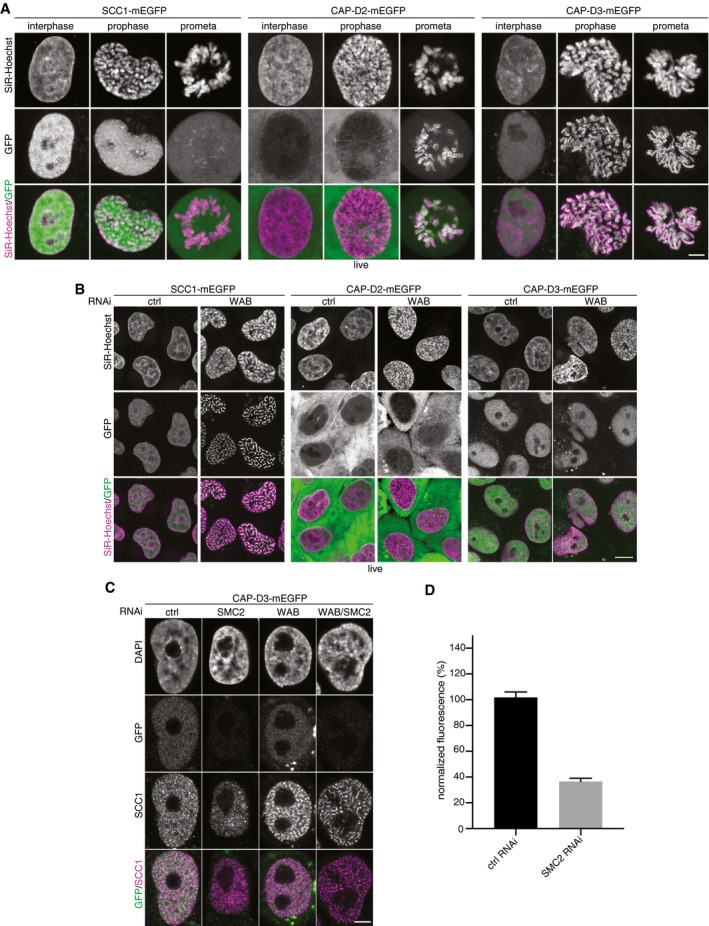
Live‐cell imaging of SCC1‐mEGFP, CAP‐D2‐mEGFP, and CAP‐D3‐mEGFP cells in which all alleles of these genes were C‐terminally fused to a mEGFP tag by CRISPR/Cas9 engineered genome editing. Representative cells at interphase, prophase, and prometaphase are shown. DNA was stained with SiR‐DNA by Spirochrome. Scale bar indicates 5 μm.
Live‐cell imaging of SCC1‐mEGFP, CAP‐D2‐mEGFP, and CAP‐D3‐mEGFP cells depleted for control or WAB by RNAi. DNA was stained with SiR‐DNA by Spirochrome. Scale bar indicates 10 μm.
Immunofluorescence images of CAP‐D3‐mEGFP cells depleted for SMC2, WAB, or SMC2/WAB. GFP staining was used as readout for estimating condensin depletion efficiency. Scale bar indicates 5 μm.
Quantification of immunofluorescence intensities for GFP signal in cells depleted for control and SMC2 is shown. Error bar depicts standard deviations of the means. Data from 2 replicates.
- A
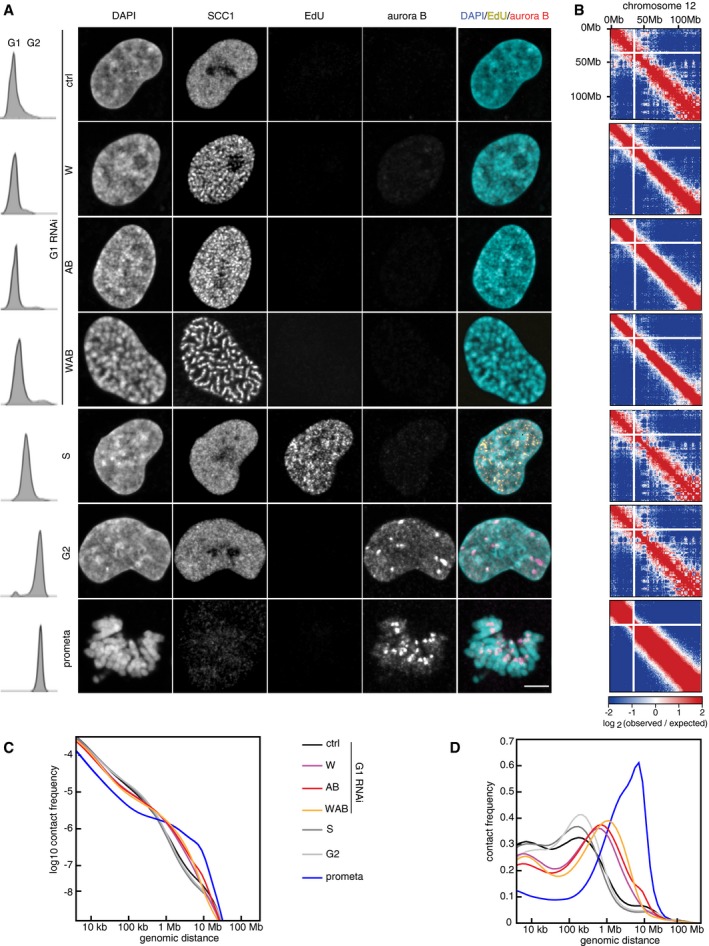
Immunofluorescence staining of DAPI, SCC1, EdU, aurora B, and joint DAPI/EdU/aurora B staining (from left to right) for control G1‐phase (ctrl), WAPL‐depleted (W), PDS5A/PDS5B‐depleted (AB), joint WAPL/PDS5A/PDS5B‐depleted (WAB), S‐phase (S), G2‐phase (G2), and prometaphase (prometa) cells (from top to bottom) together with flow‐cytometry profiles on the left. Scale bar indicates 5 μm.
- B
Coverage‐corrected Hi‐C contact enrichment matrices (using HOMER) of chromosome 12, for the same conditions as in (A).
- C, D
Intra‐chromosomal contact frequency distribution as a function of genomic distance using equal sized (C) or logarithmically increasing (D) genomic distance bins, for control G1‐phase (ctrl, black), WAPL‐depleted (W, purple), PDS5A/PDS5B‐depleted (AB, red), joint WAPL/PDS5A/PDS5B‐depleted (WAB, yellow), S‐phase (S, dark gray), G2‐phase (G2, light gray) and prometaphase (prometa, blue) cells.
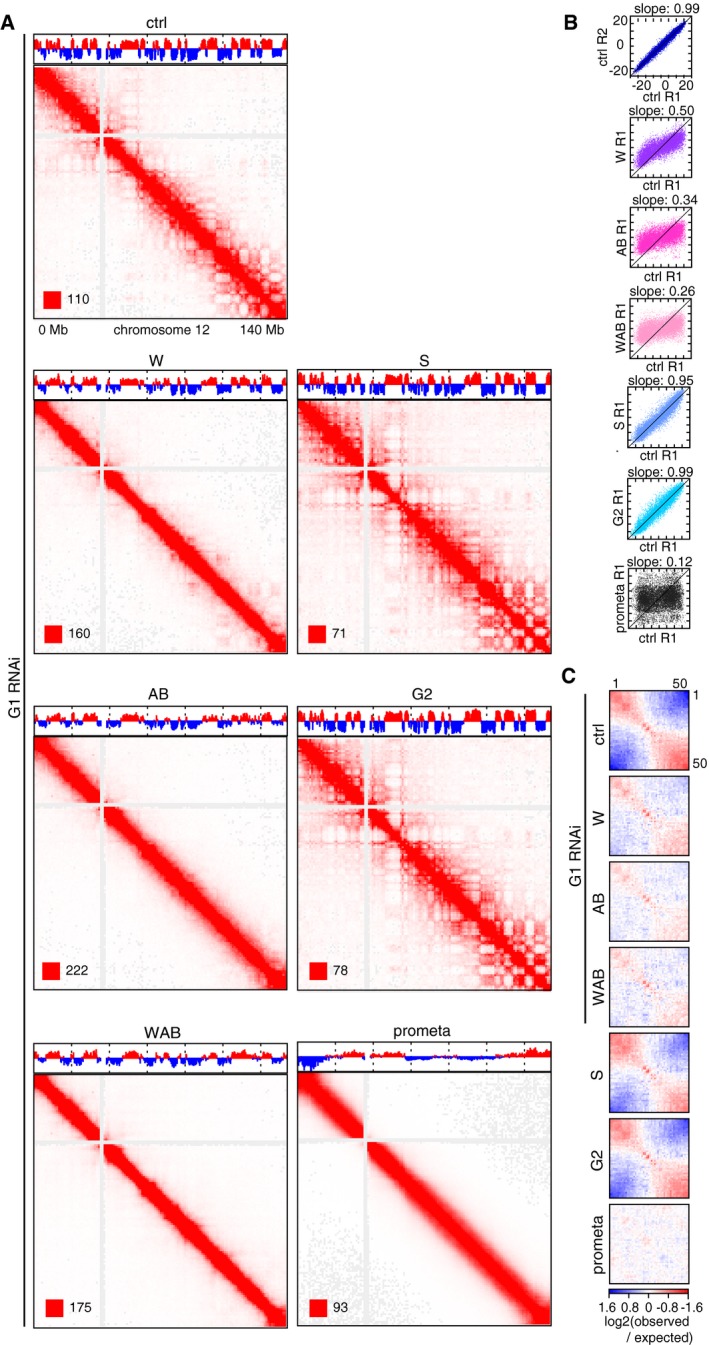
Coverage‐corrected Hi‐C contact matrices of chromosome 12, for control‐depleted (ctrl), WAPL‐depleted (W), PDS5A/PDS5B‐depleted (AB), joint WAPL/PDS5A/PDS5B‐depleted (WAB) cells in G1‐phase, as well as S‐phase (S), G2‐phase (G2), and prometaphase (prometa) cells. The corresponding compartment signal tracks at 250 kb bin resolution are shown above the matrices. The matrices were plotted using Juicebox.
Scatter plots of compartment signal values at 250 kb bin resolution, in the second replicate of control‐depleted G1‐phase cells (ctrl R2) and the first replicates (R1) of the other conditions (vertical axes) compared to the first replicate of control‐depleted G1‐phase cells (ctrl R1, horizontal axis). The slope of the linear fit is shown above the plots, and x = y (slope = 1) is drawn as black lines.
Inter‐chromosomal contact enrichment between genomic bins with varying compartment signal strength from most B‐like (1) to most A‐like (50), for the same conditions as in (A).
- A
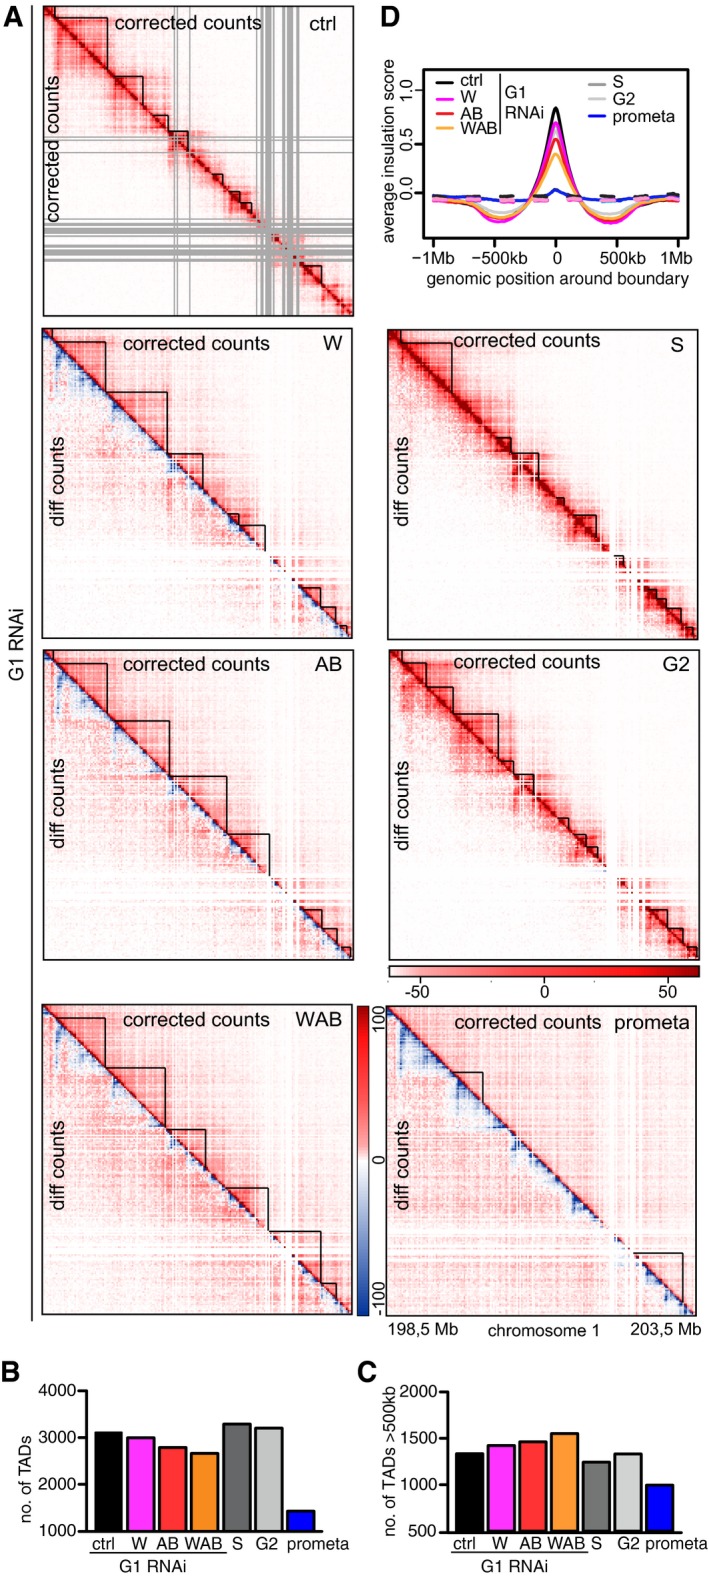
Coverage‐corrected Hi‐C contact count matrices (upper triangles, using HOMER) in the 198.5–203.5 Mb region of chromosome 1, for control‐depleted (ctrl), WAPL‐depleted (W), PDS5A/PDS5B‐depleted (AB), joint WAPL/PDS5A/PDS5B‐depleted (WAB) cells in G1‐phase, as well as S‐phase (S), G2‐phase (G2), and prometaphase (prometa) cells. Contact count difference matrices compared to ctrl‐G1 (lower triangles) are shown for all non‐control conditions.
- B, C
The number of TADs (B) and the number of long (> 500 kb) TADs (C) in the same conditions as in (A). Colors are as in Fig 5C.
- D
Average insulation score around TAD boundaries identified in control‐depleted G1 cells, for the same conditions as in (A). Dashed lines show the average insulation score around the +1 Mb shifted boundaries as control.
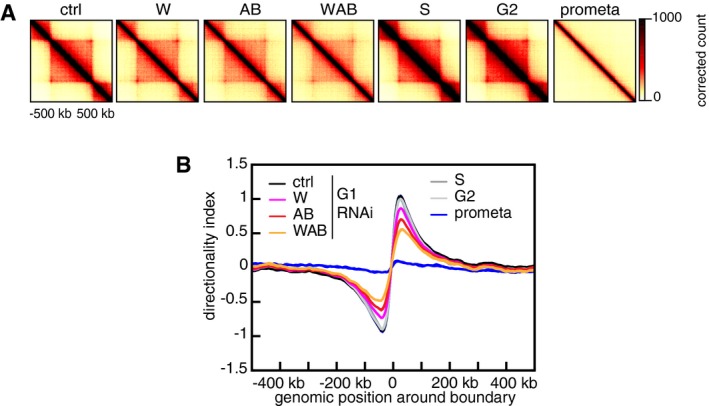
Aggregate TAD analysis for control‐depleted (ctrl), WAPL‐depleted (W), PDS5A/PDS5B‐depleted (AB), joint WAPL/PDS5A/PDS5B‐depleted (WAB) cells in G1‐phase, as well as S‐phase (S), G2‐phase (G2), and prometaphase (prometa) cells. Average coverage‐corrected Hi‐C contact matrices are shown centered around the 166 × 500–550 kb long TADs identified in the control‐depleted G1 cells.
Average standardized directionality index profiles in a 1 Mb region centered around TAD boundaries identified in the control‐depleted cells, for the same conditions as in (A). Colors are as in Fig 7B.
- A, B
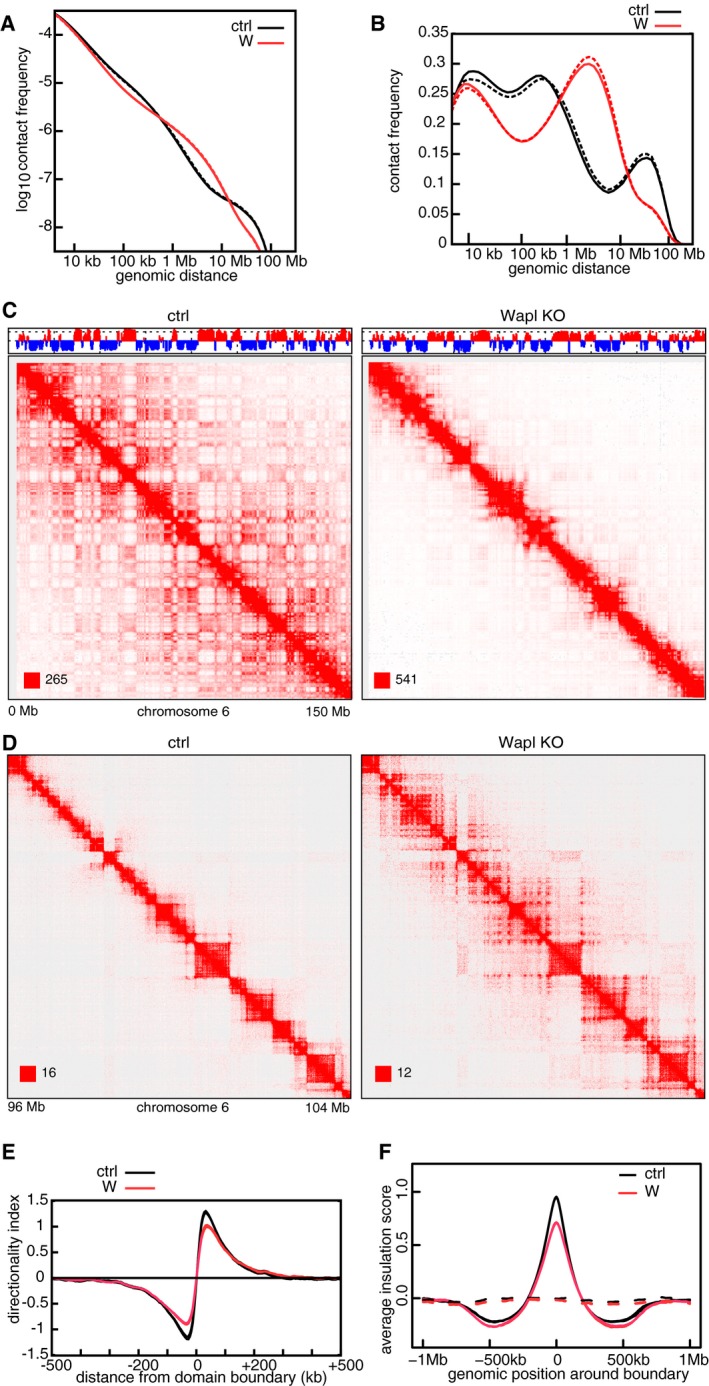
Intra‐chromosomal contact frequency distribution as a function of genomic distance using equal sized (A) or logarithmically increasing (B) genomic distance bins, for control (black) and Wapl KO (red) MEF cells. Solid and dashed lines show replicates.
- C
Coverage‐corrected Hi‐C contact matrices of chromosome 6, in control (left) and Wapl KO (right) MEF cells. The corresponding compartment signal tracks at 250 kb bin resolution are shown above the matrices. The matrices were plotted using Juicebox.
- D
For the same conditions, coverage‐corrected Hi‐C contact matrices in the 96–104 Mb region of chromosome 6, plotted by using Juicebox.
- E
Average standardized directionality index profiles in a 1 Mb region centered around TAD boundaries identified in the control MEF cells, for the same conditions as in (A). Colors are as in (A).
- F
Average insulation score around TAD boundaries identified in the control MEF cells, for the same conditions as in (A). Dashed lines show the average insulation score around the +1 Mb shifted boundaries as control. Colors are as in (A).
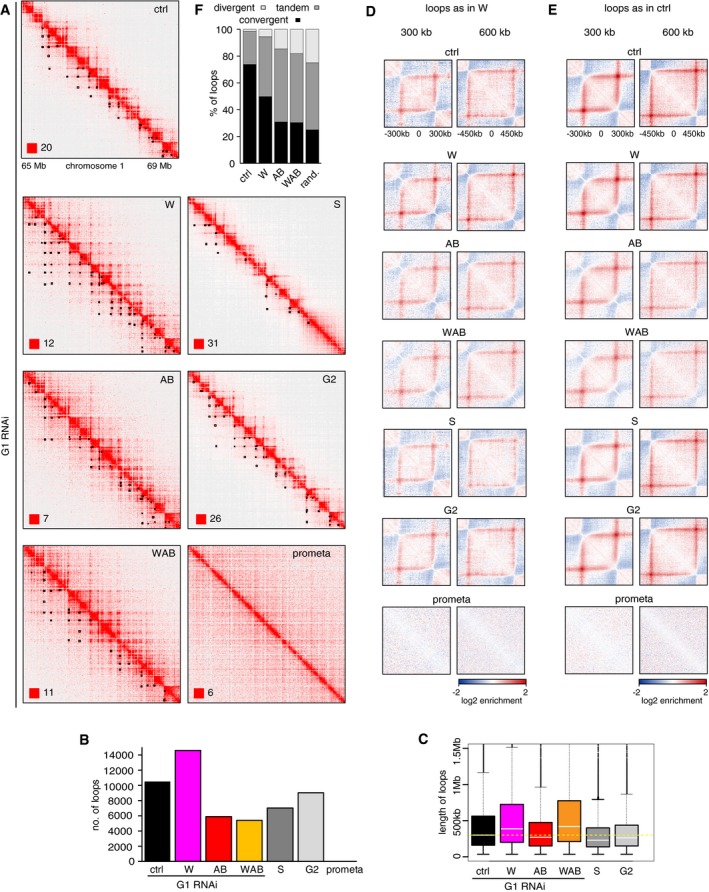
Coverage‐corrected Hi‐C contact matrices of the 65–69 Mb region of chromosome 1, for control‐depleted (ctrl), WAPL‐depleted (W), PDS5A/PDS5B‐depleted (AB), and joint WAPL/PDS5A/PDS5B‐depleted (WAB) cells in G1‐phase, as well as S‐phase (S), G2‐phase (G2), and prometaphase (prometa) cells. Loops identified in this region are marked by black rectangles in the lower triangle. The matrices were plotted using Juicebox.
Number of loops in the same conditions as in (A). Colors are as in Fig 5C.
Loop length distribution in the same conditions as in (A). Colors are as in (B). Solid white lines mark the median, and boxes represent the middle 50% of the data. Whiskers denote all values of 1.5 × interquartile range. Outliers are marked as dots and indicate values greater than 1.5 × interquartile range. Yellow dotted line indicates the mean of the control.
Average contact enrichment around the 207 × 300 kb long and 82 × 600 kb long loops identified in WAPL‐depleted cells but not in G1 control HeLa cells, for the same conditions.
Average contact enrichment around the 207 × 300 kb long and 82 × 600 kb long loops identified in G1 control HeLa cells, for the same conditions.
The proportion of convergent (black), tandem (dark gray), and divergent (light gray) CTCF binding orientation for loops with both anchors overlapping SMC3 and CTCF ChIP‐seq peaks as well as unambiguous CTCF binding directions, for loops identified in control‐depleted cells in G1‐phase (ctrl, 2,691 loops), in WAPL‐depleted but not in control‐depleted cells in G1‐phase (WAPL, 2,255 loops), in PDS5A/B‐depleted but not in control‐depleted cells in G1‐phase (AB, 628 loops) and joint WAPL/PDS5A/PDS5B‐depleted but not in control‐depleted cells in G1‐phase (WAB, 769 loops). The theoretically expected random proportions assuming no directionality bias are shown as comparison (rand.).
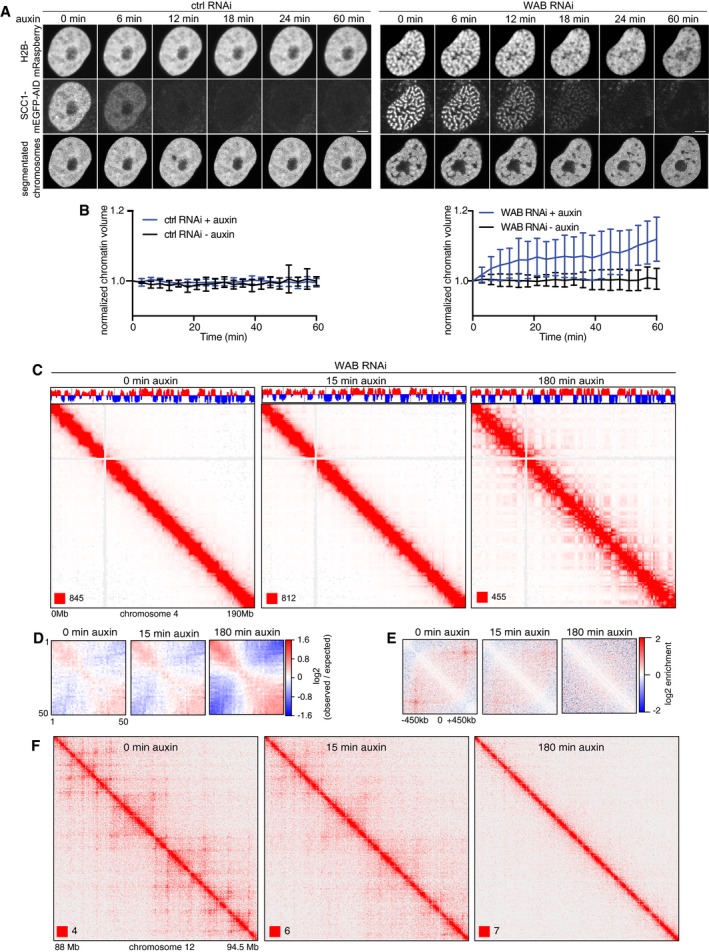
Analysis of the chromosome morphology changes after auxin addition in control‐depleted and WAPL/PDS5A/B‐depleted SCC1‐mEGFP‐AID cell lines that stably express mRaspberry‐H2B by live‐cell imaging. Scale bar indicates 5 μm.
Chromatin volumetric changes in auxin‐treated and untreated cells that have been depleted for control (left) and WAB (right). Chromatin volumes are normalized to the chromatin volumes at time 0 and plotted over time (n > 7 in each condition). Error bar depicts standard deviations of the means.
Coverage‐corrected Hi‐C contact matrices of chromosome 4, at 0 (left), 15 (center), and 180 min (right) after auxin addition to the WAPL/PDS5A/PDS5B‐depleted SCC1‐mEGFP‐AID cell line. The matrices were plotted using Juicebox. The corresponding compartment signal tracks at 250 kb bin resolution are shown above the matrices.
Inter‐chromosomal contact enrichment between bins with varying compartment signal strength from most B‐like (1) to most A‐like (50), for the same conditions as in (C).
Average contact enrichment around loops, for the 82 × 600 kb long loops identified in control‐depleted G1 cells. The matrices are centered (0) around the halfway point of the loop anchor coordinates.
Coverage‐corrected Hi‐C contact matrices in the 88–94.5 Mb region of chromosome 12, for the same conditions as in (C). The matrices were plotted using Juicebox.
- A
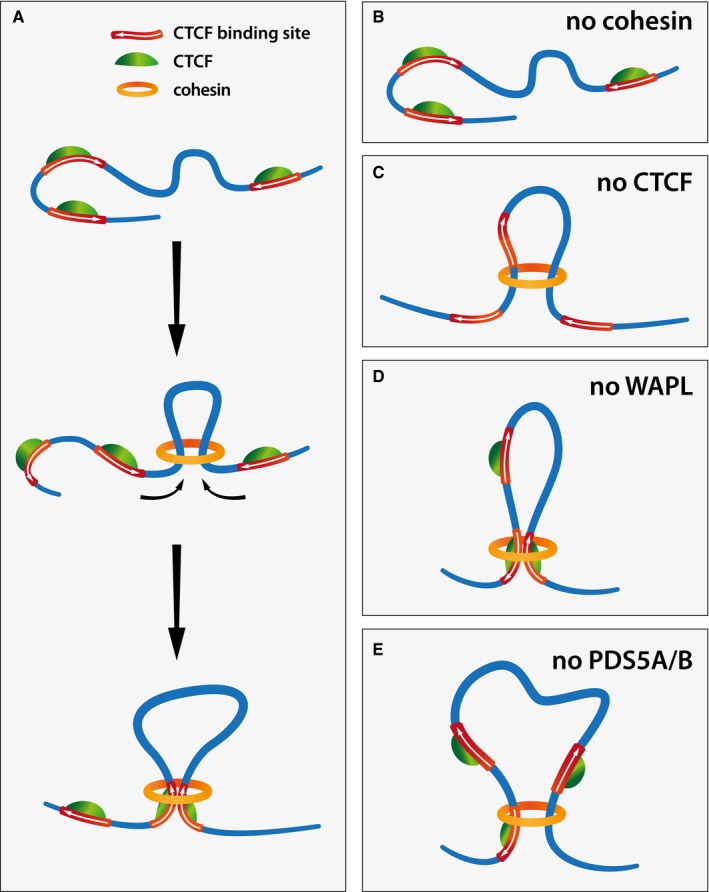
Graphical illustration of how cohesin might mediate loop extrusion. Cohesin binds to chromatin, extrudes a chromatin loop and stalls upon encountering CTCF bound at convergently oriented CTCF sites.
- B
In the absence of cohesin, chromatin loops are eliminated.
- C
n the absence of CTCF, cohesin extrudes chromatin loops but fails to stall at convergently oriented CTCF binding sites.
- D, E
In the absence of WAPL (D) or PDS5A/B (E), cohesin extrudes longer chromatin loops, which occur more frequently between regions of non‐convergent (D) or single CTCF sites (E). While in the absence of Wapl loop extrusion still halts at occupied CTCF sites, in the absence of PDS5A/B loop extrusion may halt less readily, resulting in fewer specific loops called.
Comment in
-
Cohesin: building loops, but not compartments.EMBO J. 2017 Dec 15;36(24):3549-3551. doi: 10.15252/embj.201798654. Epub 2017 Dec 7. EMBO J. 2017. PMID: 29217589 Free PMC article.
References
-
- Aszódi A (2012) MULTOVL: fast multiple overlaps of genomic regions. Bioinformatics 28: 3318–3319 - PubMed
-
- Bell AC, Felsenfeld G (2000) 1–30 Methylation of a CTCF‐dependent boundary controls imprinted expression of the Igf2 gene. Nature 405: 482–485 - PubMed
-
- Blat Y, Protacio RU, Hunter N, Kleckner N (2002) Physical and functional interactions among basic chromosome organizational features govern early steps of meiotic chiasma formation. Cell 111: 791–802 - PubMed
MeSH terms
Substances
Grants and funding
LinkOut - more resources
Full Text Sources
Other Literature Sources
Molecular Biology Databases
