

Suboptimal Acclimation of Photosynthesis to Light in Wheat Canopies
- PMID: 29217593
- PMCID: PMC5813572
- DOI: 10.1104/pp.17.01213
Suboptimal Acclimation of Photosynthesis to Light in Wheat Canopies
Abstract
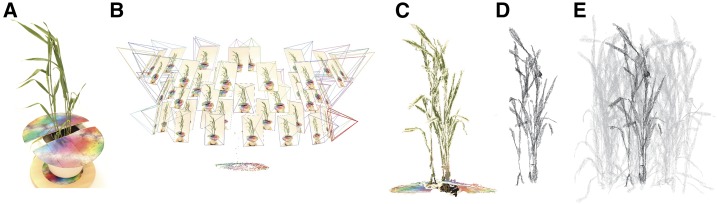
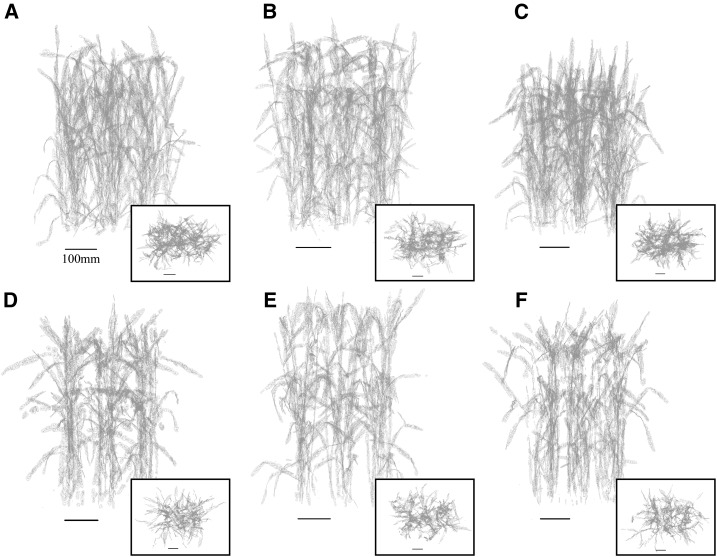
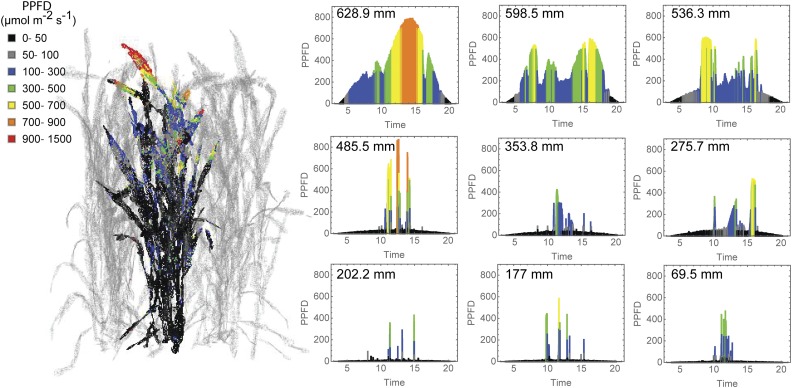
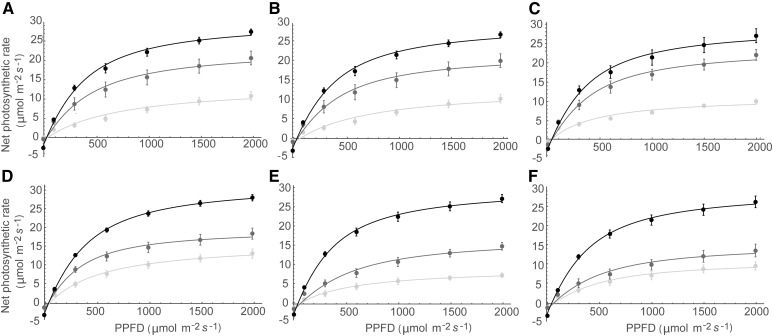
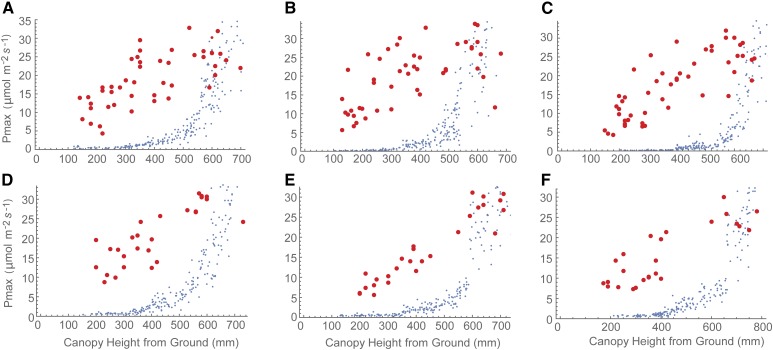
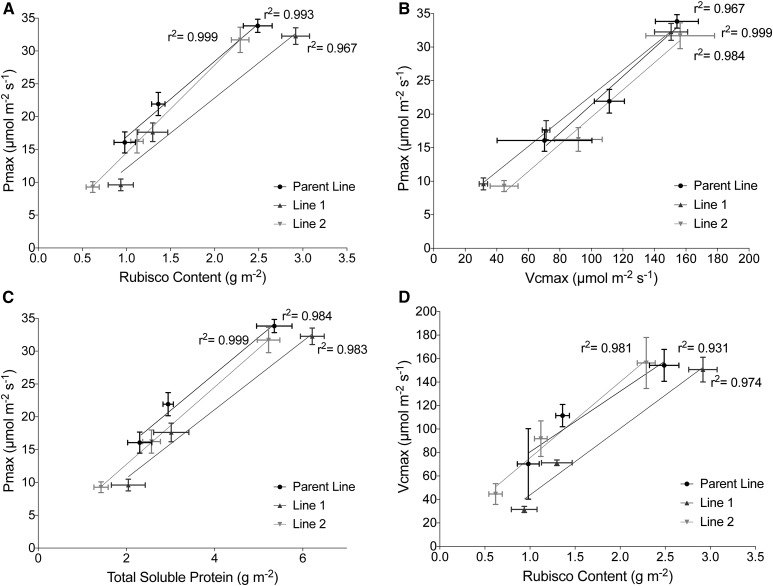
Photosynthetic acclimation (photoacclimation) is the process whereby leaves alter their morphology and/or biochemistry to optimize photosynthetic efficiency and productivity according to long-term changes in the light environment. The three-dimensional architecture of plant canopies imposes complex light dynamics, but the drivers for photoacclimation in such fluctuating environments are poorly understood. A technique for high-resolution three-dimensional reconstruction was combined with ray tracing to simulate a daily time course of radiation profiles for architecturally contrasting field-grown wheat (Triticum aestivum) canopies. An empirical model of photoacclimation was adapted to predict the optimal distribution of photosynthesis according to the fluctuating light patterns throughout the canopies. While the photoacclimation model output showed good correlation with field-measured gas-exchange data at the top of the canopy, it predicted a lower optimal light-saturated rate of photosynthesis at the base. Leaf Rubisco and protein contents were consistent with the measured optimal light-saturated rate of photosynthesis. We conclude that, although the photosynthetic capacity of leaves is high enough to exploit brief periods of high light within the canopy (particularly toward the base), the frequency and duration of such sunflecks are too small to make acclimation a viable strategy in terms of carbon gain. This suboptimal acclimation renders a large portion of residual photosynthetic capacity unused and reduces photosynthetic nitrogen use efficiency at the canopy level, with further implications for photosynthetic productivity. It is argued that (1) this represents an untapped source of photosynthetic potential and (2) canopy nitrogen could be lowered with no detriment to carbon gain or grain protein content.
© 2018 The author(s). All Rights Reserved.
Figures
References
-
- Anderson JM, Chow WS, Park YI (1995) The grand design of photosynthesis: acclimation of the photosynthetic apparatus to environmental cues. Photosynth Res 46: 129–139 - PubMed
-
- Anderson JM, Osmund CB (1987) Shade-sun responses: compromises between acclimation and photoinhibition. In Kyle DJ, Osmond CB, Arntzen CJ, eds, Photoinhibition. Elsevier Science, Amsterdam, : pp 1–38
-
- Anten NP, Schieving F, Werger MJ (1995) Patterns of light and nitrogen distribution in relation to whole canopy carbon gain in C3 and C4 mono- and dicotyledonous species. Oecologia 101: 504–513 - PubMed
-
- Björkman O. (1981) Responses to different quantum flux densities. In Lange OL, Nobel PS, Osmond CB, Ziegler H, eds, Physiological Plant Ecology. Springer, Berlin, pp 57–107
Publication types
MeSH terms
Substances
Grants and funding
LinkOut - more resources
Full Text Sources
Other Literature Sources
