. 2018 May 22;137(21):2256-2273.
doi: 10.1161/CIRCULATIONAHA.116.026099. Epub 2017 Dec 7.

Nicotinamide Riboside Preserves Cardiac Function in a Mouse Model of Dilated Cardiomyopathy

Affiliations

Nicotinamide Riboside Preserves Cardiac Function in a Mouse Model of Dilated Cardiomyopathy

Nicolas Diguet et al. Circulation. .

Erratum in

Abstract

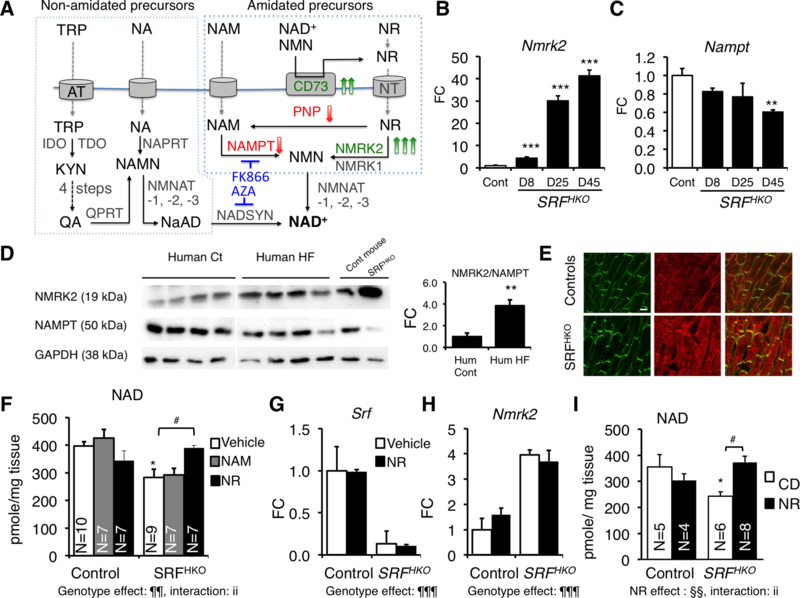
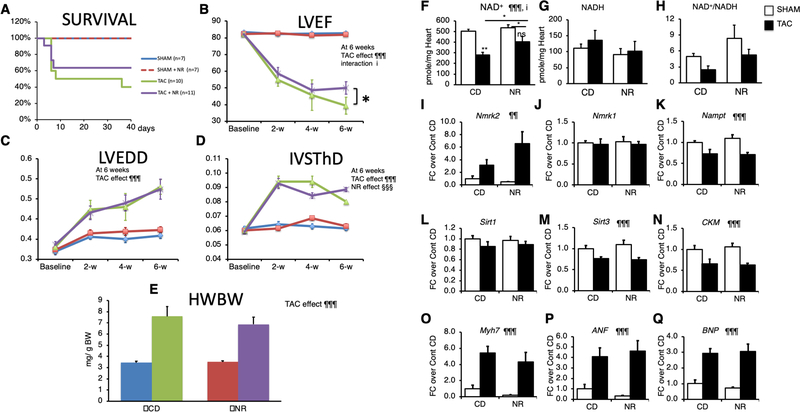
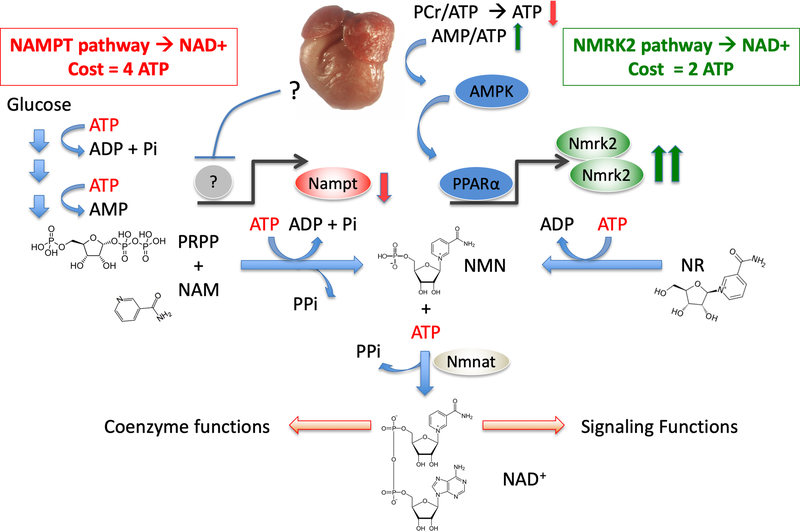
Background: Myocardial metabolic impairment is a major feature in chronic heart failure. As the major coenzyme in fuel oxidation and oxidative phosphorylation and a substrate for enzymes signaling energy stress and oxidative stress response, nicotinamide adenine dinucleotide (NAD+) is emerging as a metabolic target in a number of diseases including heart failure. Little is known on the mechanisms regulating homeostasis of NAD+ in the failing heart.

Methods: To explore possible alterations of NAD+ homeostasis in the failing heart, we quantified the expression of NAD+ biosynthetic enzymes in the human failing heart and in the heart of a mouse model of dilated cardiomyopathy (DCM) triggered by Serum Response Factor transcription factor depletion in the heart (SRFHKO) or of cardiac hypertrophy triggered by transverse aorta constriction. We studied the impact of NAD+ precursor supplementation on cardiac function in both mouse models.

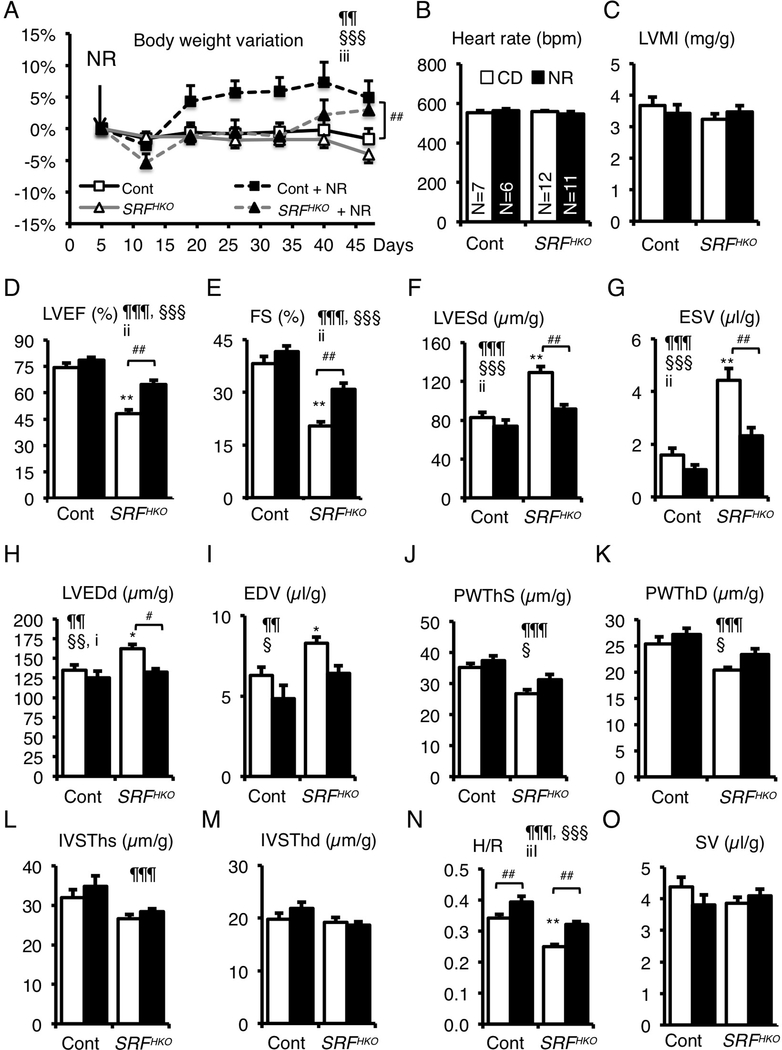
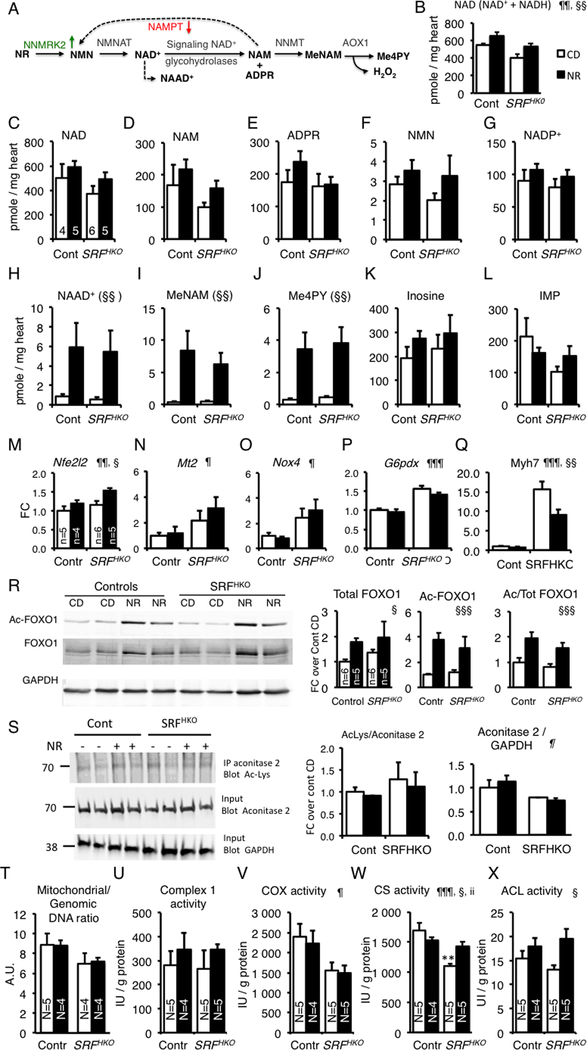
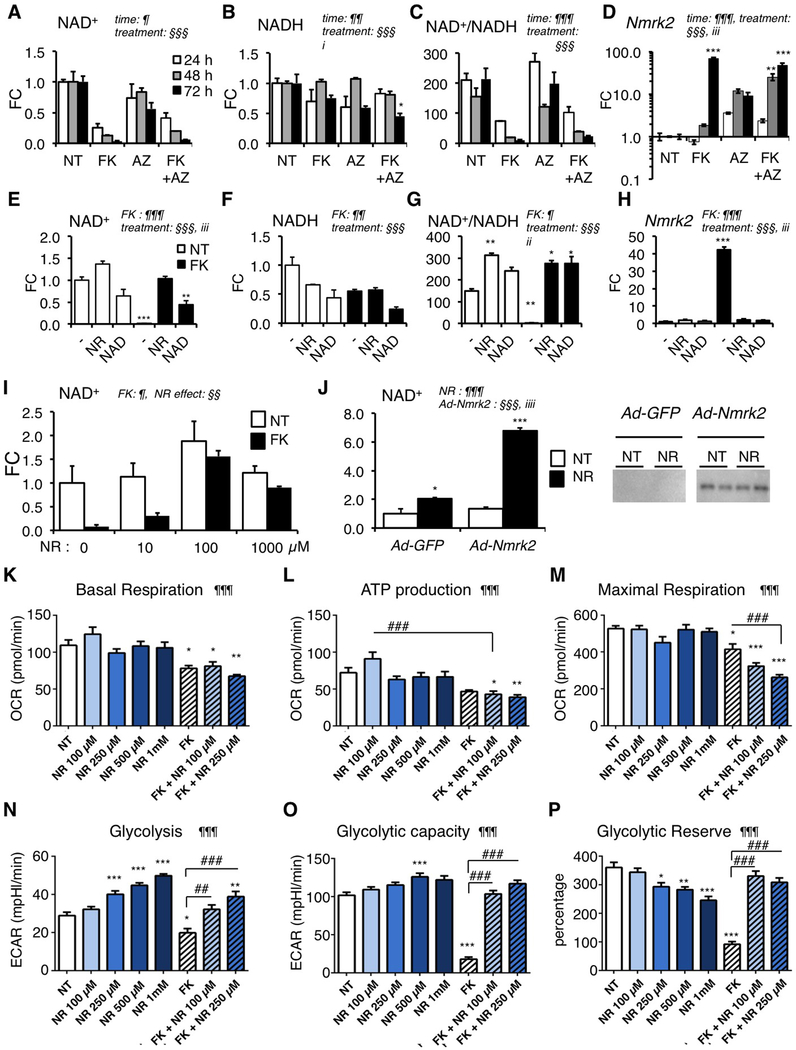
Results: We observed a 30% loss in levels of NAD+ in the murine failing heart of both DCM and transverse aorta constriction mice that was accompanied by a decrease in expression of the nicotinamide phosphoribosyltransferase enzyme that recycles the nicotinamide precursor, whereas the nicotinamide riboside kinase 2 (NMRK2) that phosphorylates the nicotinamide riboside precursor is increased, to a higher level in the DCM (40-fold) than in transverse aorta constriction (4-fold). This shift was also observed in human failing heart biopsies in comparison with nonfailing controls. We show that the Nmrk2 gene is an AMP-activated protein kinase and peroxisome proliferator-activated receptor α responsive gene that is activated by energy stress and NAD+ depletion in isolated rat cardiomyocytes. Nicotinamide riboside efficiently rescues NAD+ synthesis in response to FK866-mediated inhibition of nicotinamide phosphoribosyltransferase and stimulates glycolysis in cardiomyocytes. Accordingly, we show that nicotinamide riboside supplementation in food attenuates the development of heart failure in mice, more robustly in DCM, and partially after transverse aorta constriction, by stabilizing myocardial NAD+ levels in the failing heart. Nicotinamide riboside treatment also robustly increases the myocardial levels of 3 metabolites, nicotinic acid adenine dinucleotide, methylnicotinamide, and N1-methyl-4-pyridone-5-carboxamide, that can be used as validation biomarkers for the treatment.

Conclusions: The data show that nicotinamide riboside, the most energy-efficient among NAD precursors, could be useful for treatment of heart failure, notably in the context of DCM, a disease with few therapeutic options.

Keywords: NAD; acetyl coenzyme A; cardiomyopathy, dilated; energy metabolism; glycolysis; heart failure; nicotinamide-beta-riboside; serum response factor.


Figures

Figure 1.
Figure 1.. Activation of the Nmrk2 enzyme in dilated cardiomyopathy
(A) Biosynthetic NAD+ pathways in mammalian cells. NA (Nicotinic acid), NAM, NR and TRP enter cells through specialized transport systems. Extracellular NAD+ and NMN are hydrolyzed to NR by the ectonucleotidase CD73. In the de novo pathway, TRP is converted to kynurenin (KYN) by IDO and TDO enzymes, and then into quinolic acid (QA) in 4 steps (not detailed). QA, NA and NAM are phosphoribosylated by QPRT, NAPRT1, and NAMPT enzymes, respectively, to form mononucleotides NAMN and NMN. NR is phosphorylated by NMRK enzymes to form NMN. NR can be converted to NAM by PNP. NAMN and NMN adenylated by the NMNAT enzymes to form the dinucleotides NAAD+ and NAD+. NAAD+ is amidated by NADSYN1. Genes increased in SRFHKO heart are highlighted in green and those repressed in red (see accompanying Table S2). Inhibitors are shown in blue. (B, C) RT qPCR analysis of Nmrk2 and Nampt mRNA fold change (FC) in SRFHKO hearts at different days (D) after SRF inactivation. CD, regular chow diet; NR, nicotinamide riboside enriched diet. (D) Western blot analysis of NMRK2 and NAMPT protein in control and failing human hearts and control and SRFHKO mouse hearts at D45. GAPDH is used as loading control. All human and mouse samples were analyzed on single blot but 2 lanes separating that showed signs of protein degradation and aberrant migration pattern were cut out of the picture (E) Control and SRFHKO mutant heart sections stained for NMRK2 (red) and vinculin (green) at D45. White bar in upper left panel = 20 μm. (F-H) NAM or NR (30 μmole) were injected i.p. from D8 to 15 (400 mg/kg/day) to control and SRFHKO mice. Vehicle: saline solution. (F) Myocardial NAD+ levels. (G, H) RT qPCR analysis of Nmrk2 and Nampt mRNA levels. (I) Myocardial NAD levels in control and SRFHKO mice fed regular chow diet (CD) or NR enriched diet (0.22%. 400–450 mg/kg/day) from D5 to 20. Throughout the figure data are expressed as mean ± SEM. FC, fold change over control group. Statistical analysis: One-way ANOVA (B, C) or two-way factorial ANOVA for independent samples (F-I). ¶¶ p≤ 0.01, ¶¶¶ p≤ 0.001 for the genotype effect; §§ p≤ 0.01 for the NR treatment effect; ii p≤ 0.01 for the interaction effect. Post-hoc Tukey test: Asterisks indicate statistical significant difference between any group versus the control CD (or vehicle) group: * p≤ 0.05, ** p≤ 0.01, *** p≤ 0.001. # p≤ 0.05 for the effect of NR within the SRFHKO group. A T-test was used for the graph at the right of panel D: ** p≤ 0.01.
Figure 2.
Figure 2.. NR supplementation in diet prevents the onset of heart failure and dilatation.
(A) CD or NR supplemented diet (0.22 %) was given ad libitum to control and SRFHKO mice from D5 after SRF inactivation to the end of the experiment. Body weight was monitored throughout the period. Data are expressed as mean % weight variation ± SEM, compared to weight at D5. A Two-Factor ANOVA with repeated measures on one factor was used for statistical analysis. §§§ p≤ 0.001 for the time effect; iii, p≤ 0.001 for the interaction effect. Tukey test: * p<0.05, ** p<0.01, *** p<0.001 for any time point versus day 5 within a group; #, p≤ 0.05 for the NR treatment in SRFHKO group. (B-O) Cardiac parameters of control and SRFHKO mutant were analyzed in M-Mode echocardiography between D45 to D47. (B) Heart rate; (C) Left ventricle (LV) mass index; (D) LV ejection fraction; (E) Fractional shortening; (F, G) LV end-systolic diameter (D) and volume (G); (H, I) LV end-diastolic diameter (H) and volume (I); (J, K); LV posterior wall thickness in systole (J) and diastole (K); (L, M) Interventricular septum thickness in systole (L) and diastole (M); (N) H/R: LV thickness (H) to radius (R) ratio; (O) Stroke volume. Dimensions were normalized by the body weight. Data are expressed as mean ± SEM. Statistical analysis: two-way factorial ANOVA for independent samples. ¶¶ p≤ 0.01, ¶¶¶ p≤ 0.001 for the genotype effect; § p≤ 0.05, §§ p≤ 0.01, §§§ p≤ 0.001 for the NR treatment effect; i p≤0.05, ii p≤ 0.01, iii p≤0.001 for the interaction effect. Tukey test: Asterisks indicate statistical significant difference versus the control CD group: * p≤ 0.05, ** p≤ 0.01, *** p≤ 0.001. # p≤ 0.05, ## p≤ 0.01 for the effect of NR within the SRFHKO group.
Figure 3.
Figure 3.. Impact of NR treatment on cardiac NAD+ metabolome
(A) NR to NAD+ pathway and NAD+ catabolism are depicted. NAD+ is cleaved into NAM and ADP-ribose by NAD+ consuming enzymes. NAM is either recycled by NAMPT or methylated by the Nicotinamide N-Methyl Transferase (NMT) enzyme and oxidized by the aldehyde deoxidase 1 (AOX1) giving rise to degradation products Me-NAM and Me-4PY, respectively. (B) Myocardial NAD was quantified by colorimetric NAD+ cycling assay at day 50 in controls (N=6), Controls + NR (N=5), SRFHKO (N=6), SRFHKO + NR (N=6). Data are expressed as means ± SEM. (C-L) Myocardial metabolites were analyzed by LCMS-based metabolomics. See abbreviations in the text. Controls (N=4), Controls + NR (N=5), SRFHKO (N=6), SRFHKO + NR (N=5, except for NAM, MeNAM and Me-4PY, N=4, no peak was identified in one sample). Data are expressed as means ± SEM. (M-Q) Expression of genes related to oxidative stress signaling (M-O) and cardiac structural and metabolic remodeling (Q). N=5 in each group. (R) Representative western blot analysis of FOXO1 and acetyl-FOXO1 of 3 independent experiments realized in different duplicates for each group. GAPDH is used as a loading control. Right graphs: Quantification of total and acetyl-FOXO1 ratio on GAPDH and acetyl-FOXO1/Total FOXO1 ratio in N=5 to 6 animals per group. (S) Acetylation level of mitochondrial Aconitase 2. Aconitase 2 (75 kDa) was immunoprecipitated using a rabbit polyclonal antibody and the immunoprecipitate was analyzed by western blot using a mouse monoclonal anti-Ac(K103) antibody. Inputs were run in a parallel gel and immunoblotted with anti-aconitase 2 and anti-GAPDH for loading control. The ratio of Acetyl-Aconitase2/Total Aconitase2 and Aconitase2/GAPDH are shown on the right. See accompanying Supp. Fig.6A for control immunoprecipitation with preimune rabbit IgG. T-X) LV cardiac tissue was isolated at 50 days after tamoxifen injection in control and SRFHKO mice fed control diet (CD) or NR-enriched diet. DNA and proteins were extracted from parallel samples to quantify mitochondrial to genomic DNA ratio (T) and enzymatic activities: (U) Complex I, (V) Cytochrome oxidase, (W) Citrate synthase, (X) ATP Citrate Lyase. See associated supplementary figure S7. In (M-S), data are expressed as mean fold change (FC) ± SEM over control group CD. Statistical analysis: Two-way factorial ANOVA for independent samples was used for all panels. ¶ p≤0.05, ¶¶ p≤0.01, ¶¶¶ p≤ 0.001 for the genotype effect; § p≤ 0.05, §§ p≤ 0.01, §§§ p≤ 0.001 for the NR treatment effect; ii p≤ 0.01 for the interaction effect. Tukey test: Asterisks indicate statistical significant difference versus the control CD group: ** p≤ 0.01.
Figure 4.
Figure 4.. Nmrk2 expression is activated by repression of alternative NAD+ biosynthetic pathways
(A-C) Intracellular levels of NAD+ (A), NADH (B) and NAD+/NADH ratio (C) in NRC after 10 μM FK866 and/or 20 μM Azaserin treatment or no treatment (NT) for 24 h to 72 h as indicated. (D) Nmrk2 mRNA level in NRC treated as in (A-C) (E-G) Same as in (A-C) in NRC treated for 72h with 10 μM FK866 or not treated (NT) in normal culture medium (−) or in presence of 250 μM NAD+ or 1 mM NR. (H) Nmrk2 mRNA level in NRC treated as in (E-G) (I) NAD+ levels in NRCs treated with 10 μM FK866 for 72 h, or not treated (NT) in the presence of increasing concentration of NR in culture medium. (J) NAD+ content in non-treated (NT) or following 24 h NR treatment (1mM) in NRC infected with Ad-GFP or HA-Nmrk2. Bottom: western blot detection of HA-Nmrk2 with anti-HA antibody. (K-M) Mitochondrial stress test in Seahorse analyzer. NRC grown on Seahorse 96 well plates were analyzed for oxygen consumption rate (OCR) at day 8 after 5 days of treatment. (K) Basal mitochondrial respiration is calculated from total cellular respiration minus non-mitochondrial respiration. (L) ATP production is calculated from basal mitochondrial respiration minus respiration after oligomycin injection. (M) Maximal respiration is measured after FCCP injection. See accompanying Suppl. Figure S9 for other respiration parameters. (N-P) Glycolysis stress test in Seahorse analyzer. NRC grown on Seahorse 96 well plates were analyzed at day 8 after 5 days of treatment. (N) Glycolysis was measured as a function of extracellular acidification rate (ECAR) after injection of glucose 10 mM. (O) Glycolytic capacity as the maximum ECAR following injection of oligomycin. (P) Glycolytic reserve as the difference between glycolysis and maximal glycolytic capacity. Throughout the figure the data are expressed as mean fold change (FC) ± SEM over the control group, except when indicated. Statistical analysis: a two-way factorial ANOVA for independent samples was used for panels A to J. ¶ and § symbols as indicated in the panels; i p≤0.05, ii p≤ 0.01, iii p≤0.001 for the interaction effect. One-Way ANOVA was used for panels K-P: ¶ p< 0.05, ¶¶ p< 0.01, ¶¶¶ p< 0.001. Tukey test: *, p< 0.05, ** p< 0.01, *** p< 0.001 between any group versus NT control cells; ## p< 0.01, ### p< 0.001 for indicated comparisons.
Figure 5.
Figure 5.. SRF is a component of Nmrk2 gene transcription
(A) CArG-like binding site for SRF in the conserved region between the murine (M.m) Nmrk2 promoter and human (H.s) NMRK2 intron 1. The CArG-like motif was mutated to a CArG consensus sequence (cons) and a CArG mutant (mut) site unable to bind SRF. (B) Activity of p586-Firefly Luciferase construct bearing wild-type (WT), consensus (CONS) or mutated (Mut) CArG motif (H) or longer fragments (I), without (NT) or with FK866 treatment (10 μM). SV40-renilla luciferase was co-transfected with the Nmrk2-Firefly Luc constructs for normalization of transfection efficiency. (C) Various lengths of the murine Nmrk2 regulatory region were inserted into pGL4 vector and transfected in non-treated or FK866 treated cells. (D, E) Srf and Nmrk2 mRNA levels in NRC transfected with control scrambled siRNA (siScr) or Srf si-RNA, without (NT) or with FK866 treatment. (F, G) ATP levels in cells treated for 72h with FK866 (F) or siCkm (G). (H) Srf, Ckm and Nmrk2 mRNA level in NRCs transfected for 72h with siRNAs as indicated. Throughout the figure, data are expressed as mean ± SEM over control group, Fc, fold change over control group except for panel B and C, fold change over promoterless pGL4 plasmid and H FC over siCtneg. Two-way factorial ANOVA for independent factors was used for panels B to E. ¶ and § symbols as indicated in the panels; iii p≤0.001 for the interaction effect. A T-test was used for panels F and G; * p< 0.05, ** p< 0.01,between FK treated cells or siCkm transfected cells versus control cells or siCtneg transfected cells, respectively. A one-way ANOVA was used in panel H. §§§ p≤ 0.001. Post-hoc Tukey test: ** p< 0.01, between any group versus siCtneg transfected control cells.
Figure 6.
Figure 6.. Nmrk2 expression is increased by AMPK and PPARα pathways
(A) Representative western blot analysis of cardiac proteins in control and SRFHKO mice at D9 using antibodies directed against ACC, phospho-ACC (Ser79), AMPKα and phospho-AMPKα (Thr172). Phosphorylated and total proteins were analyzed on 2 separate gels (gel 1 and 2) and GAPDH antibody was used for loading control. (B) Quantification of total and phospho-protein signal from western blot analyses. Data are normalized on GAPDH signal. The Phos/Total ratio is calculated from GAPDH normalized levels for each individual. N= 6 for each group. Data are expressed as mean fold change (FC) ± SEM over control group. T-test: * p≤ 0.05, ** p ≤0.01, *** p≤ 0.001 over control group. (C) NRC were treated with FK866 (10 μM, 72h), AICAR (500 μM, 48h) or grown in absence of glucose in the medium (Glc 0) for 48h and proteins were extracted for western blot analyses. Representative western blot. (D) Quantification on n=3 samples for each condition of NRC treated as in (C). Data are expressed as mean FC ± SEM over NT group. * p≤ 0.05 over control group. (E-G) Intracellular NAD+ content (E), NADH (F) and NAD+/NADH ratio (G) in NRC after 24h of treatment with AICAR [500 μM]. NT; non-treated cells. (H) RT qPCR analysis of Nmrk2 mRNA level in NRC treated with AICAR. T-test: *** p≤ 0.001 over non-treated control group. (I, J) NRC were co-transfected with Nmrk2-luciferase constructs containing 586 or 3009 base pairs of upstream Nmrk2 regulatory region and a dominant negative (DN) AMPK expression vector. NRC were transfected at D3 after plating, followed by AICAR treatment (500 μM) at D4. Luciferase levels were analyzed at D5. Normalized Fireflyl/Renilla values are expressed as in Figure 5B as FC ± SEM over the promoterless pGL4 vector. ¶¶ p≤0.01, ¶¶¶ p≤ 0.001 for treatment effect. . ** p≤ 0.01, *** p≤ 0.001 over non-treated control group. ## p< 0.01 for AICAR vs. AICAR+AMPK-DN. (K) Nmrk2 promoter deletion analysis by luciferase assay. Rectangular boxes show the position of the putative PPAR binding sites. Data are expressed as mean FC ± SEM over the promoterless pGL4 plasmid. One way ANOVA: ¶¶¶ p≤ 0.001 for promoter length effect. Post-hoc Tukey test: **p≤ 0.01, *** p≤ 0.001 over the promoter less pGL4 vector. . ## p< 0.01 for over the immediately shorter construct (L) Neonatal rat cardiac fibroblasts and cardiomyocyte-enriched fractions were separated on a discontinuous percoll gradient. Cardiac fibroblasts were transfected with the p-228, p-581 and p-3009-FLuc constructs. Cardiomyocytes were transfected with the p-3009-FLuc. SV40-RLuc construct was cotransfected for normalization. Data are expressed as mean FC ± SEM over the mean p228-FLuc activity in cardiac fibroblasts. One-way ANOVA: ¶ p≤ 0.05. Post-hoc Tukey test: * p≤ 0.05 Cardio-3009 over Fibro-30089. (M) NRC were co-transfected with the p3009-FLuc construct and the RXR expression vector and with either PPARα, PPAR β/δ or PPARγ expression vectors. NRC were treated 24h later with the agonists GW7647 [0.6 μM], GW501516 [0.6 μM], and G1929 [0.6 μM], for PPARα, PPARβ/δ and PPARγ, respectively, or with their respective antagonists, GW6471 [10 μM], GSK3787 [2 μM] or GW9662 [2 μM]. Data are expressed as mean FC ± SEM over normalized luciferase levels of NRC transfected with the p3009-FLuc construct alone (dashed line) in the same experiment. A one-way ANOVA was used since each group is independent of the other (different agonists and antagonists): ¶¶¶ p≤ 0.001. Post-hoc Tukey test: ** p≤ 0.01 versus p3009-FLuc alone. ## p≤ 0.01 for comparison between agonist and antagonist. (N) NRC were transfected with the p3009-FLuc construct. Transfected NRC were treated 24h later with the antagonists G6471, GSK3787, or G9662, 30 minutes before adding AICAR for a further 24 h period. All concentrations were as in L. Data are expressed as mean FC ± SEM over the p3009-luc construct treated with AICAR alone. One-way ANOVA: ¶ p≤ 0.05. Post-hoc Tukey: * p≤ 0.05 vs AICAR treated cells.
Figure 7.
Figure 7.. NR treatment preserves myocardial NAD levels and limits the drop in ejection fraction in the pressure overload induced hypertrophy model
2-month old Control and SRFHKO male mice were subjected to TAC or SHAM surgery and fed with control chow diet (CD) or NR enriched diet from day 2 after surgery to day 42. (A) Kaplan-Meier survival curve analysis. Log-rank statistic: p> 0.05. Color code shown on the right for each group is valid for panels A to E. (B-D) Echocardiography follow-up analysis from base line (2 days before surgery) to 6 weeks after. IVSThD, interventricular septum thickness in diastole; LVEDD, Left ventricle end-diastolic diameter; LVEF, left ventricle ejection fraction. (E) Heart weight to body weight ratio after sacrifice at 6 weeks. (F-H) Cardiac NAD+ and NADH levels and redox state assessed by the NAD+ cycling assay. (I-Q) Cardiac mRNA levels of the indicated genes assessed by RT-qPCR. Data are expressed as mean ± SEM. Statistical analysis: Two-Way ANOVA for independent factors statistical analysis is shown at 6 week and was used for panels B to Q, followed by post-hoc Tukey test. ¶¶ p≤ 0.01, ¶¶¶ p≤ 0.001 for the TAC effect; §§§ p≤ 0.001 for the NR treatment effect; i p≤0.05 for the interaction effect. Asterisks indicate statistical significant difference for the indicated comparisons: * p≤ 0.05, ** p≤ 0.01. # p≤ 0.05 for the effect of NR within the TAC group. See accompanying Table S5 for other echocardiography data at 6 weeks and previous stages.
Figure 8.
Figure 8.. Activation of the NMRK2 path to NAD+ synthesis as an adaptive energy sparing mechanism in the failing heart.
DCM is a form of pathological cardiac remodeling that is associated with severe energy depletion leading to HF. The energy stress sensor AMP-kinase is an adaptive signaling pathway aiming to preserve energy in the cells. The NAMPT enzyme is a major, rate-limiting step for NAD+ synthesis whose energetic cost equals four ATP molecules, including one converted to AMP, for the synthesis of one NAD+. NAMPT is repressed in most forms of HF through unknown regulatory mechanism. Opposite to this repression, Nmrk2 gene is an AMPK responsive gene that is activated in several models of DCM and other forms of pathological remodeling such as the pressure-overload cardiac hypertrophy. NMR-Kinase 2 allows the synthesis of NAD+ at a lower cost of 2 ATP per molecule. Although NR content may be limited in rodent and human diet, NR can easily be provided as a nutraceutical to help the failing heart to maintain NAD+ levels.

Comment in

References

    1. Ventura-Clapier R, Garnier A, Veksler V and Joubert F. Bioenergetics of the failing heart. Biochim Biophys Acta. 2011;1813:1360–72. - PubMed
    1. Des Rosiers C, Labarthe F, Lloyd SG and Chatham JC. Cardiac anaplerosis in health and disease: food for thought. Cardiovascular research. 2011;90:210–219. - PMC - PubMed
    1. Mericskay M Nicotinamide adenine dinucleotide homeostasis and signalling in heart disease: Pathophysiological implications and therapeutic potential. Arch Cardiovasc Dis. 2016;109:207–15. - PubMed
    1. Lee CF and Tian R. Mitochondrion as a Target for Heart Failure Therapy- Role of Protein Lysine Acetylation. Circulation journal : official journal of the Japanese Circulation Society. 2015;79:1863–70. - PubMed
    1. Belenky P, Bogan KL and Brenner C. NAD+ metabolism in health and disease. Trends Biochem Sci. 2007;32:12–9. - PubMed

Publication types

MeSH terms