. 2018 Jan;29(1):138-154.
doi: 10.1681/ASN.2017030270. Epub 2017 Dec 7.

Opposing Roles of Dendritic Cell Subsets in Experimental GN

Affiliations

Opposing Roles of Dendritic Cell Subsets in Experimental GN

Sebastian Brähler et al. J Am Soc Nephrol. 2018 Jan.

Abstract

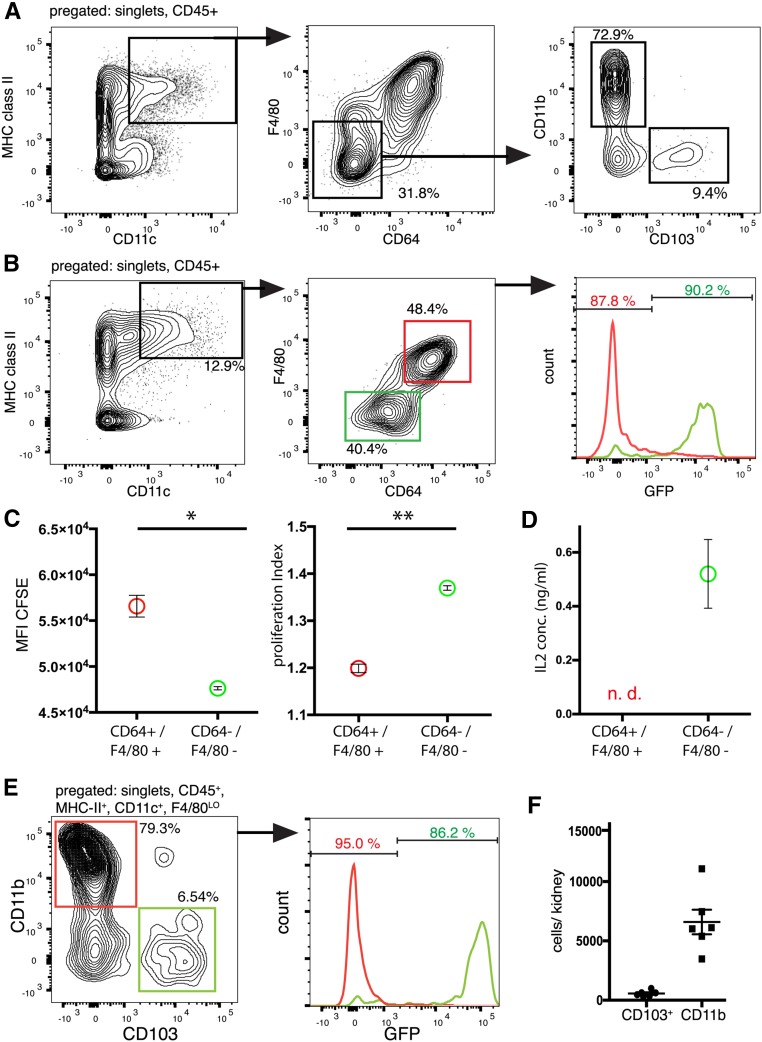
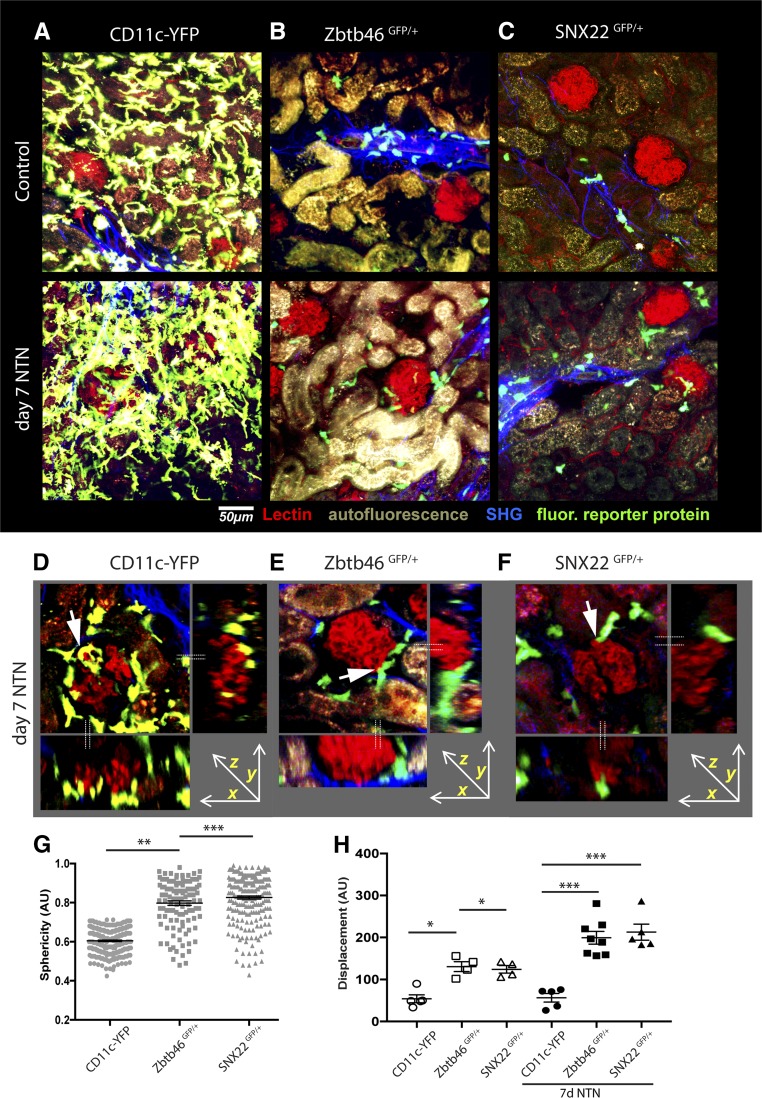
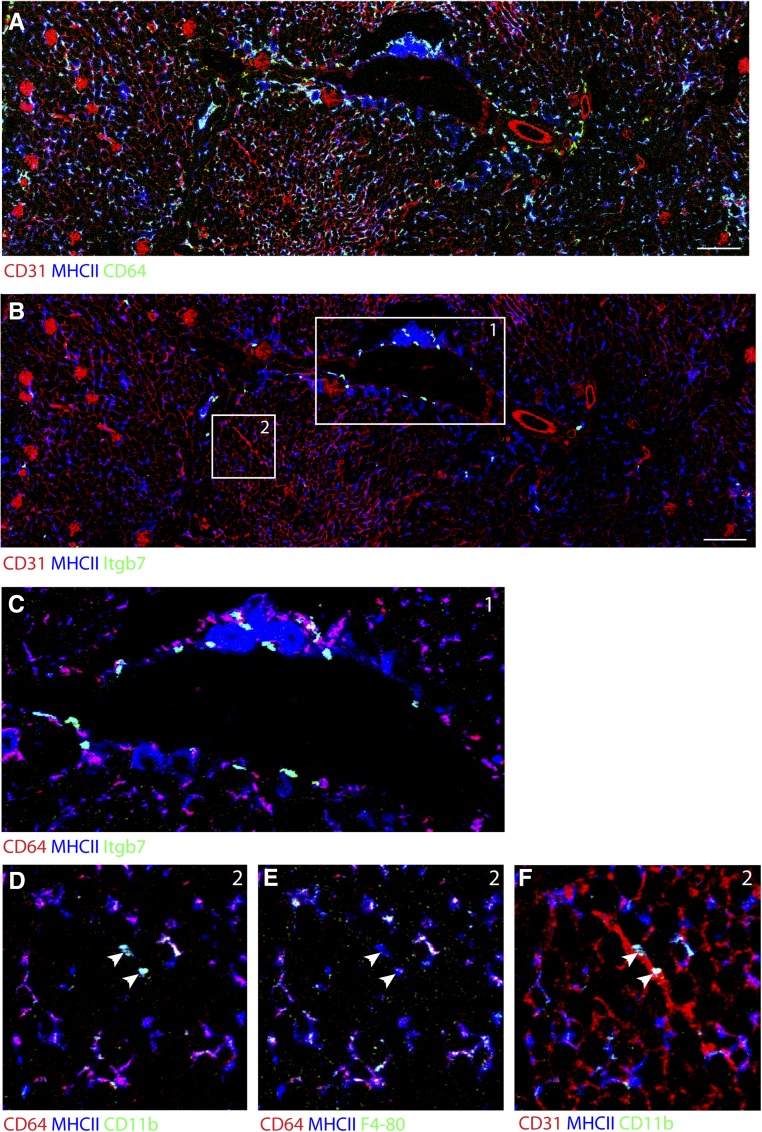
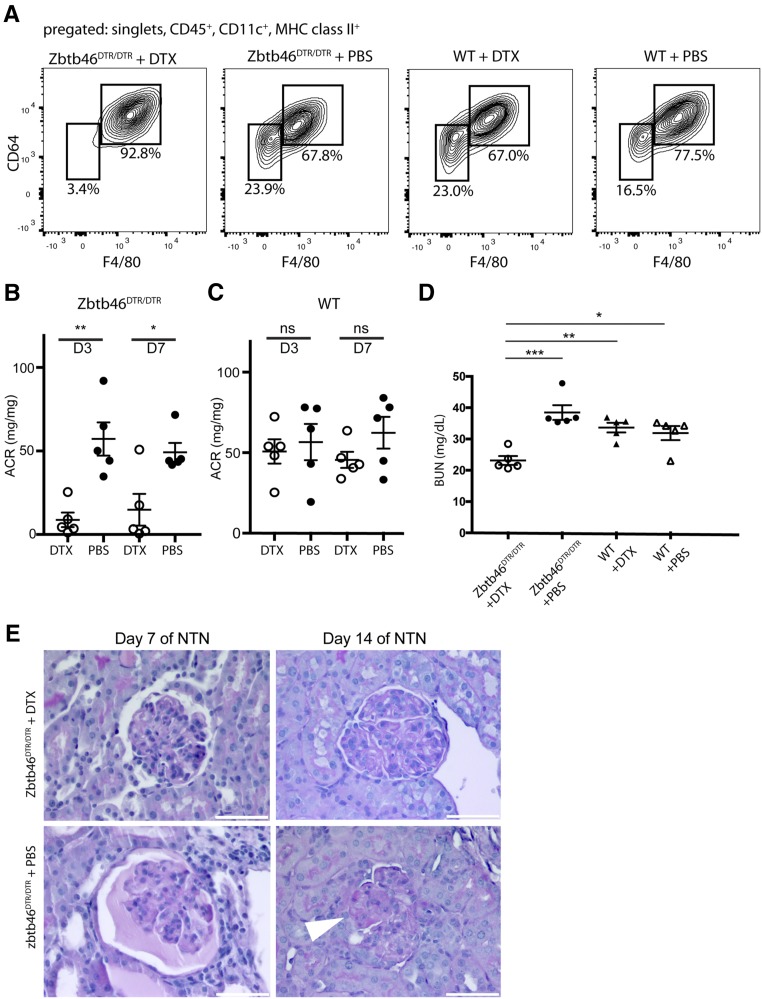
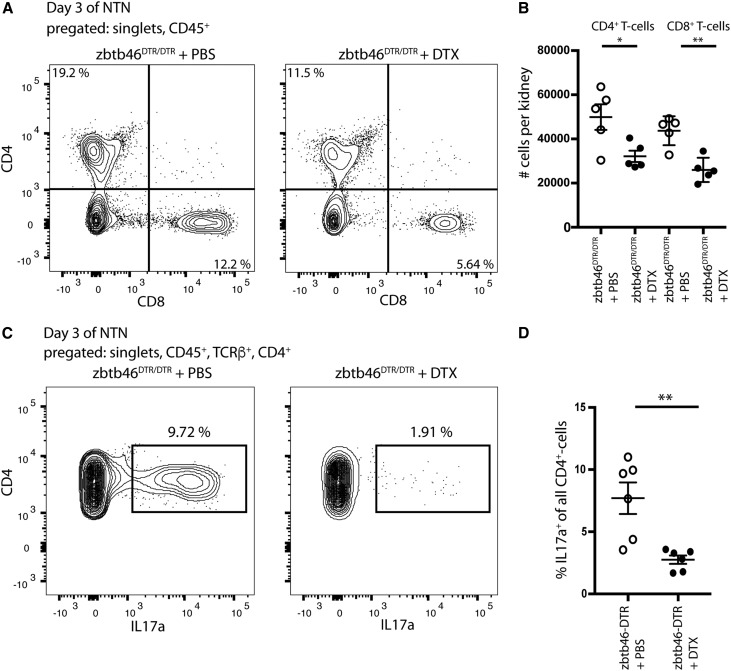
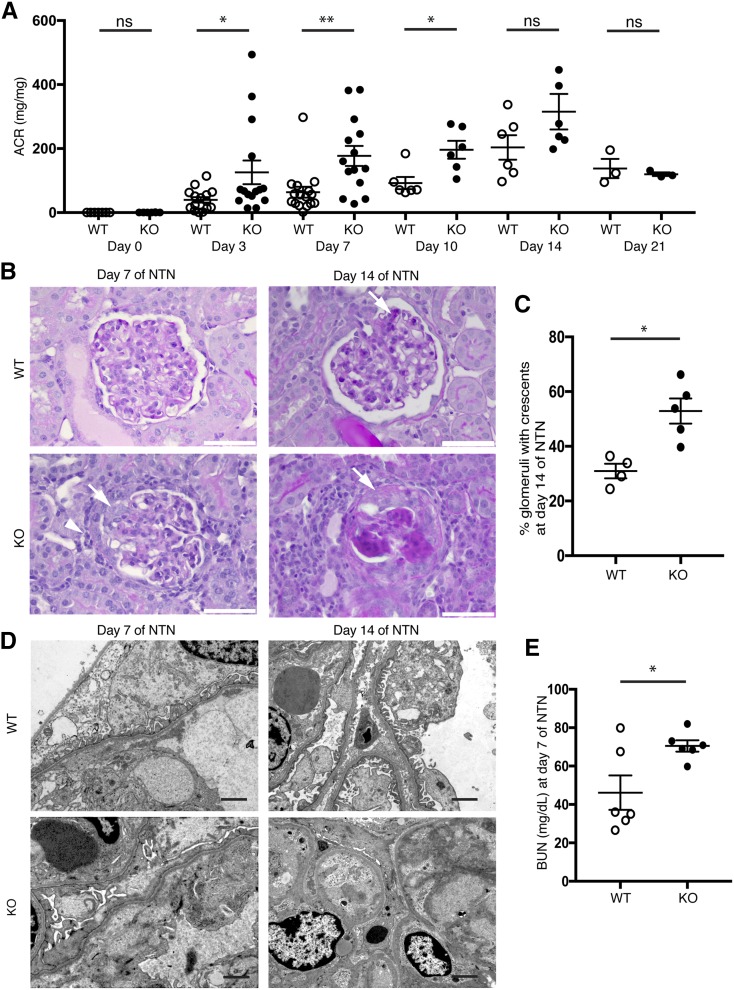
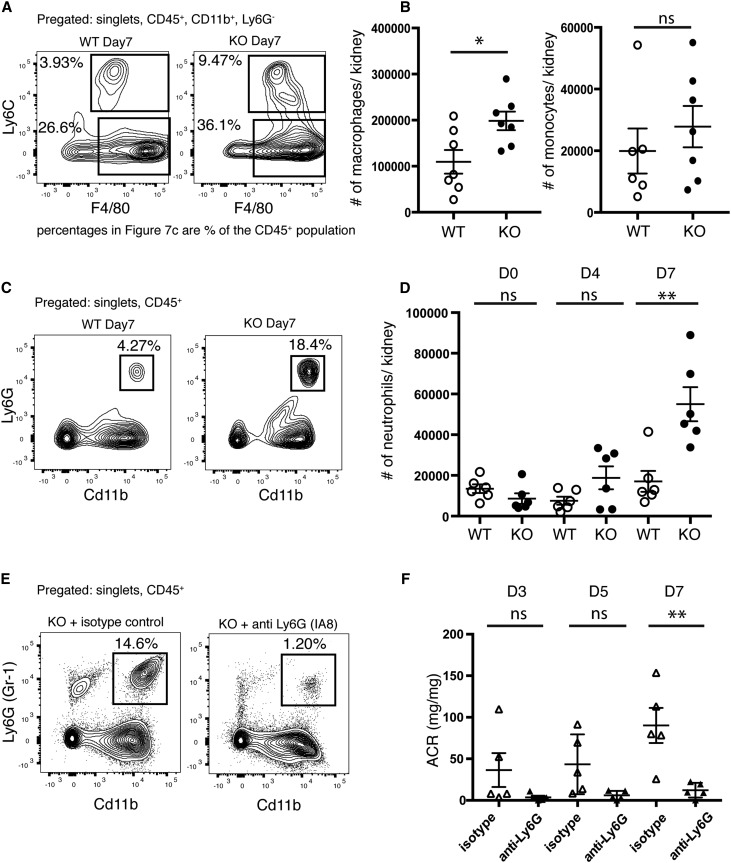
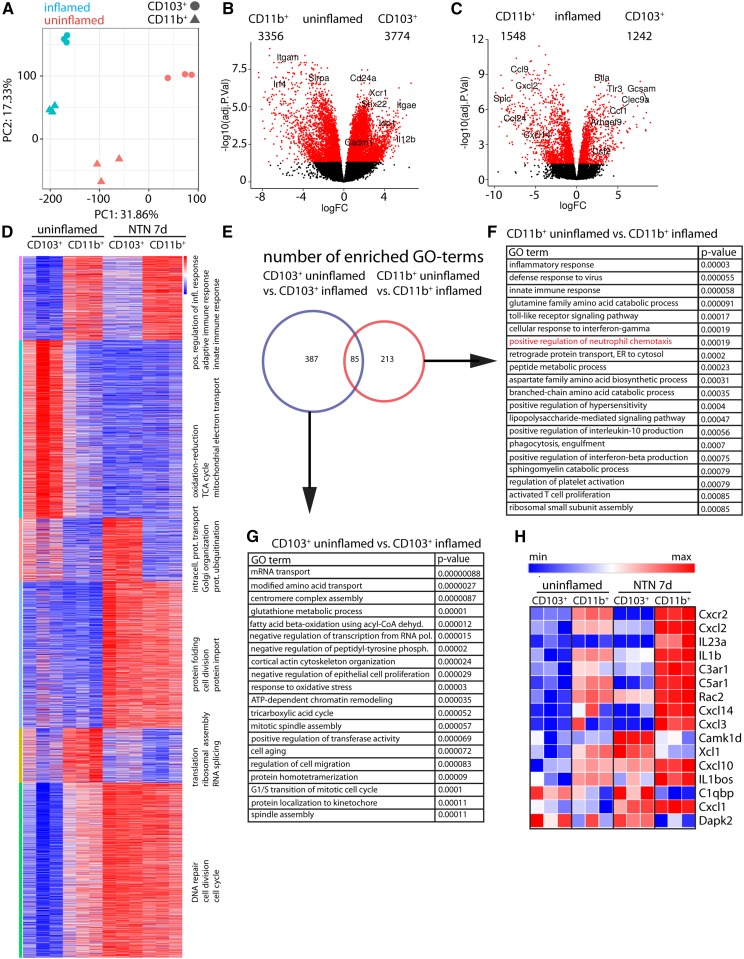
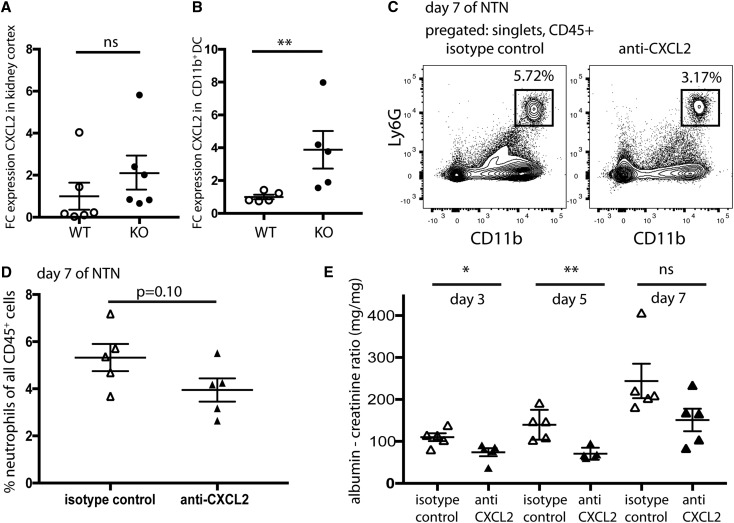
Dendritic cells (DCs) are thought to form a dendritic network across barrier surfaces and throughout organs, including the kidney, to perform an important sentinel function. However, previous studies of DC function used markers, such as CD11c or CX3CR1, that are not unique to DCs. Here, we evaluated the role of DCs in renal inflammation using a CD11c reporter mouse line and two mouse lines with DC-specific reporters, Zbtb46-GFP and Snx22-GFP. Multiphoton microscopy of kidney sections confirmed that most of the dendritically shaped CD11c+ cells forming a network throughout the renal interstitium expressed macrophage-specific markers. In contrast, DCs marked by Zbtb46-GFP or Snx22-GFP were less abundant, concentrated around blood vessels, and round in shape. We confirmed this pattern of localization using imaging mass cytometry. Motility measurements showed that resident macrophages were sessile, whereas DCs were motile before and after inflammation. Although uninflamed glomeruli rarely contained DCs, injury with nephrotoxic antibodies resulted in accumulation of ZBTB46 + cells in the periglomerular region. ZBTB46 identifies all classic DCs, which can be categorized into two functional subsets that express either CD103 or CD11b. Depletion of ZBTB46 + cells attenuated the antibody-induced kidney injury, whereas deficiency of the CD103+ subset accelerated injury through a mechanism that involved increased neutrophil infiltration. RNA sequencing 7 days after nephrotoxic antibody injection showed that CD11b+ DCs expressed the neutrophil-attracting cytokine CXCL2, whereas CD103+ DCs expressed high levels of several anti-inflammatory genes. These results provide new insights into the distinct functions of the two major DC subsets in glomerular inflammation.

Keywords: glomerular disease; glomerulonephritis; immunology.


Figures

Figure 1.
Figure 1.
Flow cytometry analysis of fluorescent reporter lines reveals distinct populations in the kidney. (A) Gating strategy for renal CD11b+ and CD103+ populations of cDCs. CD45+ singlet cells from whole kidney were analyzed as indicated. MHC class II+/CD11c+ with low expression of CD64 and F4/80 were regarded as cDCs and further separated by expression of CD103 and CD11b. (B) Kidney cells from Zbtb46GFP/+ mice were analyzed for the expression of the indicated markers. Histograms for GFP expression for the F4/80/CD64 (green) and F4/80+/CD64+ (red) populations were overlaid. The majority of F4/80/CD64 cells were GFP+. (C) In vitro T cell proliferation assay. CFSE-loaded OT-II cells were cocultured with sorted CD45+, MHC class II+, and CD11c+ kidney cells that were either F4/80/CD64 or F4/80+/CD64+ and loaded with OVA. Depicted are the CFSE geometric mean fluorescence intensity (MFI) and the proliferation index of T cells after 72 hours. *P<0.05; **P<0.01. (D) The undiluted supernatant of the same cells was analyzed for IL-2 by ELISA, and the experiment was performed in duplicates. n.d., not detected. (E) Kidney cells from Snx22GFP/+ mice were pregated as indicated above the diagram, and histograms for GFP expression for the CD11b+ and CD103+ populations were overlaid (y axes for the two histograms have different scales), which show that the Snx22GFP/+ mouse is a specific reporter for CD103+ cDCs in the kidney. (F) Absolute quantification of CD11b+ and CD103+ DCs per mouse kidney under healthy conditions.
Figure 2.
Figure 2.
Multiphoton imaging of kidney DCs in different reporter mice reveals disparities in cell localization, structure, and motility. (A–C) Multiphoton imaging of kidney slices from bone- marrow chimeras generated by transferring bone marrow from Cd11c-YFP+, Zbtb46GFP/+, or Snx22GFP/+ donors into lethally irradiated mice was used to show localization and structure of DC populations in the steady state and on day 7 of NTN. Capillaries are depicted in red, YFP or GFP appears in green, collagen fibers are in blue (second harmonic signal), and the tubules autofluoresce. Although CD11c-YFP+ cells show a continuous network throughout the kidney, ZBTB46-GFP+ and SNX22-GFP+ cells were sparsely localized in the interstitium and in clusters in collagen-rich areas and close to larger blood vessels. ZBTB46- and SNX22-GFP cells were attracted to the periglomerular regions in the inflamed state. (D–F) Z-stack reconstructions of glomeruli and side views from CD11c-YFP, Zbtb46GFP/+, or SNX22GFP/+ bone marrow chimeras. The dotted lines represent the optical planes in the side views. Although the glomerular tuft itself was mostly free of DCs, their processes were observed to be in close proximity to the glomeruli (arrows). (G) Analysis of sphericity in Z-stack reconstructions from at least three individual mice per group reveals that the majority of ZBTB46-GFP+ and SNX22-GFP+ cells have a spherical shape in comparison with the majority of CD11c-YFP+ cells. (H) Analysis of cell motility in the uninflamed and inflamed states by analysis of fluorescence intensity changes (displacement) of Z stacks acquired every 30 seconds for 15 minutes in kidney organ slices. Zbtb46-GFP and Snx22-GFP cells showed a higher average motility at baseline and increased motility with NTN in comparison with CD11c-YFP cells, which remained stationary. Each dot represents an individual time-lapse image, and for each group, movies from at least three individual mice were analyzed. *P<0.05 as determined by one-way ANOVA with Tukey post-test; **P<0.01 as determined by one-way ANOVA with Tukey post-test; ***P<0.001 as determined by one-way ANOVA with Tukey post-test.
Figure 3.
Figure 3.
Imaging mass cytometry confirms shape and localization of macrophages and DCs in WT, nonirradiated tissue. (A) A kidney section was stained with rare earth metal–labeled antibodies and laser ablated with a resolution of 1×1 μm. The image shows expression of MHC class II, CD64, and CD31 (as markers for blood vessels in a cortex and medulla). (B) The same section was analyzed for integrin-β7 (Itgβ7), which reveals the localization of CD103+ DCs around larger blood vessels predominantly at the cortex-medulla border. Scale bar, 200 μm in A and B. (C) Magnification of area 1 shows the perivascular localization of CD103+ DCs in detail. (D–F) Magnification of area 2 shows macrophages and CD11b+ DCs. Coexpression of CD64 and F4/80 in dendritic-shaped MHC class II+ cells in the tissue represents macrophages. A smaller population of MHC class II+, CD11b+, CD64, and F4/80 cells that are round in shape and most likely represent CD11b+ DCs in the tissue (arrowheads) was found (E) in the interstitium and (F) in close proximity to smaller blood vessels.
Figure 4.
Figure 4.
Depletion of ZBTB46+ DCs ameliorates the course of GN in mice. (A) FACS analysis of kidney cells from Zbtb46DTR/DTR and WT bone marrow chimeras treated with DTX or PBS. Loss of cells expressing Zbtb46 selectively depletes the F4/80LO/CD64LO cDC population. Mice were euthanized on day 14 of NTN. (B and C) Urinary albumin-to-creatinine ratios (ACRs) of (B) NTS-injected Zbtb46DTR/DTR or (C) WT bone marrow chimeras treated with DTX or PBS. (D) BUN levels in cDC-depleted and control mice on day 14 of NTN. (E) Periodic acid–Schiff staining shows a reduction of glomerular damage in cDC-depleted mice versus controls on days 7 and 14 of NTN (arrowhead points at adhesion). *P<0.05 determined by t test in B and C and one-way ANOVA with Tukey post-test in D; **P<0.01 determined by t test in B and C and one-way ANOVA with Tukey post-test in D; ***P<0.01 determined by one-way ANOVA with Tukey post-test in D.
Figure 5.
Figure 5.
Depletion of ZBTB46+ DCs leads to a reduction of CD4+ and CD8+ T cells and percentage of IL-17–producing T-helper cells. (A) FACS analysis of kidney cells from Zbtb46DTR/DTR bone marrow chimeras on day 3 of NTN reveals reduction in CD4+ and CD8+ T lymphocytes when treated with DTX. (B) Quantification of absolute CD4+ and CD8+ T cell numbers per kidney on day 3 of NTN (n=5 per group). (C) Kidney cells from Zbtb46DTR/DTR bone marrow chimeras (day 3 of NTN) treated with DTX or PBS were isolated and cultured with PMA/Ionomycin + Brefeldin for 4 hours, and then, they were stained for intracellular IL-17. (D) Quantification of the percentage of IL-17–producing CD4+ T cells on day 3 of NTN shows a reduction in cDC-depleted mice. *P<0.05 determined by t test; **P<0.01 determined by t test.
Figure 6.
Figure 6.
The absence of CD103+ DCs in Batf3-KO mice aggravates proteinuria and promotes crescent formation in NTN. (A) Urinary albumin-to-creatinine ratios (ACRs) in Batf3-KO and WT mice at baseline and after injection of NTS. (B) As shown by Periodic acid–Schiff staining on day 7 of NTN, KO mice presented with more periglomerular infiltrating cells (arrowhead) and adhesions (arrow) of the glomerular tuft. On day 14, WT mice showed minor scarring (arrow), whereas KO mice showed prominent glomerulosclerosis with crescents (arrow). (C) Quantification of crescentic glomeruli in WT and Batf3-KO mice on day 14 of NTN. (D) Batf3-KO mice showed more severe foot process effacement on day 7 of NTN. By day 14, WT mice had largely regained their normal foot processes, whereas glomeruli from KO mice showed severe scarring with obliterated capillary lumens. (E) BUN levels (milligrams per deciliter) in WT and KO mice on day 7 of NTN. *P<0.05 determined by t test; **P<0.01 determined by t test.
Figure 7.
Figure 7.
Neutrophil infiltration into the kidney is pathogenic in Batf3-KO mice. (A) FACS plots for macrophages (CD45+, CD11b+, F4/80HI, and Ly6CLO) and monocytes (CD45+, CD11b+, F4/80INT, and Ly6CHI) in WT and Batf3-KO kidneys on day 7 of NTN. Shown are the percentages of the CD45+ population. (B) Quantification of absolute macrophage and monocyte numbers per kidney on the basis of the gating strategy shown in A on day 7. (C) FACS analysis for infiltrating neutrophils (CD45+, CD11b+, and Ly6G+) in WT and Batf3-KO kidneys on day 7 of NTN shows the percentages of the CD45+ parental population. (D) Quantification of total neutrophil numbers in kidneys of WT and KO mice through day 7 of NTN on the basis of the gating strategy shown in C. (E) Representative FACS plots for neutrophils (CD45+, CD11b+, and Gr-1+) from a Batf3-KO mouse and a WT mouse on day 7 of NTN treated with a neutrophil-depleting antibody (anti-Ly6G, clone 1A8) or isotype control. (F) Urinary albumin-to-creatinine ratios (ACRs) from Batf3-KO mice treated with the neutrophil-depleting antibody or isotype control on days 3, 5, and 7 of NTN. *P<0.05 determined by t test; **P<0.01 determined by t test.
Figure 8.
Figure 8.
CD11b+ and CD103+ DCs show a unique transcriptional signature. (A) Principal component analysis of the 12 datasets shows clustering into the experimental groups. (B) Volcano plot comparison of differential gene expression in CD103+ versus CD11b+ DCs in the steady state. Red dots highlight differentially expressed genes with an FDR-adjusted P value of >0.05. Numbers of significantly enriched genes per subset are depicted. (C) Volcano plot comparison of differential gene expression in CD103+ versus CD11b+ DCs on day 7 of NTN. Red dots highlight differentially expressed genes with an FDR-adjusted P value of <0.05. (D) Six differentially expressed clusters were identified by k-means clustering of the 8000 highest expressed genes using one minus Pearson correlation coefficient as the dissimilarity measure. The top three GO terms (biologic function) for each cluster are depicted on the right of each cluster. (E) Venn diagram of the significantly enriched GO terms for biologic processes in uninflamed versus inflamed CD103+ cDCs (blue) and uninflamed versus inflamed CD11b+ cDCs (red). (F) List of the top 20 significantly enriched GO terms in the comparison of CD11b+ DCs in the uninflamed state with those in the inflamed state. (G) List of the top 20 significantly enriched GO terms in the comparison of CD103+ DCs in the uninflamed state with those in the inflamed state. (H) Heat map of genes contained in GO term 0090023 (positive regulation of neutrophil chemotaxis) in all datasets.
Figure 9.
Figure 9.
CXCL2 is upregulated in CD11b+ cDCs, and neutralization of CXCL2 ameliorates the course of NTN in Batf3-KO mice. (A) qPCR on cDNA from whole-kidney cortex of Batf3-KO and WT mice. Shown is the fold change difference in comparison with the mean expression in the WT control; each dot represents an individual animal. (B) qPCR on cDNA from FACS-sorted CD11b+ cDCs from Batf3-KO and WT mice. Shown is the fold change difference in comparison with the mean expression in the WT control; each dot represents an individual animal. *P<0.01 determined by a Mann–Whitney U test. (C) Representative FACS analyses of neutrophils in Batf3-KO mice treated with either anti-CXCL2 antibody or isotype control; cells were isolated on day 7 of NTN. (D) Percentage of neutrophils (gated as CD11b+ and Ly6G+) of all CD45+ immune cells on day 7 of NTN in the kidneys of anti-CXCL2 or isotype control–treated Batf3-KO mice. (E) Urinary albumin-to-creatinine ratios in anti-CXCL2 or isotype-matched IgG-treated Batf3-KO mice. Depicted are days 3, 5, and 7 after injection of the NTS. *P<0.05 determined by t test; **P<0.01 determined by t test.

Comment in

  • Renal Dendritic Cells: The Long and Winding Road.
    Kitching AR, Ooi JD. Kitching AR, et al. J Am Soc Nephrol. 2018 Jan;29(1):4-7. doi: 10.1681/ASN.2017101145. Epub 2017 Dec 11. J Am Soc Nephrol. 2018. PMID: 29229765 Free PMC article. No abstract available.

References

    1. Steinman RM, Cohn ZA: Identification of a novel cell type in peripheral lymphoid organs of mice. I. Morphology, quantitation, tissue distribution. J Exp Med 137: 1142–1162, 1973 - PMC - PubMed
    1. Nussenzweig MC, Steinman RM, Gutchinov B, Cohn ZA: Dendritic cells are accessory cells for the development of anti-trinitrophenyl cytotoxic T lymphocytes. J Exp Med 152: 1070–1084, 1980 - PMC - PubMed
    1. Durai V, Murphy KM: Functions of murine dendritic cells. Immunity 45: 719–736, 2016 - PMC - PubMed
    1. Niess JH, Brand S, Gu X, Landsman L, Jung S, McCormick BA, Vyas JM, Boes M, Ploegh HL, Fox JG, Littman DR, Reinecker H-C: CX3CR1-mediated dendritic cell access to the intestinal lumen and bacterial clearance. Science 307: 254–258, 2005 - PubMed
    1. Guilliams M, Ginhoux F, Jakubzick C, Naik SH, Onai N, Schraml BU, Segura E, Tussiwand R, Yona S: Dendritic cells, monocytes and macrophages: A unified nomenclature based on ontogeny. Nat Rev Immunol 14: 571–578, 2014 - PMC - PubMed

Publication types

MeSH terms