

The cytoskeleton protein β-actin may mediate T cell apoptosis during acute rejection reaction after liver transplantation in a rat model
- PMID: 29218087
- PMCID: PMC5714773
The cytoskeleton protein β-actin may mediate T cell apoptosis during acute rejection reaction after liver transplantation in a rat model
Abstract
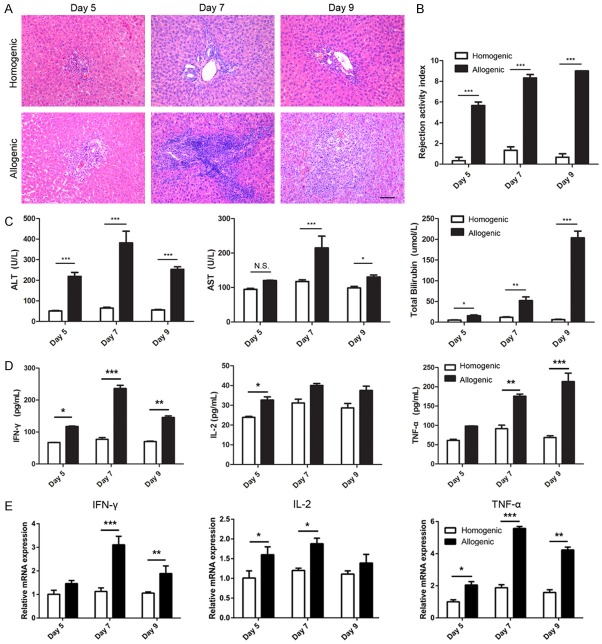
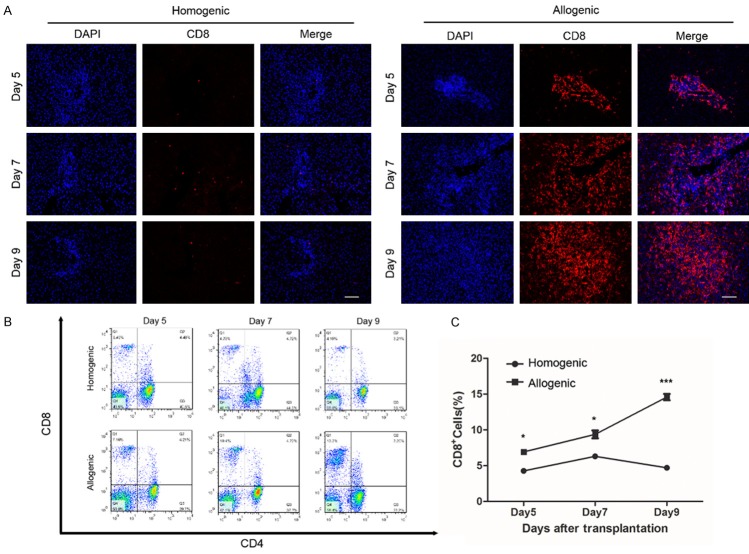
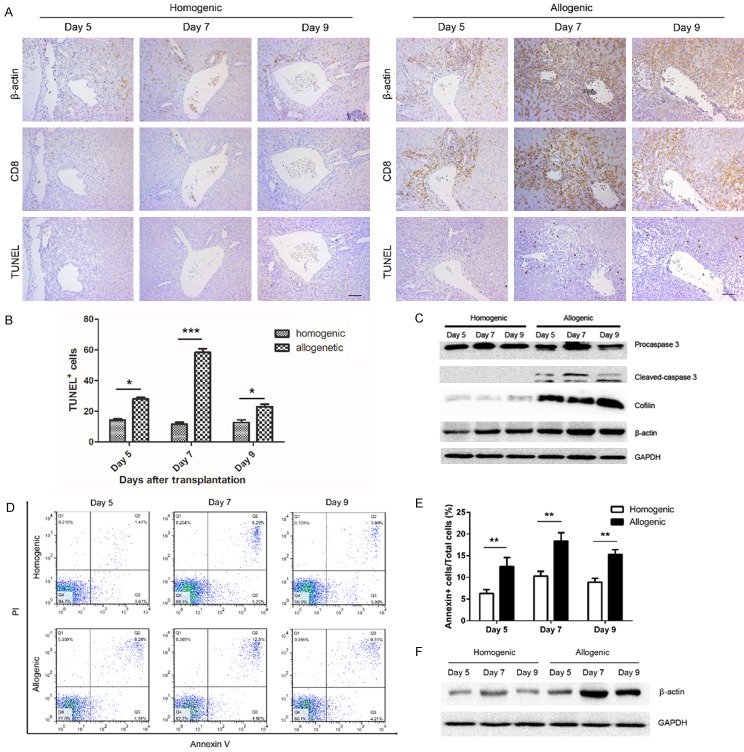
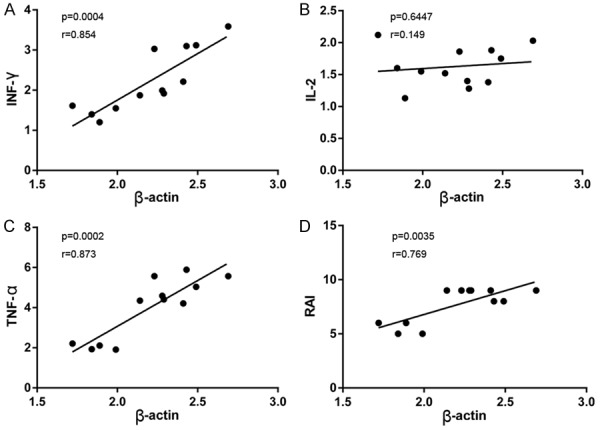
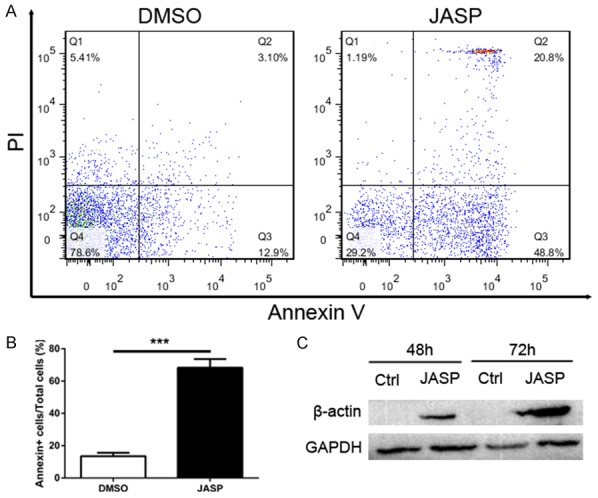
Cytoskeletal proteins and associated regulatory proteins are essential for maintaining cell structure and growth. β-actin is a major component of the cytoskeleton, and β-actin remodeling is involved in lymphocyte migration, infiltration and apoptosis. However, little is known about whether changes in β-actin expression affect lymphocyte cell fate, particularly during acute rejection after liver transplantation in a rat model. In our studies, grafts were harvested on days 5, 7 or 9 after xenogeneic rat liver transplantation. The acute rejection grade was histopathologically evaluated. Recipient-derived CD8+ T lymphocytes gradually infiltrated into liver allografts in cases of severe acute rejection. The apoptotic rate of CD8+ T lymphocytes peaked on day 7 and then decreased. Moreover, changes in β-actin expression were consistent with the apoptotic rate of CD8+ T lymphocytes in both allografts and peripheral blood based on western blotting and immunohistochemistry results. Additionally, jasplakinolide (an actin-stabilizing drug) evoked CD8+ T lymphocyte apoptosis. In conclusion, our study is the first to describe the fluctuating expression levels and dynamics of the cytoskeletal protein β-actin and its potential roles in the pathogenesis of acute rejection following rat liver transplantion. Our results enhance the understanding of the roles of CD8+ T lymphocytes during acute rejection and suggest that β-actin regulation leads to apoptosis.
Keywords: Acute rejection; CD8+ T lymphocyte; liver transplantation; β-actin.
Conflict of interest statement
None.
Figures

Similar articles
-
Apoptosis in acute rejection of hamster-to-rat liver transplantation.Hepatobiliary Pancreat Dis Int. 2002 Aug;1(3):340-4. Hepatobiliary Pancreat Dis Int. 2002. PMID: 14607704
-
Peripheral blood and intrahepatic subsets of T lymphocyte activation and function in liver allograft rejection and drug-induced tolerance in rats.Transpl Immunol. 1996 Jun;4(2):126-32. doi: 10.1016/s0966-3274(96)80006-2. Transpl Immunol. 1996. PMID: 8843589
-
Effect of liver transplantation on islet allografts: up-regulation of Fas ligand and apoptosis of T lymphocytes are associated with islet graft tolerance.Transplantation. 2001 Jan 15;71(1):102-11. doi: 10.1097/00007890-200101150-00017. Transplantation. 2001. PMID: 11211174
-
Unusual patterns of alloimmunity evoked by allogeneic liver parenchymal cells.Immunol Rev. 2000 Apr;174:260-79. doi: 10.1034/j.1600-0528.2002.017409.x. Immunol Rev. 2000. PMID: 10807522 Review.
-
Soluble HLA class I molecules/CD8 ligation trigger apoptosis of CD8+ cells by Fas/Fas-ligand interaction.ScientificWorldJournal. 2002 Feb 12;2:421-3. doi: 10.1100/tsw.2002.122. ScientificWorldJournal. 2002. PMID: 12806026 Free PMC article. Review.
Cited by
-
14-3-3ζ: an optimal housekeeping protein for western blot analysis in swine rotator cuff tendon studies.Mol Cell Biochem. 2025 Jul;480(7):4355-4363. doi: 10.1007/s11010-025-05255-6. Epub 2025 Mar 23. Mol Cell Biochem. 2025. PMID: 40121578 Free PMC article.
-
β-Actin: Not a Suitable Internal Control of Hepatic Fibrosis Caused by Schistosoma japonicum.Front Microbiol. 2019 Jan 31;10:66. doi: 10.3389/fmicb.2019.00066. eCollection 2019. Front Microbiol. 2019. PMID: 30766520 Free PMC article.
-
Multiplex Immunofluorescence for Detection of Spatial Distributions of Infiltrating T Cells Within Different Regions of Hepatic Lobules During Liver Transplantation Rejection.Inflammation. 2022 Apr;45(2):651-664. doi: 10.1007/s10753-021-01574-0. Epub 2021 Oct 27. Inflammation. 2022. PMID: 34705187
-
JNK signaling mediates acute rejection via activating autophagy of CD8+ T cells after liver transplantation in rats.Front Immunol. 2024 Mar 18;15:1359859. doi: 10.3389/fimmu.2024.1359859. eCollection 2024. Front Immunol. 2024. PMID: 38562941 Free PMC article.
References
-
- Dutkowski P, Linecker M, DeOliveira ML, Mullhaupt B, Clavien PA. Challenges to liver transplantation and strategies to improve outcomes. Gastroenterology. 2015;148:307–323. - PubMed
-
- Geissler EK, Schlitt HJ. Immunosuppression for liver trnsplantation. Gut. 2009;58:452–463. - PubMed
-
- O’Grady J. Timing and benefit of liver transplantation in acute liverfailure. J Hepatol. 2014;60:663–670. - PubMed
-
- Neil DA, Hubscher SG. Current views on rejection pathology in liver transplatation. Transpl Int. 2010;23:971–983. - PubMed
LinkOut - more resources
Full Text Sources
Research Materials