. 2017 Jan;9(1):20160001.
doi: 10.1515/scid-2016-0001. Epub 2017 Jun 6.

Basis and Statistical Design of the Passive HIV-1 Antibody Mediated Prevention (AMP) Test-of-Concept Efficacy Trials

Affiliations

Basis and Statistical Design of the Passive HIV-1 Antibody Mediated Prevention (AMP) Test-of-Concept Efficacy Trials

Peter B Gilbert et al. Stat Commun Infect Dis. 2017 Jan.

Abstract

Background: Anti-HIV-1 broadly neutralizing antibodies (bnAbs) have been developed as potential agents for prevention of HIV-1 infection. The HIV Vaccine Trials Network and the HIV Prevention Trials Network are conducting the Antibody Mediated Prevention (AMP) trials to assess whether, and how, intravenous infusion of the anti-CD4 binding site bnAb, VRC01, prevents HIV-1 infection. These are the first test-of-concept studies to assess HIV-1 bnAb prevention efficacy in humans.

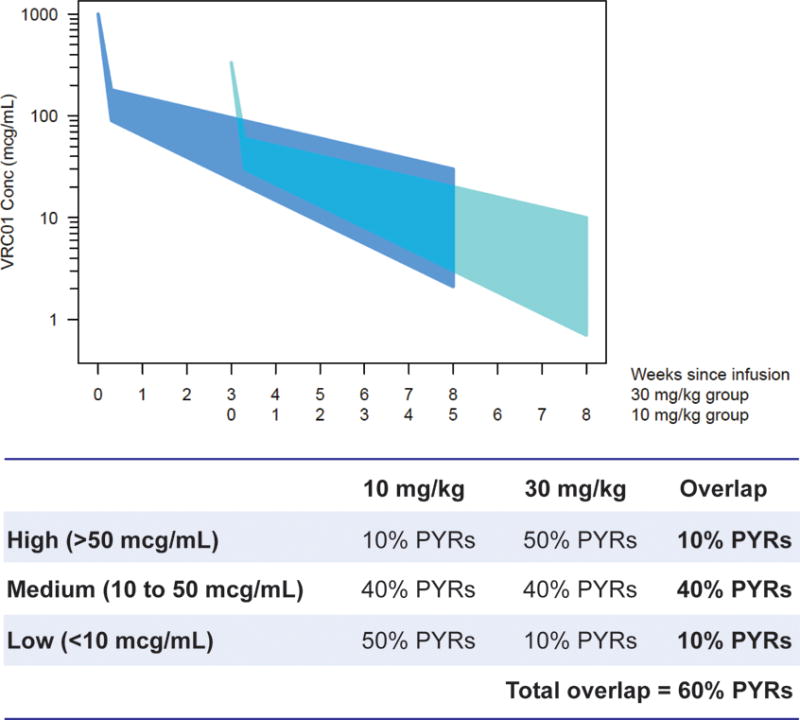
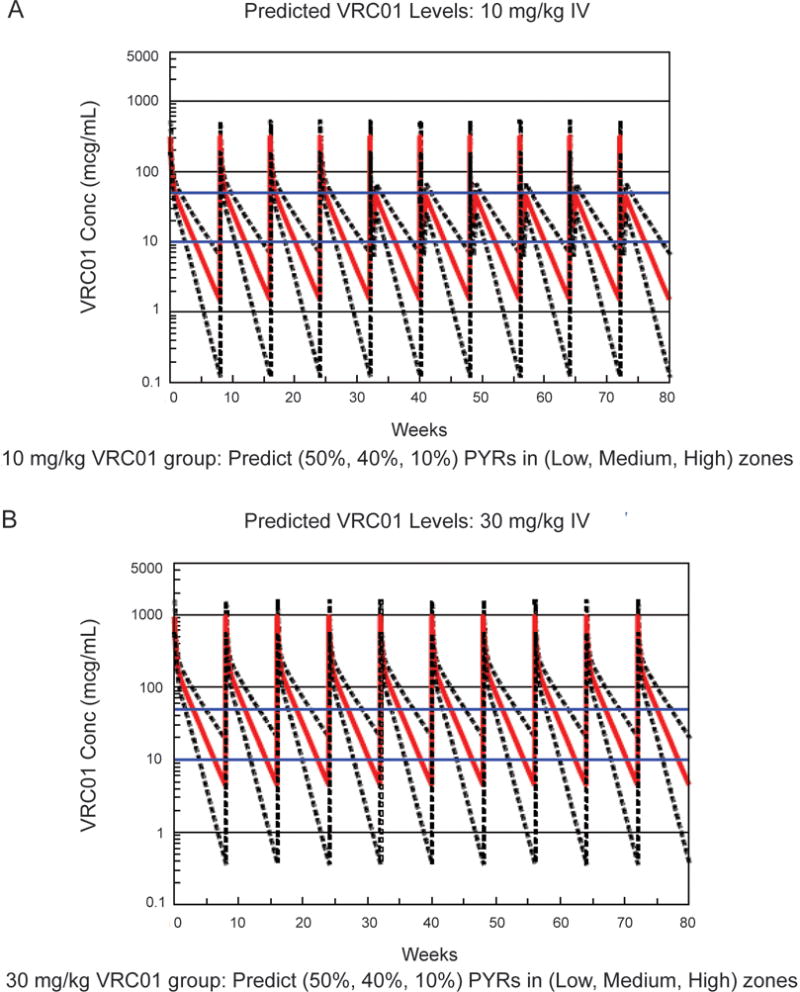
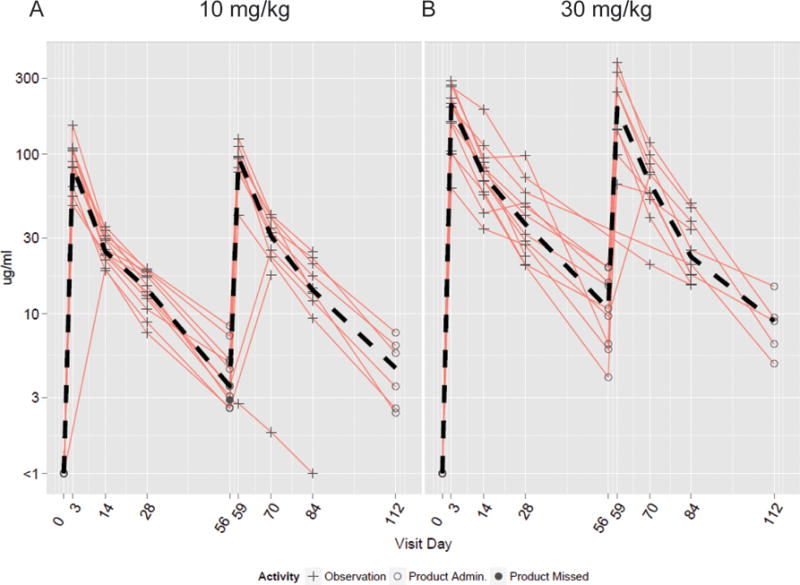
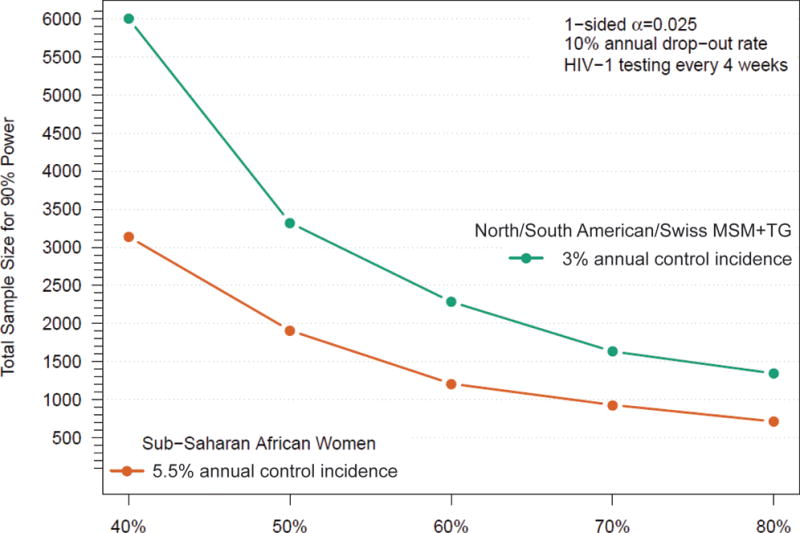
Methods: The AMP trials are two parallel phase 2b HIV-1 prevention efficacy trials conducted in two cohorts: 2700 HIV-uninfected men and transgender persons who have sex with men in the United States, Peru, Brazil, and Switzerland; and 1500 HIV-uninfected sexually active women in seven countries in sub-Saharan Africa. Participants are randomized 1:1:1 to receive an intravenous infusion of 10 mg/kg VRC01, 30 mg/kg VRC01, or a control preparation every 8 weeks for a total of 10 infusions. Each trial is designed (1) to assess overall prevention efficacy (PE) pooled over the two VRC01 dose groups vs. control and (2) to assess VRC01 dose and laboratory markers as correlates of protection (CoPs) against overall and genotype- and phenotype-specific infection.

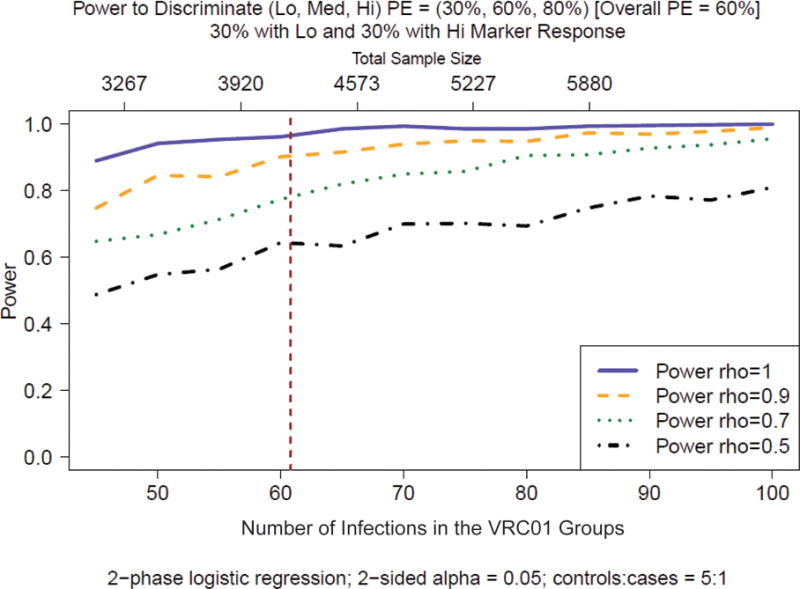
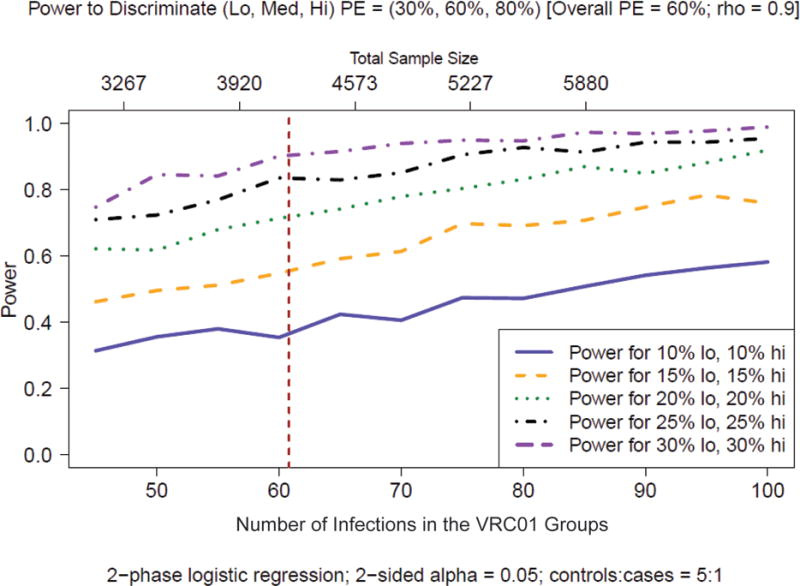
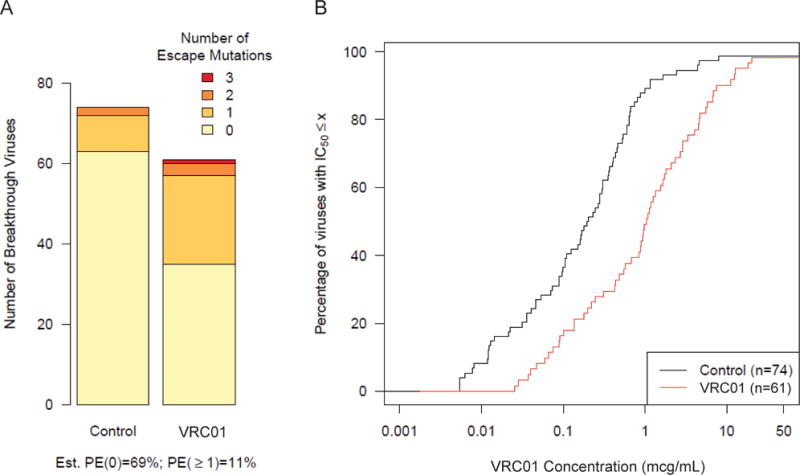
Results: Each AMP trial is designed to have 90% power to detect PE > 0% if PE is ≥ 60%. The AMP trials are also designed to identify VRC01 properties (i.e., concentration and effector functions) that correlate with protection and to provide insight into mechanistic CoPs. CoPs are assessed using data from breakthrough HIV-1 infections, including genetic sequences and sensitivities to VRC01-mediated neutralization and Fc effector functions.

Conclusions: The AMP trials test whether VRC01 can prevent HIV-1 infection in two study populations. If affirmative, they will provide information for estimating the optimal dosage of VRC01 (or subsequent derivatives) and identify threshold levels of neutralization and Fc effector functions associated with high-level protection, setting a benchmark for future vaccine evaluation and constituting a bridge to other bnAb approaches for HIV-1 prevention.

Keywords: Clinical trial; Correlates of protection; HIV prevention; Monoclonal antibody; Sieve analysis; Surrogate endpoint; VRC01.


Conflict of interest statement

Conflict of interest statement: All authors have no potential conflicts of interest to declare.

Figures

Figure 1
Figure 1
Projected overlap in serum VRC01 concentrations and person-years at risk (PYRs) for HIV-1 acquisition. 30 mg/kg and 10 mg/kg doses of VRC01 administration are compared. Under perfect infusion adherence, 100% PYRs > 1 mcg/mL for both dose groups, 91% PYRs > 4 mcg/mL for 10 mg/kg and 100% PYRs > 4 mcg/mL for 30 mg/kg doses.
Figure 2
Figure 2
Predicted VRC01 median serum concentration over time (solid lines) for (A) 10 mg/kg and (B) 30 mg/kg IV infusions of VRC01 at Weeks 0, 8, 16, 24, 32, 40, 48, 56, 64, and 72. with 90% confidence intervals (CIs) (dashed lines) based on a population pharmacokinetic analysis from VRC602 (n=23 VRC01 recipients, using a standard two compartment pharmacokinetic model developed with the program NONMEM). The horizontal lines at 10 and 50 mcg/mL denote the boundaries of the low, medium, and high ranges of the serum concentration marker S(t). PYRs = person-years at risk for HIV-1 acquisition.
Figure 3
Figure 3
Serum concentration of VRC01 (mcg/mL) measured by ELISA for 24 participants in the HVTN 104 phase 1 trial. (A) 10 mg/kg dose (N=12 participants received the first infusion; N=11 received the second infusion 8 weeks later). (B) 30 mg/kg dose (N=12 received the first infusion; N=9 received the second infusion 8 weeks later). The x-axis labels indicate days post-enrollment of concentration measurements, centered at the expected measurement times.
Figure 4
Figure 4
Modeled cumulative incidence of HIV-1 infection (VRC01 dose groups pooled vs. control) based on 5000 simulated data sets of the two AMP trials. HIV infection times were simulated as a function of time since prior infusion via a Cox regression model assuming exponential infection times and a 3.0% (5.5%) annual control group incidence in the Americas/Switzerland (Africa) trial. The Cox model coefficients were determined numerically by setting PE = 40% in the 10 mg/Kg dose group and PE = 80% in the 30 mg/Kg dose group, assuming that the instantaneous hazard ratio (VRC01/control) is higher when the current concentration of VRC01 is lower. Participants were assumed to have received all 10 infusions 8-weekly. The expected VRC01 serum concentrations were calculated based on modeling of the observed HVTN 104 data using a two-compartment pharmacokinetics model with an estimated clearance rate of 0.018 Liter/hour, volume of distribution in the central compartment of 5.97 Liter, volume of distribution in the peripheral compartment of 3.07 Liter, and inter-compartment clearance rate of 0.012 Liter/hour. Presented geometric mean concentrations are after 5 infusions of VRC01 in the 10 mg/kg and 30 mg/kg dose groups for a 70 kg participant. AMP, Antibody Mediated Protection; PE, prevention efficacy.
Figure 5
Figure 5
Total sample size for 90% power as a function of prevention efficacy. The total sample size for 90% power to reject H0: PE ≤ 0% in favor of H1: PE > 0% in a 1:1:1 allocation design with 80 weeks of follow-up for HIV-1 infection (1-sided α = 0.025 test) is shown as a function of prevention efficacy. Upper green line = North/South American/Swiss MSM + TG trial; lower orange line = sub-Saharan African women trial. MSM, men who have sex with men; PE, prevention efficacy; TG, transgender persons.
Figure 6
Figure 6
HIV-1 incidence in the control infusions group as a function of person-years at-risk under PrEP use. The annual HIV-1 incidence in the North/South American/Swiss MSM + TG control infusions group, assuming 4% annual HIV-1 incidence in the hypothetical scenario of no PrEP use, is shown under different levels of PrEP use and PrEP efficacy. MSM, men who have sex with men; PrEP, pre-exposure prophylaxis; TG, transgender persons.
Figure 7
Figure 7
Probabilities of stopping early in the North/South American/Swiss MSM + TG trial. The probabilities of stopping early for potential harm, non-efficacy, and high efficacy are shown. The probability of having unconditional power to reject the null hypothesis H0: PE ≤ 0% in favor of the alternative hypothesis H1: PE > 0 % (1-sided α = 0.025 test) is also shown. MSM, men who have sex with men; PE, prevention efficacy; TG, transgender persons.
Figure 8
Figure 8
Power curves for anticipated fixed PYRs at risk and PE. Power of a CoP analysis for detecting that PE varies over the 3 VRC01 marker-defined subgroups S(t)=Low, S(t) = Medium, and S(t) = High at levels PE = 30%, 60%, and 80%, respectively, for a marker with assay noise parameter rho = 1 (perfect marker), 0.9, 0.7, and 0.5 and percentages of person-years at risk in the (Low, Medium, High) marker regions set at (30%, 40%, 30%). The calculations assume 61 VRC01 group HIV-1-infected cases and 305 VRC01 group HIV-1-uninfected controls with data on S(t) and pool over both VRC01 groups and over both trials. The dashed vertical line represents the sample size of the two AMP trials combined. AMP, Antibody Mediated Prevention; CoP, correlate of protection; PE, prevention efficacy; PYRs, person-years at risk.
Figure 9
Figure 9
Power curves for anticipated PYRs at risk and PE with rho fixed at 0.9. Power of a CoP analysis for detecting that PE varies over the 3 VRC01 marker-defined subgroups S(t) = Low, S(t) = Medium, and S(t) = High at levels PE = 30%, 60%, and 80%, respectively, for a marker with assay noise parameter rho = 0.9 and percentages of person-years at risk in the Low and High marker regions varied from 10%, 15%, 20%, 25%, 30%. The calculations assume 61 VRC01 group HIV-1-infected cases and 305 VRC01 group HIV-1-uninfected controls with data on S(t) and pool over both VRC01 groups and over both trials. CoP, correlate of protection; PE, prevention efficacy; PYRs, person-years at risk.
Figure 10
Figure 10
Hypothetical illustration of genotypic and phenotypic sieve analysis. (A) Distribution of the number of known neutralization escape mutations in breakthrough control and VRC01 group HIV-1 sequences. (B) Percentage of the panel of breakthrough HIV-1s that are neutralized at level 50% (IC50) by the given concentration of VRC01. This illustration pools data across both trials.
Figure 11
Figure 11
Power calculations of phenotypic sieve analysis. IC50 distributions are compared between VRC01 group breakthrough HIV-1s and control group breakthrough HIV-1s, with difference equivalently expressed in terms of (A) the PE(x) curve or (B) the cumulative IC50 distribution functions. In (B), the black/highest curve represents the distribution for the control group breakthrough HIV-1s. (C) Power of the Wilcoxon test. The scenario when PE10=PE30=60% and pooling over the two VRC01 groups and the two trials is highlighted dark blue (with 74 control group cases). IC50, 50% inhibitory concentration; PE, prevention efficacy.

References

    1. Abdool Karim Q, Abdool Karim SS, Frohlich JA, et al. Effectiveness and safety of tenofovir gel, an antiretroviral microbicide, for the prevention of HIV infection in women. Science. 2010;329(5996):1168–1174. - PMC - PubMed
    1. AIDSinfo. Guidelines for the Use of Antiretroviral Agents in HIV-1-Infected Adults and Adolescents: Limitations to Treatment Safety and Efficacy: Adverse Effects of Antiretroviral Agents. 2014 Last Modified 5/1/2014 Accessed 2/17/2015. http://aidsinfo.nih.gov/guidelines.
    1. Asmal M, Sun Y, Lane S, et al. Antibody-dependent cell-mediated viral inhibition emerges after simian immunodeficiency virus SIVmac251 infection of rhesus monkeys coincident with gp140-binding antibodies and is effective against neutralization-resistant viruses. Journal of Virology. 2011;85(11):5465–5475. - PMC - PubMed
    1. Baba TW, Liska V, Hofmann-Lehmann R, et al. Human neutralizing monoclonal antibodies of the IgG1 subtype protect against mucosal simian-human immunodeficiency virus infection. Nature Medicine. 2000;6(2):200–206. - PubMed
    1. Baeten Jared M, Donnell Deborah, Ndase Patrick, et al. Antiretroviral Prophylaxis for HIV Prevention in Heterosexual Men and Women. New England Journal of Medicine. 2012;367(5):399–410. - PMC - PubMed

LinkOut - more resources