. 2018 Feb;18(1):117-126.
doi: 10.3758/s13415-017-0556-2.

Pure correlates of exploration and exploitation in the human brain

Affiliations

Pure correlates of exploration and exploitation in the human brain

Tommy C Blanchard et al. Cogn Affect Behav Neurosci. 2018 Feb.

Abstract

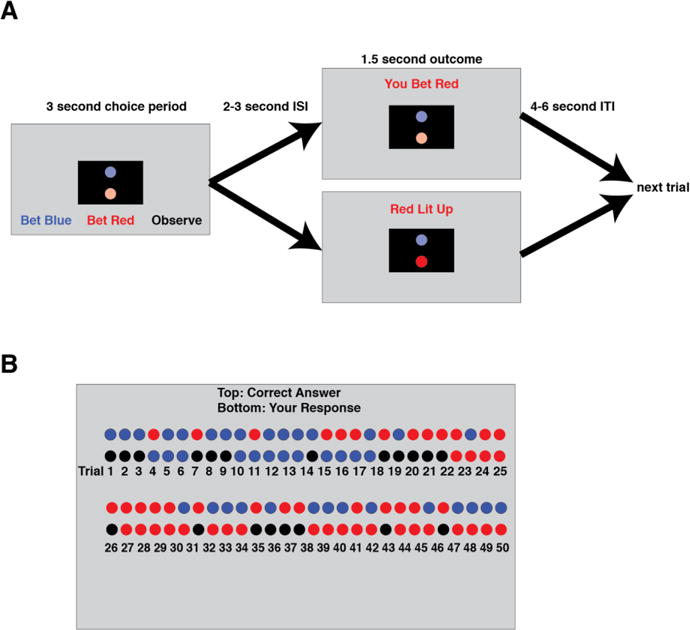
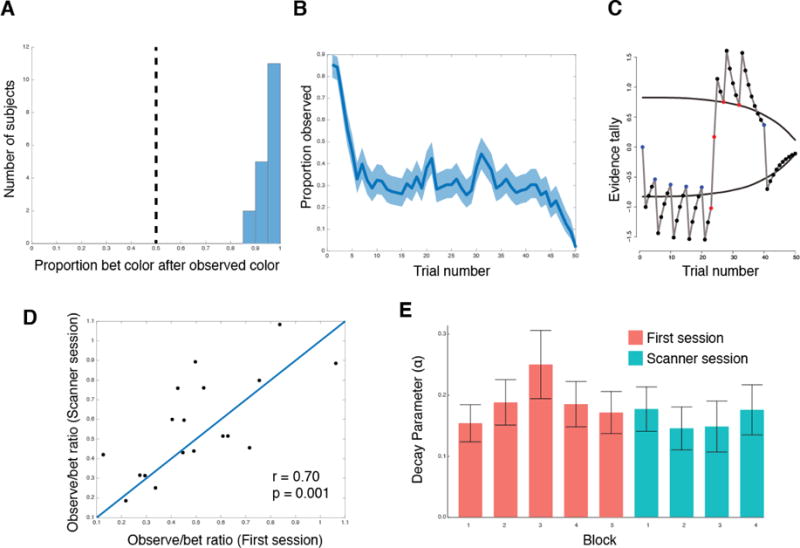
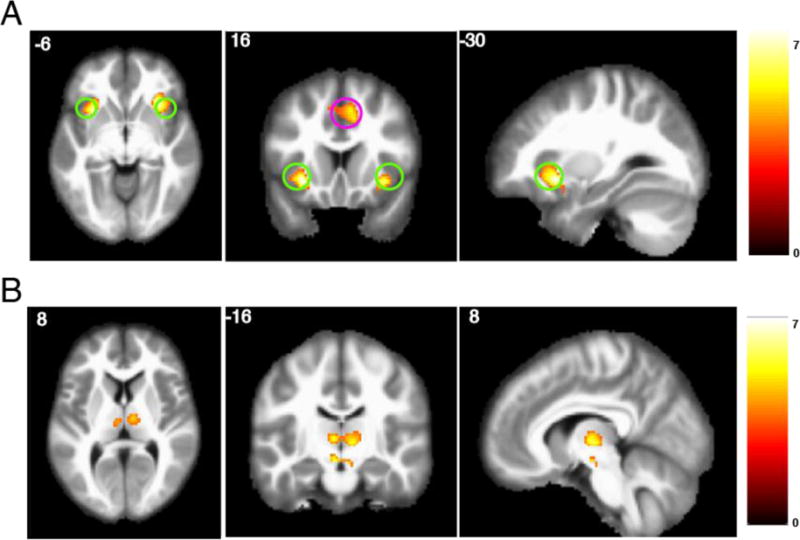
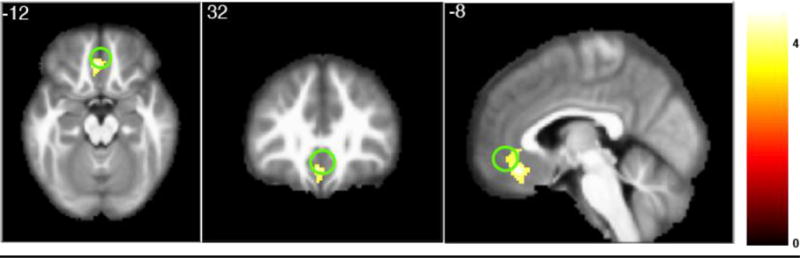
Balancing exploration and exploitation is a fundamental problem in reinforcement learning. Previous neuroimaging studies of the exploration-exploitation dilemma could not completely disentangle these two processes, making it difficult to unambiguously identify their neural signatures. We overcome this problem using a task in which subjects can either observe (pure exploration) or bet (pure exploitation). Insula and dorsal anterior cingulate cortex showed significantly greater activity on observe trials compared to bet trials, suggesting that these regions play a role in driving exploration. A model-based analysis of task performance suggested that subjects chose to observe until a critical evidence threshold was reached. We observed a neural signature of this evidence accumulation process in the ventromedial prefrontal cortex. These findings support theories positing an important role for anterior cingulate cortex in exploration, while also providing a new perspective on the roles of insula and ventromedial prefrontal cortex.

Keywords: decision making; fMRI; reinforcement learning.


Conflict of interest statement

Conflict of interest: The authors declare no competing financial interests.

Figures

Figure 1
Figure 1. A) Diagram of the ‘observe or bet’ task
Subjects first made a choice between betting blue, betting red, or observing. They then waited through a variable-length interstimulus interval (during which nothing was on the screen). Then for 1.5 seconds subjects were shown the outcome of their action – if they bet, they were simply told which color they bet, if they observed they were told which color lit up. This was followed by a variable length intertrial interval. B) End of block score screen. At the end of each block of the task, subjects were shown what had happened on each trial. They saw one row of colored circles indicating what lit up on each trial, and a second row showing what their action had been on that trial (red or blue for betting, black for observing). They were also told their score for that block. For more details on the task, see Methods.
Figure 2
Figure 2. Behavior on the ‘observe or bet’ task. A)
Histogram showing the proportion of time each subject bet on the same color they observed on the previous trial. Vertical dashed line indicates random choice. B) Proportion of trials subjects observed by trial number on each block (averaged across all subjects). Shaded region indicated the 95% confidence interval. C) A visual representation of the model for one block. Circles indicate the action that was taken on that trial (black for bet, red for observed red, blue for observed blue). Grey line indicates the evidence tally on each trial. Black lines indicate the betting threshold. See Materials and Methods for model details. D) Observe to bet ratio for each subject for the initial behavioral session and the scanner session. Line indicates the point of equality for the two sessions. E) The average evidence decay parameter across all subjects for each block.
Figure 3
Figure 3. Observe – bet contrast
A) Clusters within the significant ROIs, with threshold set at p < 0.001, uncorrected. The ROI for insula is circled in green, the ROI for ACC is circled in magenta. B) Whole-brain analysis with cluster family-wise error shows an effect in thalamus, peak activity at 8, −14, 2.
Figure 4
Figure 4. Update contrast
Cluster within the significant ROI. Green circle shows the ROI for vmPFC. Threshold set at p < 0.001, uncorrected.

References

    1. Amiez C, Sallet J, Procyk E, Petrides M. Modulation of feedback related activity in the rostral anterior cingulate cortex during trial and error exploration. Neuroimage. 2012;63:1078–1090. - PubMed
    1. Badre D, Doll BB, Long NM, Frank MJ. Rostrolateral prefrontal cortex and individual differences in uncertainty-driven exploration. Neuron. 2012;73:595–607. - PMC - PubMed
    1. Bartra O, McGuire JT, Kable JW. The valuation system: a coordinate-based meta-analysis of BOLD fMRI experiments examining neural correlates of subjective value. NeuroImage. 2013;76:412–27. - PMC - PubMed
    1. Raja Beharelle A, Polania R, Hare TA, Ruff CC. Transcranial Stimulation over Frontopolar Cortex Elucidates the Choice Attributes and Neural Mechanisms Used to Resolve Exploration-Exploitation Trade-Offs. Journal of Neuroscience. 2015;35(43):14544–14556. - PMC - PubMed
    1. Blanchard TC, Hayden BY. Neurons in dorsal anterior cingulate cortex signal postdecisional variables in a foraging task. J Neurosci. 2014;34:646–655. - PMC - PubMed

Publication types