. 2018 Feb 15;596(4):703-716.
doi: 10.1113/JP275226. Epub 2018 Jan 30.

Activity-dependent control of NMDA receptor subunit composition at hippocampal mossy fibre synapses

Affiliations

Activity-dependent control of NMDA receptor subunit composition at hippocampal mossy fibre synapses

Mario Carta et al. J Physiol. .

Abstract

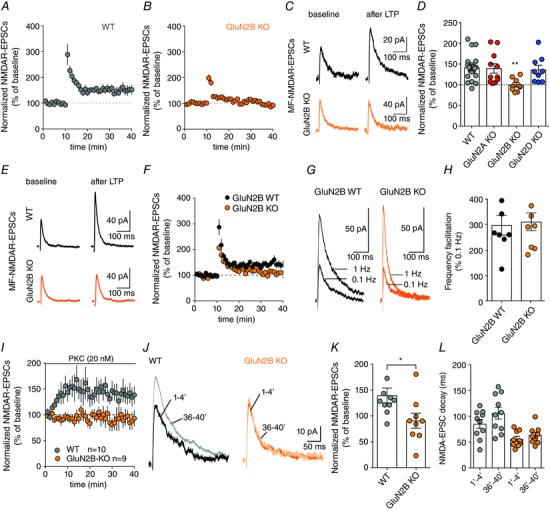
Key points: CA3 pyramidal cells display input-specific differences in the subunit composition of synaptic NMDA receptors (NMDARs). Although at low density, GluN2B contributes significantly to NMDAR-mediated EPSCs at mossy fibre synapses. Long-term potentiation (LTP) of NMDARs triggers a modification in the subunit composition of synaptic NMDARs by insertion of GluN2B. GluN2B subunits are essential for the expression of LTP of NMDARs at mossy fibre synapses.

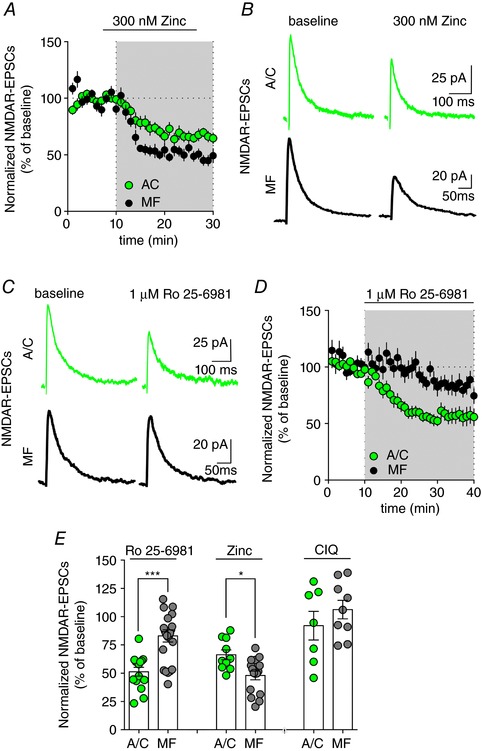
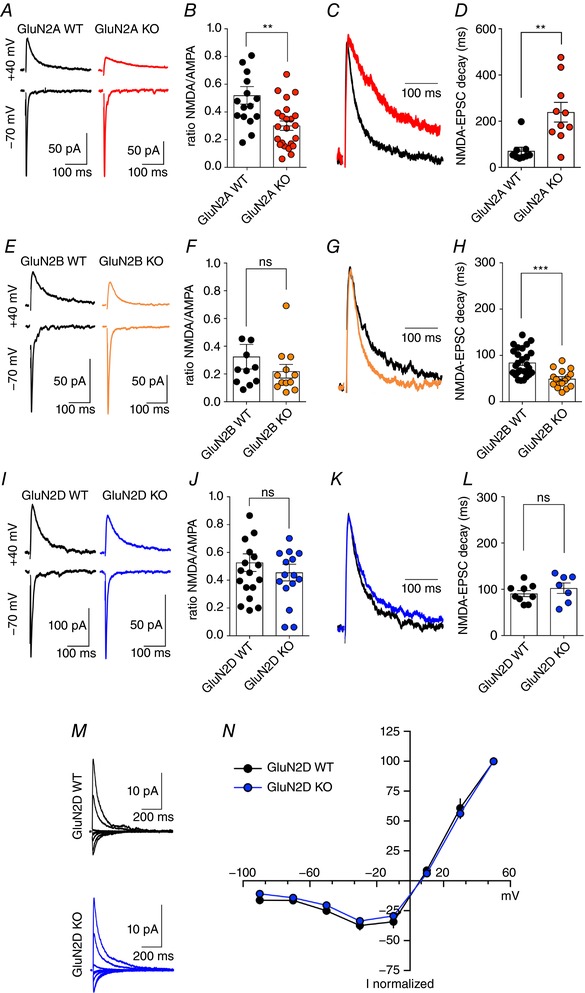
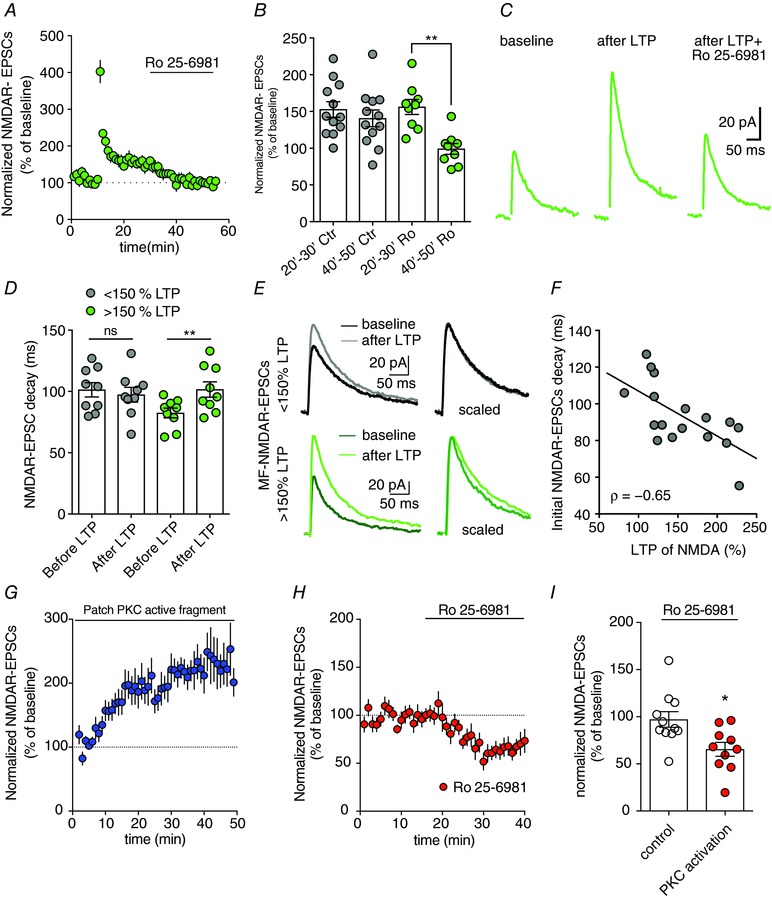
Abstract: Single neurons express NMDA receptors (NMDARs) with distinct subunit composition and biophysical properties that can be segregated in an input-specific manner. The dynamic control of the heterogeneous distribution of synaptic NMDARs is crucial to control input-dependent synaptic integration and plasticity. In hippocampal CA3 pyramidal cells from mice of both sexes, we found that mossy fibre (MF) synapses display a markedly lower proportion of GluN2B-containing NMDARs than associative/commissural synapses. The mechanism involved in such heterogeneous distribution of GluN2B subunits is not known. Here we show that long-term potentiation (LTP) of NMDARs, which is selectively expressed at MF-CA3 pyramidal cell synapses, triggers a modification in the subunit composition of synaptic NMDARs by insertion of GluN2B. This activity-dependent recruitment of GluN2B at mature MF-CA3 pyramidal cell synapses contrasts with the removal of GluN2B subunits at other glutamatergic synapses during development and in response to activity. Furthermore, although expressed at low levels, GluN2B is necessary for the expression of LTP of NMDARs at MF-CA3 pyramidal cell synapses. Altogether, we reveal a previously unknown activity-dependent regulation and function of GluN2B subunits that may contribute to the heterogeneous plasticity induction rules in CA3 pyramidal cells.

Keywords: NMDA receptors; hippocampus; subunit composition; synaptic plasticity.


Figures

Figure 1
Figure 1. Differential GluN2‐subunit composition of NMDARs in CA3 pyramidal cell synapses
A and B, time course and representative traces illustrating the differential inhibition of NMDAR‐EPSCs by 300 nm zinc at A/C and MF synapses. C and D, the selective GluN2B‐containing NMDAR antagonist Ro 25–6891 (1 μm) induces a significantly higher inhibition of NMDAR‐EPSCs at A/C versus MF synapses. E, bar graph summarizing the impact of the subunit‐selective GluN2B‐ (1 μm Ro 25–6981) and GluN2A‐ (300 nm zinc) containing NMDAR antagonists as well as of the selective GluN2C/D potentiator (CIQ) on A/C and MF NMDAR‐EPSCs. Ro 25–6981, *** P = 0.0002; zinc, * P = 0.014; CIQ, P = 0.44; Mann–Whitney test MF vs. respective A/C group. [Color figure can be viewed at wileyonlinelibrary.com]
Figure 2
Figure 2. Selective GluN2‐subunit KO mice reveal the differential participation of GluN2A and GluN2B in MF‐NMDA EPSCs
A and B, sample traces and summary plot illustrating the reduced NMDAR/AMPAR ratio in GluN2A KO mice at MF synapses, suggesting decreased levels of synaptic NMDARs (** P = 0.0023, Mann–Whitney test). C, peak scaled MF NMDAR‐EPSCs obtained from WT and GluN2A KO mice. D, summary graph illustrating the significant slowing down of MF NMDAR‐EPSCs when removing GluN2A subunits (** P = 0.0053, Mann–Whitney test). E and F, sample traces and summary plot showing similar NMDAR/AMPAR ratios in WT and GluN2B KO mice at MF synapses (P = 0.19, Mann–Whitney test). G, peak scaled MF NMDAR‐EPSCs obtained from WT and GluN2B KO mice. H, summary graph illustrating that despite similar NMDAR/AMPAR ratios, GluN2B subunits contribute significantly to NMDAR‐EPSC kinetics at MF synapses (*** < 0.0001, Mann–Whitney test). IL, genetic removal of GluN2D subunits does not significantly alter NMDAR/AMPAR ratio nor MF NMDAR‐EPSCs kinetics. Decay values represent the weighted decay calculated after using a double exponential fit of recorded NMDAR‐EPSCs (see Methods). M and N, sample traces and summary graph illustrating that the I–V curve recorded in GluN2D KO mice does not differ from that recorded in control littermate WT mice (GluN2D WT n = 6; GluN2D KO n = 8). [Color figure can be viewed at wileyonlinelibrary.com]
Figure 3
Figure 3. LTP of NMDARs recruits GluN2B‐containing NMDARs at MF synapses
AC, average time course, summary plot and representative traces reflecting the increased inhibition of NMDAR‐EPSCs by Ro 25–6981 at MF–CA3 synapses after induction of LTP‐NMDAR. Ro‐256981 was applied at 30 min and the average Ro‐256981 effect was quantified between 40 and 50 min. In control cells Ro‐256981 was not applied (** P = 0.039, Wilcoxon's matched‐pairs signed rank test LTP 20–30 Ro25‐6981 and LTP 40–50 Ro25‐6981). D and E, MF–CA3 synapses displaying the larger LTP‐NMDAR displayed NMDAR‐EPSCs with slower decay kinetics after LTP induction (* P = 0.02, Wilcoxon matched‐pairs signed rank test). F, negative correlation between NMDAR‐EPSC decay kinetics and LTP‐NMDAR amplitude (Spearman r = −0.6, P = 0.0074). MF–CA3 synapses showing slower initial NMDAR‐EPSC kinetics display reduced LTP levels possibility reflecting already GluN2B‐containing potentiated MF–CA3 synapses. G‐perfusion of the PKC active fragment via patch pipette induces a progressive potentiation of synaptic NMDARs at MF–CA3 synapses. H and I, average time course and summary plot illustrating the inhibition of NMDAR‐EPSCs at MF–CA3 synapses by Ro25‐6981 after previous PKC activation (see panel G) (* P = 0.01 Mann–Whitney test). [Color figure can be viewed at wileyonlinelibrary.com]
Figure 4
Figure 4. LTP‐NMDAR at MF–CA3 synapses requires the presence of GluN2B subunits
A, time course of LTP‐NMDAR observed at MF–CA3 synapses after application of a brief train of synaptic stimulation in wild‐type mice. B and C, average time course and representative traces illustrating that LTP‐NMDAR at MF–CA3 synapses is impaired when GluN2B subunits are removed. D, summary plot of the amplitude of LTP‐NMDAR in WT and after the selective removal of GluN2A, GluN2B or GluN2D subunits (** P = 0.002, Kruskal–Wallis test followed by Dunn's multiple comparisons test). E and F, sample traces and time course illustrating that LTP‐NMDAR at MF–CA3 synapses cannot be induced in GluN2B KO mice even when the induction protocol was increased to 10 bursts of stimulations (* < 0.05 KO vs. WT, Mann–Whitney test). G and H, sample traces and summary bar graphs illustrating that short term plasticity such as frequency facilitation is not altered by the removal of GluN2B subunit. In all panels, values are presented as mean ± SEM of n experiments. I, time course of NMDAR‐EPSC peak amplitude observed at MF–CA3 synapses after infusion of PKMζ into CA3 PCs through the intracellular solution in WT and GluN2B KO neurons. J, representative traces illustrating that potentiation effect of PKMζ NMDAR‐EPSCs is absent when GluN2B subunits are removed. K, summary plot of PKMζ effect in NMDAR‐EPSC peak amplitude in WT and GluN2B KO neurons (* P = 0.03, Mann–Whitney test). L, bar graph resuming the effect of PKMζ infusion in NMDAR‐EPSC decay kinetics in WT and GluN2B KO CA3 PCs. [Color figure can be viewed at wileyonlinelibrary.com]

References

    1. Akashi K, Kakizaki T, Kamiya H, Fukaya M, Yamasaki M, Abe M, Natsume R, Watanabe M & Sakimura K (2009). NMDA receptor GluN2B (GluR 2/NR2B) subunit is crucial for channel function, postsynaptic macromolecular organization, and actin cytoskeleton at hippocampal CA3 synapses. J Neurosci 29, 10869–10882. - PMC - PubMed
    1. Al‐Hallaq RA, Conrads TP, Veenstra TD & Wenthold RJ (2007). NMDA di‐heteromeric receptor populations and associated proteins in rat hippocampus. J Neurosci 27, 8334–8343. - PMC - PubMed
    1. Barria A & Malinow R (2005). NMDA receptor subunit composition controls synaptic plasticity by regulating binding to CaMKII. Neuron 48, 289–301. - PubMed
    1. Bartol TM, Bromer C, Kinney J, Chirillo MA, Bourne JN, Harris KM & Sejnowski TJ (2015). Nanoconnectomic upper bound on the variability of synaptic plasticity. Elife 4, e10778. - PMC - PubMed
    1. Bellone C & Nicoll RA (2007). Rapid bidirectional switching of synaptic NMDA receptors. Neuron 55, 779–785. - PubMed

Publication types

LinkOut - more resources