. 2018:23:111-122.

Large-scale analysis of disease pathways in the human interactome

Affiliations

Large-scale analysis of disease pathways in the human interactome

Monica Agrawal et al. Pac Symp Biocomput. 2018.

Abstract

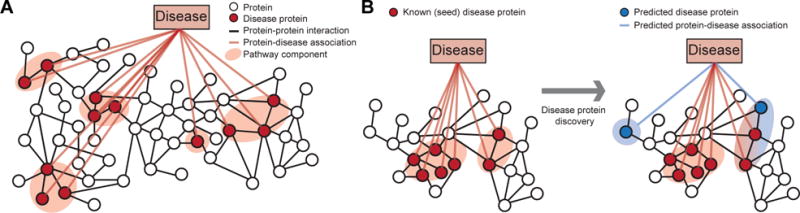
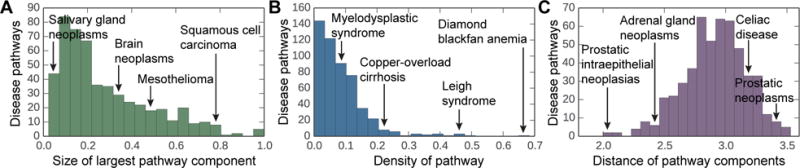
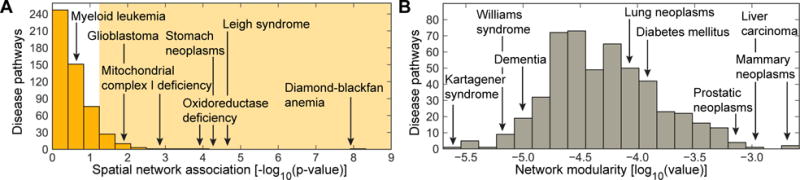
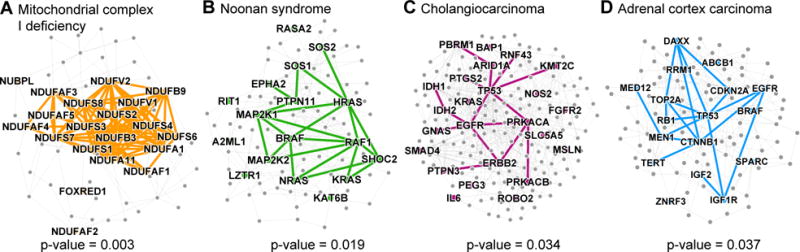
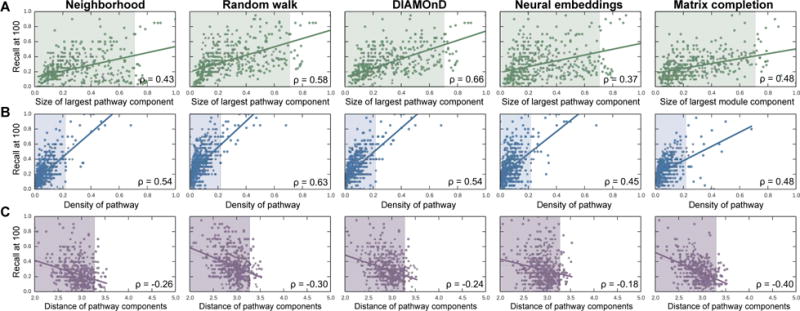
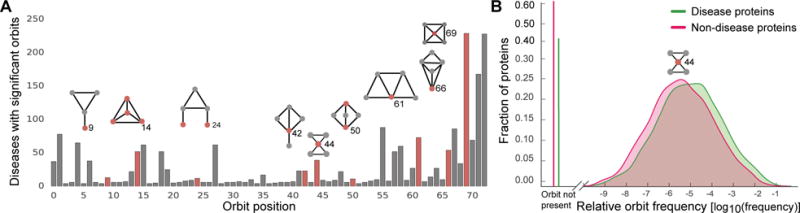
Discovering disease pathways, which can be defined as sets of proteins associated with a given disease, is an important problem that has the potential to provide clinically actionable insights for disease diagnosis, prognosis, and treatment. Computational methods aid the discovery by relying on protein-protein interaction (PPI) networks. They start with a few known disease-associated proteins and aim to find the rest of the pathway by exploring the PPI network around the known disease proteins. However, the success of such methods has been limited, and failure cases have not been well understood. Here we study the PPI network structure of 519 disease pathways. We find that 90% of pathways do not correspond to single well-connected components in the PPI network. Instead, proteins associated with a single disease tend to form many separate connected components/regions in the network. We then evaluate state-of-the-art disease pathway discovery methods and show that their performance is especially poor on diseases with disconnected pathways. Thus, we conclude that network connectivity structure alone may not be sufficient for disease pathway discovery. However, we show that higher-order network structures, such as small subgraphs of the pathway, provide a promising direction for the development of new methods.


Figures

Fig. 1
Fig. 1. Network-based discovery of disease proteins
A Proteins associated with a disease are projected onto the protein-protein interaction (PPI) network. In this work, disease pathway denotes a (undirected) subgraph of the PPI network defined by the set of disease-associated proteins. The highlighted disease pathway consists of five pathway components. B Methods for disease protein discovery predict candidate disease proteins using the PPI network and known proteins associated with a specific disease. Predicted disease proteins can be grouped into a disease pathway to study molecular disease mechanisms.
Fig. 2
Fig. 2. Protein interaction connectivity of disease pathways
The distribution of (A) the network densities of each disease pathway, (B) the relative size of the largest pathway component calculated as a fraction of disease proteins that lie in the largest pathway component, and (C) the average shortest path length between disparate pathway components in the PPI network.
Fig. 3
Fig. 3. Spatial clustering and modular structure of disease pathways in the PPI network
The distribution of (A) the spatial clustering calculated for each disease pathway as the strength of association between the set of disease proteins and the PPI network (shaded area indicates significant spatial clustering at α = 0.05 level), and (B) the modularity of disease pathways in the PPI network.
Fig. 4
Fig. 4. Disease pathways in the wider PPI network
A small PPI subnetwork highlighting physical interactions between disease proteins associated with (A) Mitochondrial complex I deficiency, (B) Noonan syndrome, (C) Cholangiocarcinoma, and (D) Adrenal cortex carcinoma. Shown are selected disease pathways whose spatial clustering within the PPI network is statistically significant (p-values shown; entire distribution of the p-values is shown in Figure 3A) and is also among the strongest (top-30 diseases) in the disease corpus.
Fig. 5
Fig. 5. Prediction quality versus PPI connectivity of disease proteins
Each point represents one disease; its location is determined by the quality of predicted disease proteins (y-coordinate), and by the connectivity of disease proteins in the PPI network (x-coordinate). Across all five methods, the trends uniformly indicate that (A) the bigger the largest pathway component, (B) the more densely interconnected the disease pathway, and (C) the lower the average shortest path length between disparate pathway components, the better the predictions. The shaded areas represent the space in which 95% (494 of 519) of all diseases reside.
Fig. 6
Fig. 6. Over-representation of motifs in disease modules
A The number of diseases (out of 519 possible) for which the associated proteins are significantly over-represented at each orbit position. A disease is deemed significant at a given orbit position if the median number of times a disease protein matching that position was significant at α = 0.01, as compared to permutation testing over random sets of proteins of the same size. Pictured above are selected motifs (red node represents the orbit position, i.e., the location where the node touches the motif). B The relative frequency distribution of orbit 44 for disease proteins (green) and non-disease proteins (red).

References

    1. Ritchie MD, Holzinger ER, Li R, Pendergrass SA, Kim D. Nature Reviews Genetics. 2015;16:85. - PubMed
    1. Piñero J, et al. Database. 2015;2015
    1. Gustafsson M, et al. Genome Medicine. 2014;6:82. - PMC - PubMed
    1. Creixell P, et al. Nature Methods. 2015;12:615. - PMC - PubMed
    1. Navlakha S, Kingsford C. Bioinformatics. 2010;26:1057. - PMC - PubMed

Publication types