

Climate change impacts on human health over Europe through its effect on air quality
- PMID: 29219103
- PMCID: PMC5773909
- DOI: 10.1186/s12940-017-0325-2
Climate change impacts on human health over Europe through its effect on air quality
Abstract
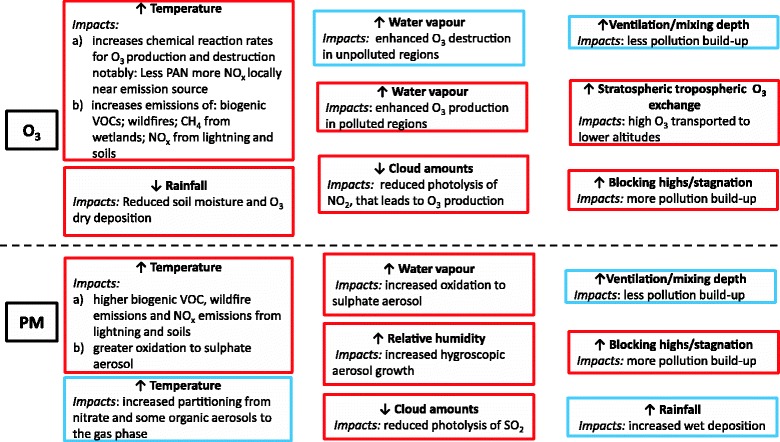
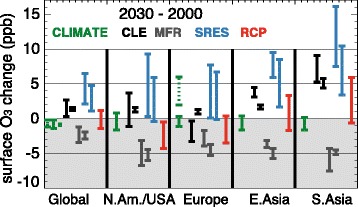
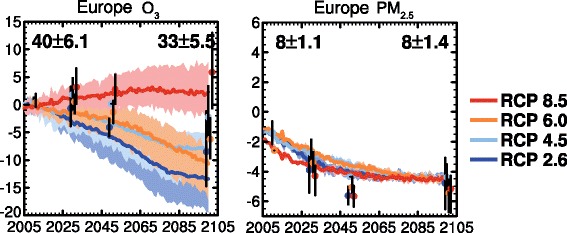
This review examines the current literature on the effects of future emissions and climate change on particulate matter (PM) and O3 air quality and on the consequent health impacts, with a focus on Europe. There is considerable literature on the effects of climate change on O3 but fewer studies on the effects of climate change on PM concentrations. Under the latest Intergovernmental Panel on Climate Change (IPCC) 5th assessment report (AR5) Representative Concentration Pathways (RCPs), background O3 entering Europe is expected to decrease under most scenarios due to higher water vapour concentrations in a warmer climate. However, under the extreme pathway RCP8.5 higher (more than double) methane (CH4) abundances lead to increases in background O3 that offset the O3 decrease due to climate change especially for the 2100 period. Regionally, in polluted areas with high levels of nitrogen oxides (NOx), elevated surface temperatures and humidities yield increases in surface O3 - termed the O3 climate penalty - especially in southern Europe. The O3 response is larger for metrics that represent the higher end of the O3 distribution, such as daily maximum O3. Future changes in PM concentrations due to climate change are much less certain, although several recent studies also suggest a PM climate penalty due to high temperatures and humidity and reduced precipitation in northern mid-latitude land regions in 2100.A larger number of studies have examined both future climate and emissions changes under the RCP scenarios. Under these pathways the impact of emission changes on air quality out to the 2050s will be larger than that due to climate change, because of large reductions in emissions of O3 and PM pollutant precursor emissions and the more limited climate change response itself. Climate change will also affect climate extreme events such as heatwaves. Air pollution episodes are associated with stagnation events and sometimes heat waves. Air quality during the 2003 heatwave over Europe has been examined in numerous studies and mechanisms for enhancing O3 have been identified.There are few studies on health effects associated with climate change impacts alone on air quality, but these report higher O3-related health burdens in polluted populated regions and greater PM2.5 health burdens in these emission regions. Studies that examine the combined impacts of climate change and anthropogenic emissions change under the RCP scenarios report reductions in global and European premature O3-respiratory related and PM mortalities arising from the large decreases in precursor emissions. Under RCP 8.5 the large increase in CH4 leads to global and European excess O3-respiratory related mortalities in 2100. For future health effects, besides uncertainty in future O3 and particularly PM concentrations, there is also uncertainty in risk estimates such as effect modification by temperature on pollutant-response relationships and potential future adaptation that would alter exposure risk.
Keywords: Climate change and air pollution; Human health; Ozone; Particulate matter.
Conflict of interest statement
Ethics approval and consent to participate
Not Applicable.
Consent for publication
Not Applicable.
Competing interests
No competing interests.
Publisher’s Note
Springer Nature remains neutral with regard to jurisdictional claims in published maps and institutional affiliations.
Figures
Similar articles
-
Air quality and climate connections.J Air Waste Manag Assoc. 2015 Jun;65(6):645-85. doi: 10.1080/10962247.2015.1040526. J Air Waste Manag Assoc. 2015. PMID: 25976481 Review.
-
Impacts of transportation sector emissions on future U.S. air quality in a changing climate. Part II: Air quality projections and the interplay between emissions and climate change.Environ Pollut. 2018 Jul;238:918-930. doi: 10.1016/j.envpol.2018.03.016. Epub 2018 Apr 24. Environ Pollut. 2018. PMID: 29684896
-
Multicity study of air pollution and mortality in Latin America (the ESCALA study).Res Rep Health Eff Inst. 2012 Oct;(171):5-86. Res Rep Health Eff Inst. 2012. PMID: 23311234
-
The London low emission zone baseline study.Res Rep Health Eff Inst. 2011 Nov;(163):3-79. Res Rep Health Eff Inst. 2011. PMID: 22315924
-
Interactions of Climate Change, Air Pollution, and Human Health.Curr Environ Health Rep. 2018 Mar;5(1):179-186. doi: 10.1007/s40572-018-0188-x. Curr Environ Health Rep. 2018. PMID: 29417451 Review.
Cited by
-
Geography Matters, But… Evolving Success Factors for Nature-Oriented Health Tourism within Selected Alpine Destinations.Int J Environ Res Public Health. 2021 May 18;18(10):5389. doi: 10.3390/ijerph18105389. Int J Environ Res Public Health. 2021. PMID: 34070110 Free PMC article.
-
[New challenges for intensive care medicine due to climate change and global warming].Anaesthesist. 2020 Jul;69(7):463-469. doi: 10.1007/s00101-020-00783-w. Anaesthesist. 2020. PMID: 32399720 Free PMC article. Review. German.
-
Examination of air pollutants and their risk for human health in urban and suburban environments for two Romanian cities: Brasov and Iasi.Heliyon. 2023 Oct 31;9(11):e21810. doi: 10.1016/j.heliyon.2023.e21810. eCollection 2023 Nov. Heliyon. 2023. PMID: 38027749 Free PMC article.
-
Short-Term Effects of Heat on Mortality and Effect Modification by Air Pollution in 25 Italian Cities.Int J Environ Res Public Health. 2018 Aug 17;15(8):1771. doi: 10.3390/ijerph15081771. Int J Environ Res Public Health. 2018. PMID: 30126130 Free PMC article.
-
Obstructive sleep apnoea and left ventricular diastolic dysfunction among first responders to the 9/11 World Trade Center terrorist attack: a cross-sectional study.BMJ Open. 2022 Apr 19;12(4):e058366. doi: 10.1136/bmjopen-2021-058366. BMJ Open. 2022. PMID: 35440460 Free PMC article.
References
-
- WHO, 2013a. Review of evidence on health aspects of air pollution – REVIHAAP project: technical report, World Health Organisation, Copenhagen, Denmark. 2013 http://www.euro.who.int/en/health-topics/environment-and-health/air-qual.... Accessed 27 May 2016.
-
- COMEAP (2015) Quantification of Mortality and Hospital Admissions Associated with Ground-level Ozone, UK Department of Health Committee on the Medical Effects of Air Pollution. ISBN 978–0–85951-776-8. https://www.gov.uk/government/publications/comeap-quantification-of-mort.... Accessed 27 May 2016.
-
- EEA. Air quality in Europe - 2016 report. EEA Report No 28/2016., European Environment Agency. 2014. ISBN: 978–92–9213-824-0. http://www.eea.europa.eu/publications/air-quality-in-europe-2016. Accessed 27 May 2016.
-
- Forouzanfar MH, Afshin A, Alexander LT, Anderson HR, Bhutta ZA, Biryukov S, et al. Global, regional, and national comparative risk assessment of 79 behavioural, environmental and occupational, and metabolic risks or clusters of risks, 1990-2013;2015: a systematic analysis for the global burden of disease study 2015. Lancet. 2016;388(1659–1724):2016. - PMC - PubMed
Publication types
MeSH terms
Substances
LinkOut - more resources
Full Text Sources
Other Literature Sources
Medical
