. 2018 Feb 1;15(2):242-250.
doi: 10.1080/15476286.2017.1403003. Epub 2017 Dec 8.

A comprehensive profile of circulating RNAs in human serum

Affiliations

A comprehensive profile of circulating RNAs in human serum

Sinan Uğur Umu et al. RNA Biol. .

Abstract

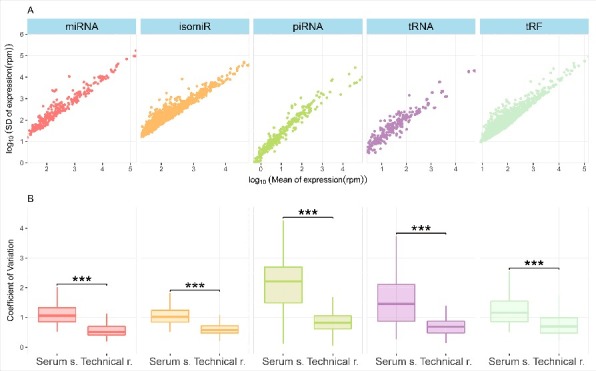
Non-coding RNA (ncRNA) molecules have fundamental roles in cells and many are also stable in body fluids as extracellular RNAs. In this study, we used RNA sequencing (RNA-seq) to investigate the profile of small non-coding RNA (sncRNA) in human serum. We analyzed 10 billion Illumina reads from 477 serum samples, included in the Norwegian population-based Janus Serum Bank (JSB). We found that the core serum RNA repertoire includes 258 micro RNAs (miRNA), 441 piwi-interacting RNAs (piRNA), 411 transfer RNAs (tRNA), 24 small nucleolar RNAs (snoRNA), 125 small nuclear RNAs (snRNA) and 123 miscellaneous RNAs (misc-RNA). We also investigated biological and technical variation in expression, and the results suggest that many RNA molecules identified in serum contain signs of biological variation. They are therefore unlikely to be random degradation by-products. In addition, the presence of specific fragments of tRNA, snoRNA, Vault RNA and Y_RNA indicates protection from degradation. Our results suggest that many circulating RNAs in serum can be potential biomarkers.

Keywords: Bioinformatics; RNA fragments; Small RNA; cancer; circulating RNA; rna sequencing; serum.


Figures

Figure 1.
Figure 1.
(A) The line shows the distribution of trimmed RNA molecule sizes for the serum samples. Our theoretical input library size is between 17 and 47 nts. There are two peaks for the reads at 22 and 31 nts length. This enabled us to detect numerous RNA types including fragments of lncRNAs and mRNAs. (B) The saturation lines of canonical genes (i.e. miRNAs, piRNAs, and tRNAs) for a randomly selected subset of serum samples (n = 12) are shown. The number of identified genes are still increasing for piRNAs (the dark green lines) but the others are about to reach plateau. (C) The non-canonical isoforms (i.e. isomiRs and tRFs) identified are also increasing with the sequencing depth and far from reaching plateau.
Figure 2.
Figure 2.
An overall classification of the mapped reads of the serum samples (n = 477). This pie-chart on the left, generated using uniquely-mapped reads, shows an abundance of miRNA hits followed by protein-coding mRNAs and misc-RNAs. Allowing multi-mapped reads is affecting overall RNA profiles (on the right). For multi-mapped reads, piRNAs (green) are the most abundant RNA type followed by misc-RNAs (yellow) and tRNAs (purple). The annotations of GENCODE v26 and piRBase were used to create these plots. Similar pie-charts for the technical replicates are at the supplementary (Fig. S2).
Figure 3.
Figure 3.
The profiles of mapped reads from highly expressed (A) tRNAs (n = 41), (B) U3 snoRNAs (n = 18), (C) Vault RNAs (n = 4) and (D) Y_RNAs (n = 57). Each panel has a multiple sequence alignment (MSA) at the bottom and a corresponding density plot at the top. The x-axes of all plots display a nt position on their MSAs. For example, the MSA of tRNAs is 75 nts long which can be seen at the bottom of the plots. The density plots shows the overall mapping profiles and their x-axes also display nt positions. The heat-maps provide colored representation of the density plot per RNA in the alignment. Yellow and green correspond to the top expressed regions (i.e. high depth), while blue contain almost no mapped reads. White are the gaps in the alignment. (A) The reads mapped to mature tRNAs are mostly coming from the 3′ ends (density plot). (B) There is a peak at the 5′ end of the snoRNA density plot that corresponds to a 20 nts long region. (C) The Vault RNAs identified have a clear signal of expression at their 3′ ends (density plot and yellow bricks at the heatmap). (D) The Y_RNA reads are mostly originating from 5′ ends and there is a small peak at the 3′ end (density plot).
Figure 4.
Figure 4.
(A) The y-axis shows the log10 of standard deviations of normalized expression and the x-axis shows the log10 mean expression of identified sncRNAs. (B) The boxplots show the distribution of CV values in the serum samples and the technical replicates. A pairwise MWU test (*** p << 0.0001) confirmed higher CV values in the serum samples than the technical replicates suggesting higher biological variation for the serum samples than the technical replicates. Randomly generated subsamples of the serum samples (n = 17) also produces similar results (Fig. S3) excluding variation due to different samples sizes.

References

    1. Danielson KM, Rubio R, Abderazzaq F, et al.. High Throughput Sequencing of Extracellular RNA from Human Plasma. PLoS One. 2017;12:e0164644. - PMC - PubMed
    1. Keller A, Leidinger P, Gislefoss R, et al.. Stable serum miRNA profiles as potential tool for non-invasive lung cancer diagnosis. RNA Biol. 2011;8:506–16. - PubMed
    1. Hornick NI, Huan J, Doron B, et al.. Serum Exosome MicroRNA as a Minimally-Invasive Early Biomarker of AML. Sci Rep. 2015;5:11295. - PMC - PubMed
    1. Kim KM, Abdelmohsen K, Mustapic M, et al.. RNA in extracellular vesicles. Wiley Interdiscip Rev RNA [Internet]. 2017;8 Available from: https://www.ncbi.nlm.nih.gov/pubmed/28130830 - PMC - PubMed
    1. Inns J, James V. Circulating microRNAs for the prediction of metastasis in breast cancer patients diagnosed with early stage disease. Breast. 2015;24:364–9. - PubMed

Publication types

MeSH terms