

Spectroscopic Signature for Stable β-Amyloid Fibrils versus β-Sheet-Rich Oligomers
- PMID: 29220175
- PMCID: PMC5969533
- DOI: 10.1021/acs.jpcb.7b10765
Spectroscopic Signature for Stable β-Amyloid Fibrils versus β-Sheet-Rich Oligomers
Abstract
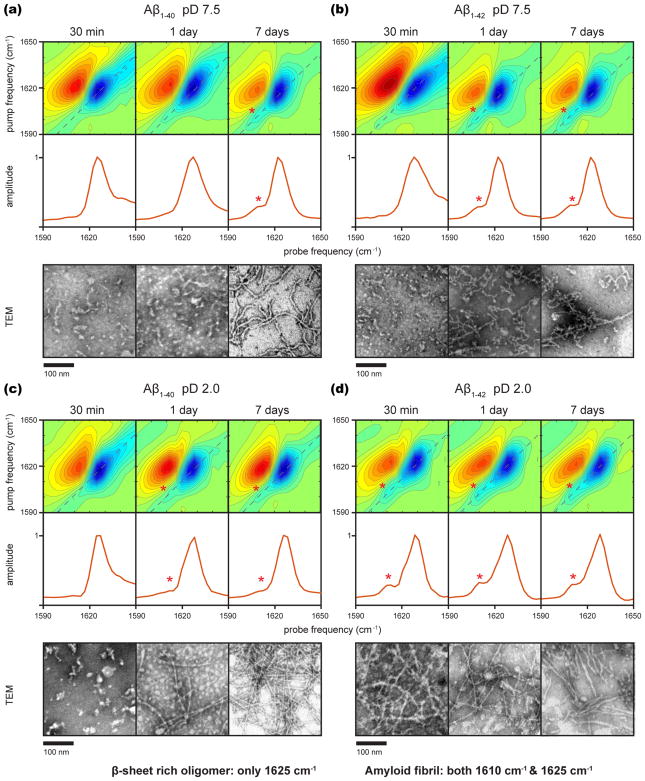
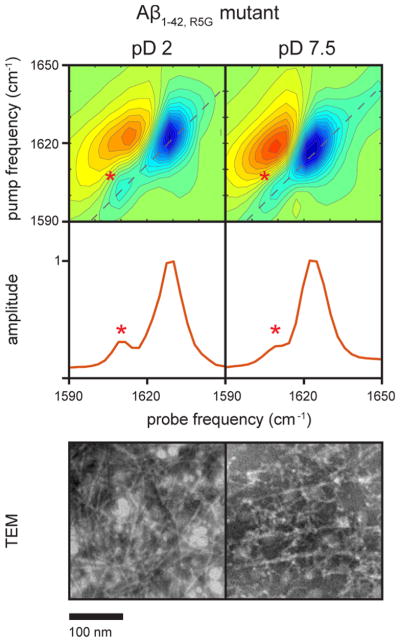
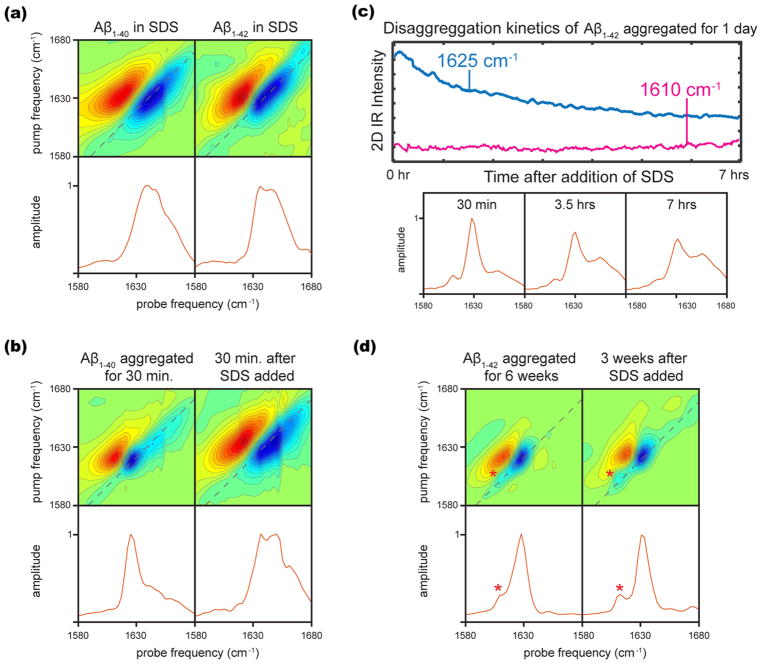
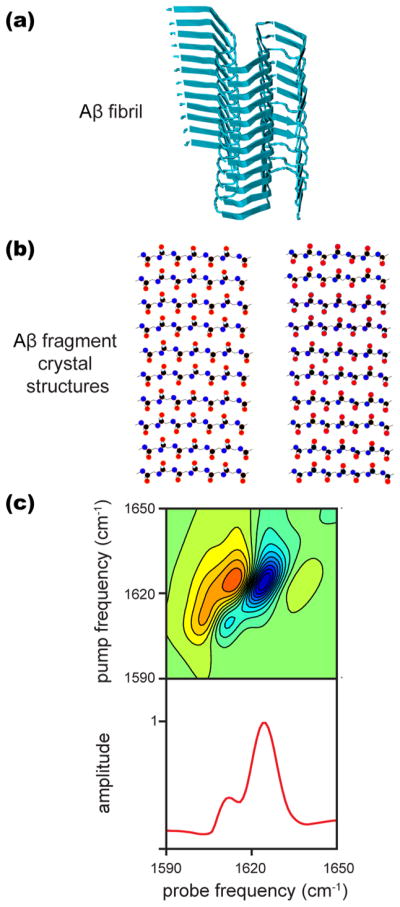
We use two-dimensional IR (2D IR) spectroscopy to explore fibril formation for the two predominant isoforms of the β-amyloid (Aβ1-40 and Aβ1-42) protein associated with Alzheimer's disease. Two-dimensional IR spectra resolve a transition at 1610 cm-1 in Aβ fibrils that does not appear in other Aβ aggregates, even those with predominantly β-sheet-structure-like oligomers. This transition is not resolved in linear IR spectroscopy because it lies under the broad band centered at 1625 cm-1, which is the traditional infrared signature for amyloid fibrils. The feature is prominent in 2D IR spectra because 2D lineshapes are narrower and scale nonlinearly with transition dipole strengths. Transmission electron microscopy measurements demonstrate that the 1610 cm-1 band is a positive identification of amyloid fibrils. Sodium dodecyl sulfate micelles that solubilize and disaggregate preaggregated Aβ samples deplete the 1625 cm-1 band but do not affect the 1610 cm-1 band, demonstrating that the 1610 cm-1 band is due to very stable fibrils. We demonstrate that the 1610 cm-1 transition arises from amide I modes by mutating out the only side-chain residue that could give rise to this transition, and we explore the potential structural origins of the transition by simulating 2D IR spectra based on Aβ crystal structures. It was not previously possible to distinguish stable Aβ fibrils from the less stable β-sheet-rich oligomers with infrared light. This 2D IR signature will be useful for Alzheimer's research on Aβ aggregation, fibril formation, and toxicity.
Conflict of interest statement
The authors declare the following competing financial interest(s): M.T.Z. is co-owner of PhaseTech Spectroscopy, Inc., which sells mid-IR and visible pulse shapers and 2D spectrometers.
Figures
References
-
- Chiti F, Dobson CM. Protein Misfolding, Functional Amyloid, and Human Disease. Annu Rev Biochem. 2006;75:333–366. - PubMed
-
- Jarrett JT, Berger EP, Lansbury PT. The Carboxy Terminus of the β-Amyloid Protein Is Critical for the Seeding of Amyloid Formation: Implications for the Pathogenesis of Alzheimer’s Disease. Biochemistry. 1993;32:4693–4697. - PubMed
-
- Iwatsubo T, Odaka A, Suzuki N, Mizusawa H, Nukina N, Ihara Y. Visualization of Aβ42(43) and Aβ40 in Senile Plaques with End-Specific Aβ Monoclonals: Evidence That an Initially Deposited Species Is Aβ 42(43) Neuron. 1994;13:45–53. - PubMed
-
- Selkoe DJ. Alzheimer’s Disease: Genes, Proteins, and Therapy. Physiol Rev. 2001;81:741–766. - PubMed
Publication types
MeSH terms
Substances
Grants and funding
LinkOut - more resources
Full Text Sources
Other Literature Sources
